Tutorial: Set up monitoring for SAP NetWeaver
This tutorial demonstrates how to configure Amazon CloudWatch Application Insights to set up monitoring for SAP NetWeaver. You can use CloudWatch Application Insights automatic dashboards to visualize problem details, accelerate troubleshooting, and reduce mean time to resolution (MTTR) for your SAP NetWeaver application servers.
CloudWatch Application Insights for SAP NetWeaver topics
Supported environments
CloudWatch Application Insights supports the deployment of Amazon resources for the following systems and patterns.
-
SAP NetWeaver Standard System Deployment.
-
SAP NetWeaver Distributed deployments on multiple Amazon EC2 instances.
-
Cross-AZ SAP NetWeaver high availability setup – SAP NetWeaver with high availability configured across two Availability Zones using SUSE/RHEL clustering.
Supported operating systems
CloudWatch Application Insights for SAP NetWeaver is supported on the following operating systems:
-
Oracle Linux 8
-
Red Hat Enterprise Linux 7.6
-
Red Hat Enterprise Linux 7.7
-
Red Hat Enterprise Linux 7.9
-
Red Hat Enterprise Linux 8.1
-
Red Hat Enterprise Linux 8.2
-
Red Hat Enterprise Linux 8.4
-
Red Hat Enterprise Linux 8.6
-
SUSE Linux Enterprise Server 15 for SAP
-
SUSE Linux Enterprise Server 15 SP1 for SAP
-
SUSE Linux Enterprise Server 15 SP2 for SAP
-
SUSE Linux Enterprise Server 15 SP3 for SAP
-
SUSE Linux Enterprise Server 15 SP4 for SAP
-
SUSE Linux Enterprise Server 12 SP4 for SAP
-
SUSE Linux Enterprise Server 12 SP5 for SAP
-
SUSE Linux Enterprise Server 15 except High Availability patterns
-
SUSE Linux Enterprise Server 15 SP1 except High Availability patterns
-
SUSE Linux Enterprise Server 15 SP2 except High Availability patterns
-
SUSE Linux Enterprise Server 15 SP3 except High Availability patterns
-
SUSE Linux Enterprise Server 15 SP4 except High Availability patterns
-
SUSE Linux Enterprise Server 12 SP4 except High Availability patterns
-
SUSE Linux Enterprise Server 12 SP5 except High Availability patterns
Features
CloudWatch Application Insights for SAP NetWeaver 7.0x–7.5x (including ABAP Platform) provides the following features:
-
Automatic SAP NetWeaver workload detection
-
Automatic SAP NetWeaver alarm creation based on static thresholds
-
Automatic SAP NetWeaver log pattern recognition
-
Health dashboard for SAP NetWeaver
-
Problem dashboard for SAP NetWeaver
Prerequisites
You must perform the following prerequisites to configure SAP NetWeaver with CloudWatch Application Insights:
-
Amazon Systems Manager enablement – Install SSM Agent on your Amazon EC2 instances, and enable the instances for SSM. For information about how to install the SSM Agent, see Setting up Amazon Systems Manager in the Amazon Systems Manager User Guide.
-
Amazon EC2 instance roles – You must attach the following Amazon EC2 instance roles to configure your SAP NetWeaver monitoring.
-
You must attach the
AmazonSSMManagedInstanceCorerole to enable Systems Manager. For more information, see Amazon Systems Manager identity-based policy examples. -
You must attach the
CloudWatchAgentServerPolicypolicy to enable instance metrics and logs to be emitted through CloudWatch. For more information, see Create IAM roles and users for use with CloudWatch agent.
-
-
Amazon resource groups – You must create a resource group that includes all of the associated Amazon resources used by your application stack to onboard your applications to CloudWatch Application Insights. This includes Amazon EC2 instances, Amazon EFS, and Amazon EBS volumes running your SAP NetWeaver application servers. If there are multiple SAP NetWeaver systems per account, we recommend that you create one resource group that includes the Amazon resources for each SAP NetWeaver system. For more information about creating resource groups, see the Amazon Resource Groups and Tags User Guide.
-
IAM permissions – For users who don't have administrative access, you must create an Amazon Identity and Access Management (IAM) policy that allows Application Insights to create a service-linked role and attach it to the user's identity. For more information about how to create the IAM policy, see IAM policy.
-
Service-linked role – Application Insights uses Amazon Identity and Access Management (IAM) service-linked roles. A service-linked role is created for you when you create your first Application Insights application in the Application Insights console. For more information, see Using service-linked roles for CloudWatch Application Insights.
-
Amazon CloudWatch agent – Application Insights installs and configures the CloudWatch agent. If you have CloudWatch agent installed, Application Insights retains your configuration. To avoid a merge conflict, remove the configuration of resources that you want to use in Application Insights from the existing CloudWatch agent configuration file. For more information, see Manually create or edit the CloudWatch agent configuration file.
Set up your SAP NetWeaver application servers for monitoring
Use the following steps to set up monitoring for your SAP NetWeaver application servers.
To set up monitoring
-
Open the CloudWatch console
. -
From the left navigation pane, under Insights, select Application Insights.
-
The Application Insights page displays the list of applications that are monitored with Application Insights, and the monitoring status for each application. In the upper right-hand corner, select Add an application.
-
On the Specify application details page, from the dropdown list under Resource group, select the Amazon resource group you created that contains your SAP NetWeaver resources. If you haven't created a resource group for your application, you can create one by choosing Create new resource group under the Resource group dropdown list.
-
Under Automatic monitoring of new resources, select the check box to allow Application Insights to automatically monitor the resources that are added to the application's resource group after onboarding.
-
Under Monitor EventBridge events, select the check box to integrate Application Insights monitoring with CloudWatch Events to get insights from Amazon EBS, Amazon EC2, Amazon CodeDeploy, Amazon ECS, Amazon Health APIs and notifications, Amazon RDS, Amazon S3, and Amazon Step Functions.
-
Under Integrate with Amazon Systems Manager OpsCenter, select the check box next to Generate Amazon Systems Manager OpsCenter OpsItems for remedial actions to view and get notifications when problems are detected for the selected applications. To track the operations that are performed to resolve operational work items, called OpsItems, that are related to your Amazon resources, provide an SNS topic ARN.
-
You can optionally enter tags to help you identify and organize your resources. CloudWatch Application Insights supports both tag-based and Amazon CloudFormation stack-based resource groups, with the exception of Application Auto Scaling groups. For more information, see Tag Editor in the Amazon Resource Groups and Tags User Guide.
-
To review detected components, choose Next.
-
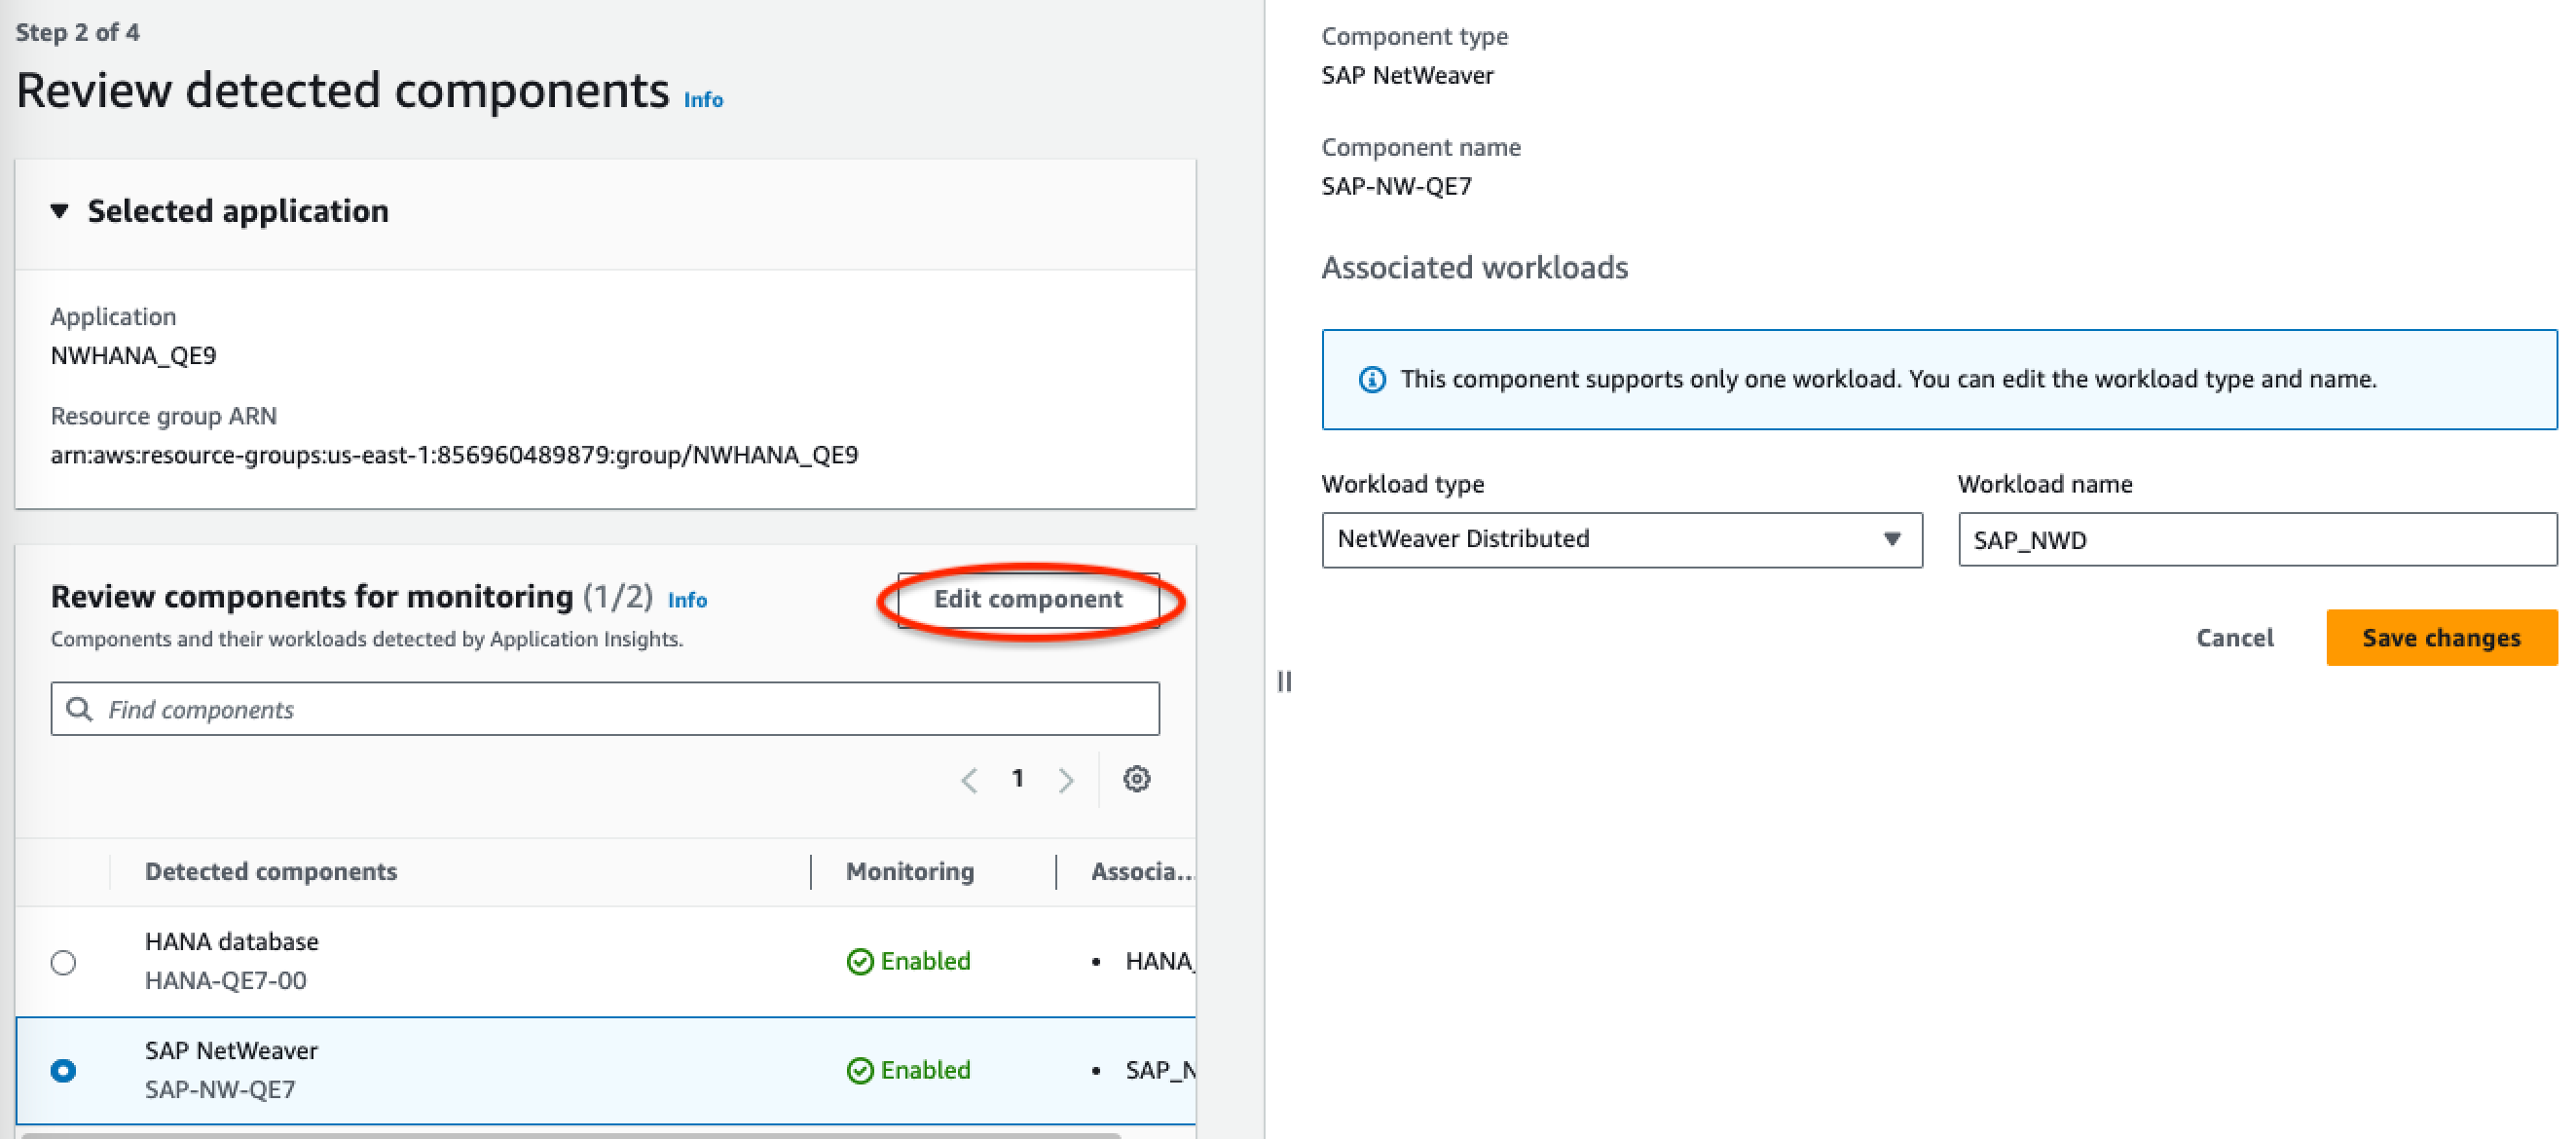
On the Review detected components page, the monitored components and their workloads automatically detected by CloudWatch Application Insights are listed.
-
To edit the workload type and name, choose Edit component.
Note
Components that contain a detected NetWeaver Distributed or NetWeaver High Availability workload support only one workload on a component.
-
-
Choose Next.
-
On the Specify component details page, choose Next.
-
Review your application monitoring configuration, then choose Submit.
-
The application details page opens, where you can view the Application summary, Dashboard, Components, and Workloads. You can also view the Configuration history, Log patterns, and any Tags that you have created. After you submit your application, CloudWatch Application Insights deploys all of the metrics and alarms for your SAP NetWeaver system, which can take up to an hour.
Manage monitoring of your SAP NetWeaver application servers
Use the following steps to manage monitoring of your SAP NetWeaver application servers.
To manage monitoring
-
Open the CloudWatch console
. -
From the left navigation pane, under Insights, select Application Insights.
-
Choose the List view tab.
-
The Application Insights page displays the list of applications that are monitored with Application Insights, and the monitoring status for each application.
-
Select your application.
-
Choose the Components tab.
-
Under Monitored components, select the radio button next to the component name. Then, select Manage monitoring.
-
Under Instance logs, you can update the existing log path, log pattern set, and log group name. In addition, you can add up to three additional Application logs.
-
Under Metrics, you can select the SAP NetWeaver metrics according to your requirements. SAP NetWeaver metric names are prefixed with
sap. You can add up to 40 metrics per component. -
Under Custom alarms, you can add additional alarms to be monitored by CloudWatch Application Insights.
-
Review your application monitoring configuration and choose Save. When you submit your configuration, your account updates all of the metrics and alarms for your SAP NetWeaver systems.
View and troubleshoot SAP NetWeaver problems detected by CloudWatch Application Insights
The following sections provide steps to help you resolve common troubleshooting scenarios that occur when you configure monitoring for SAP NetWeaver on Application Insights.
Troubleshooting topics
SAP NetWeaver database connectivity issues
Description
Your SAP NetWeaver application experiences database connectivity issues.
Cause
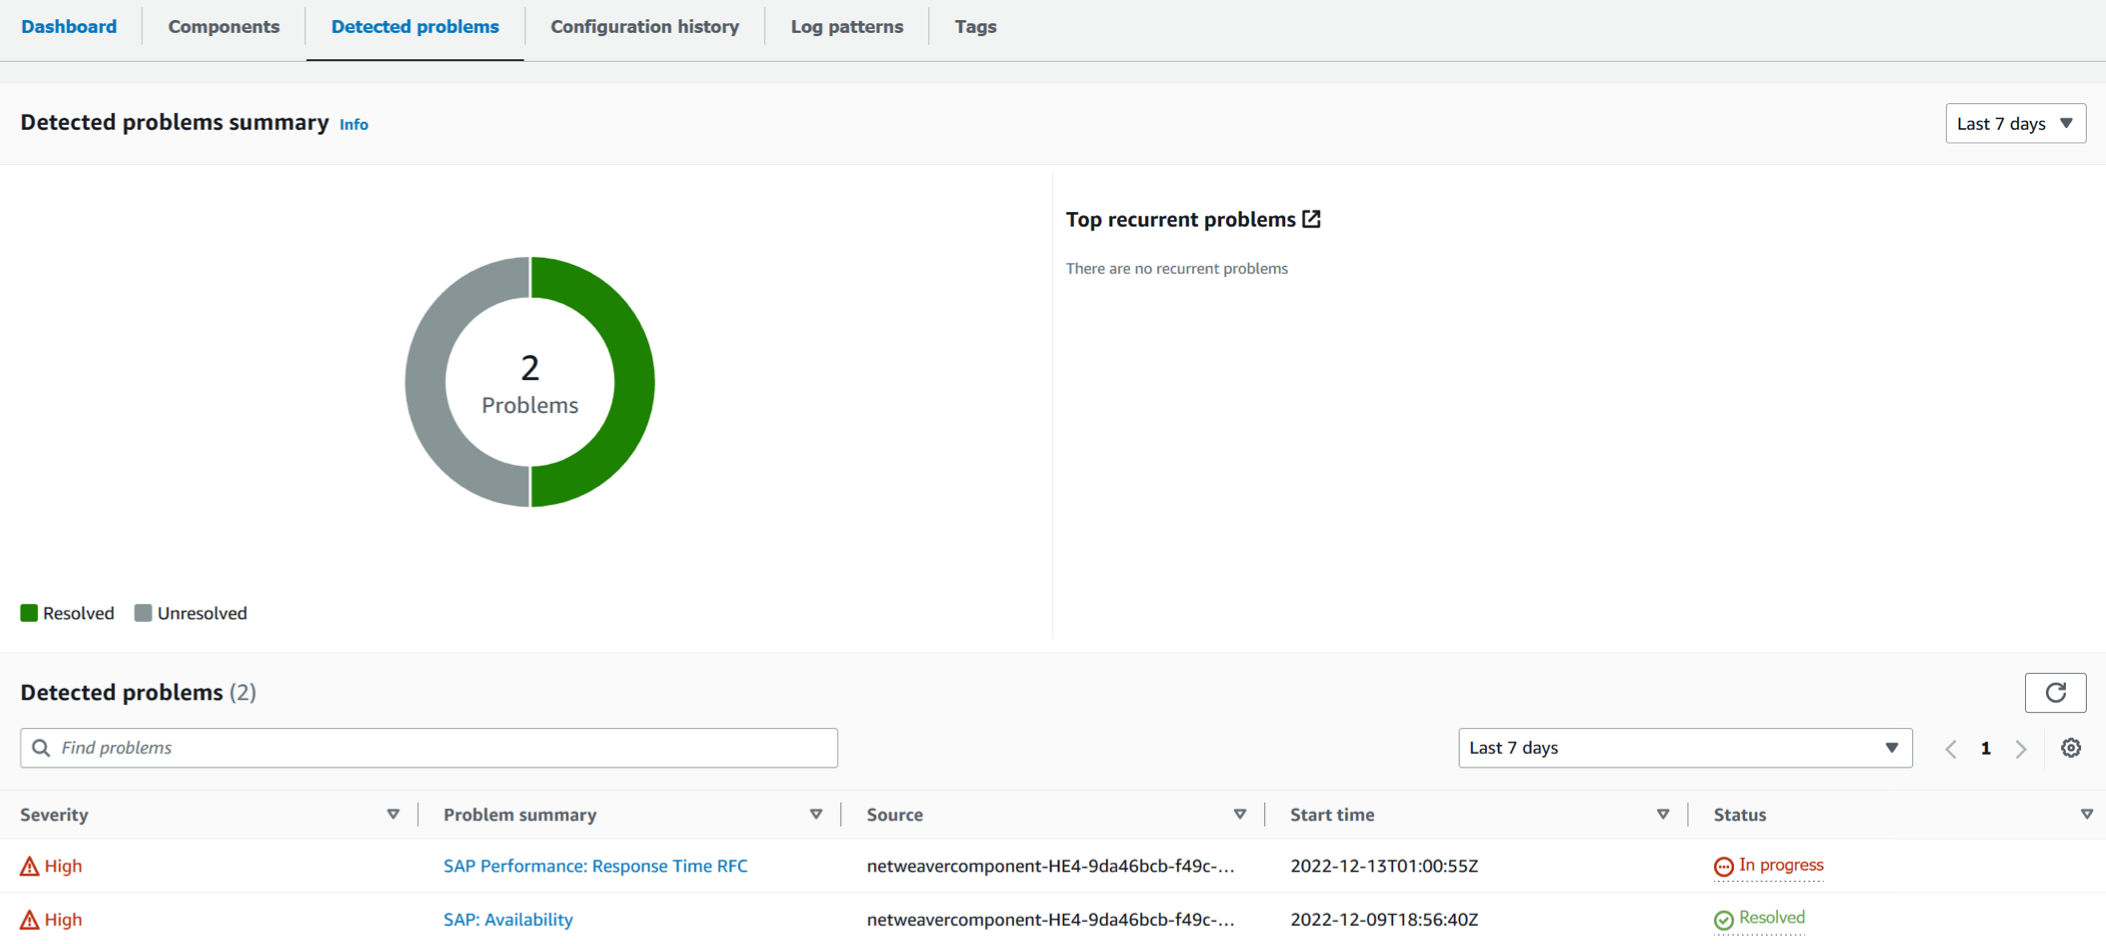
You can identify the connectivity issue by going to the CloudWatch Application Insights console and checking the SAP NetWeaver Application Insights problem dashboard. Select the link under Problem summary to see the specific issue.
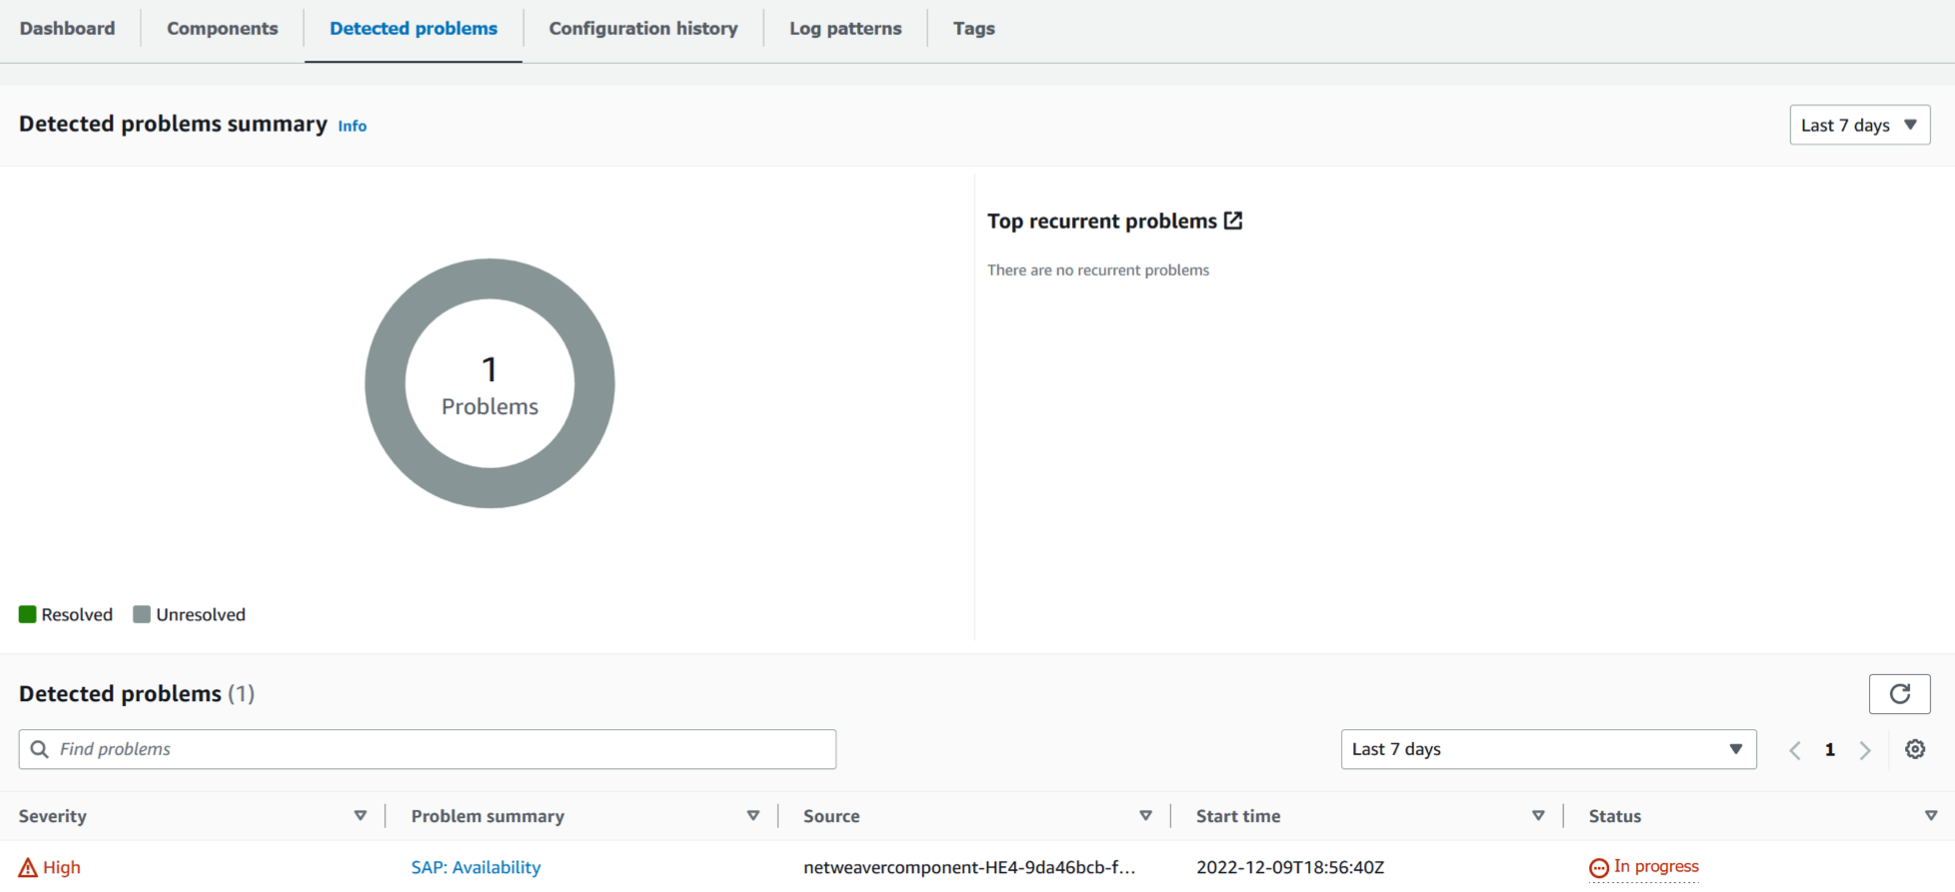
In the following example, under Problem summary, SAP: Availability is the issue.
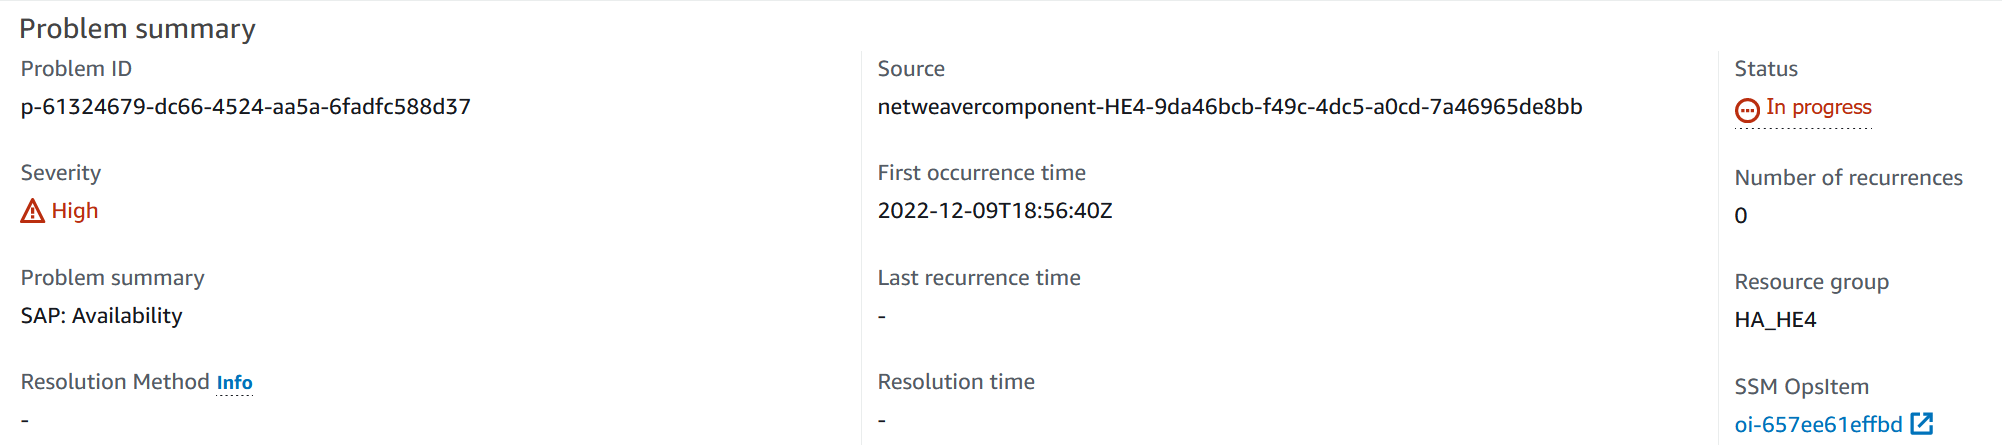
Immediately following the Problem summary, the Insight section provides more context about the error and where you can get more information about the causes of the issue.

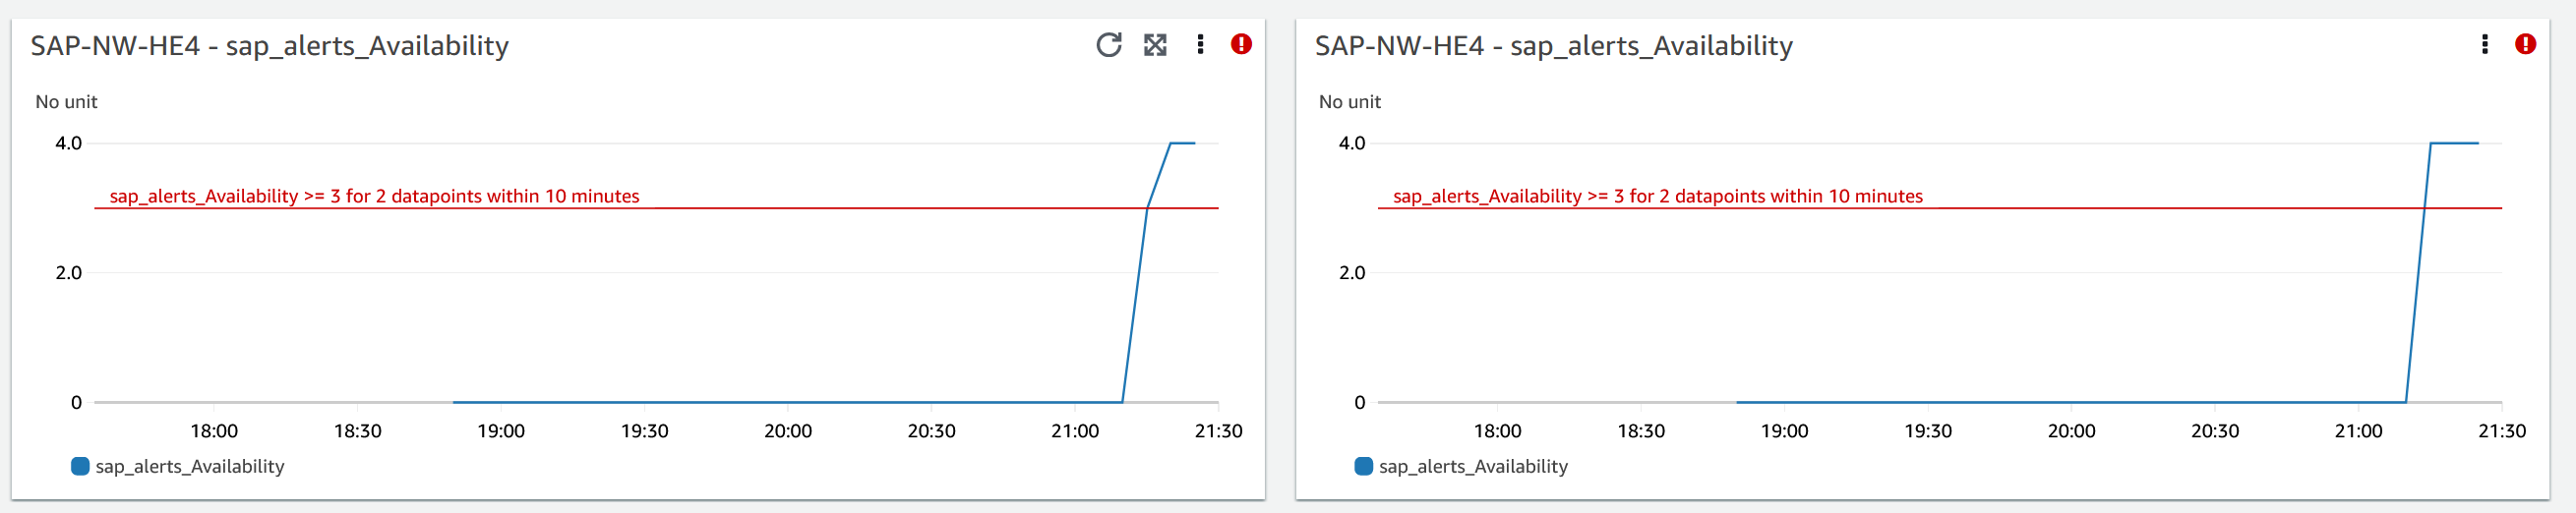
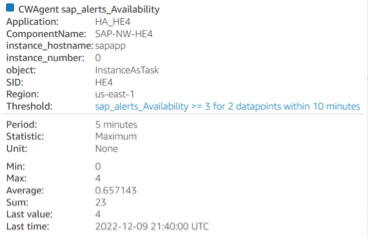
On the same problem dashboard, you can view related logs and metrics that problem detection has grouped together to help you isolate the cause of the error. The sap_alerts_Availability metric tracks the availability of the SAP
NetWeaver system over time. You can use historical tracking to correlate when the metric initiated an error state or breached the alarm threshold. In the following example, there is an availability issue with the
SAP NetWeaver system. The example shows two alarms because there are two SAP
application server instances and an alarm was created for each instance.
For more information about each alarm, hover over the
sap_alerts_Availability metric name.
In the following example, the sap_alerts_Database metric shows that
the database layer has an issue or a failure. This alarm indicates that SAP
NetWeaver had issues connecting to or communicating with its database.
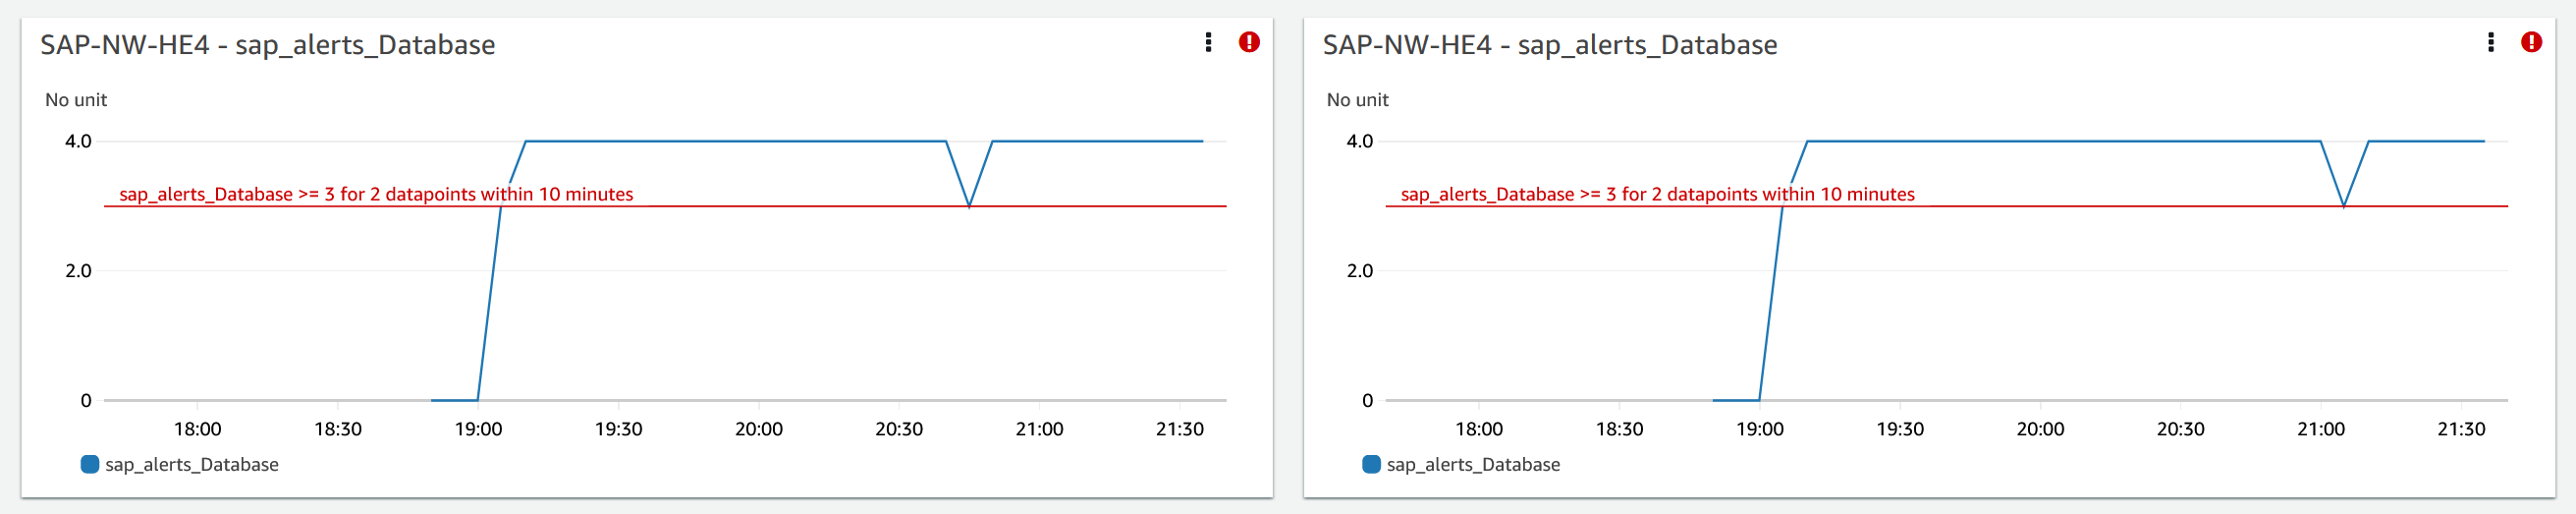
Since the database is a key resource for SAP NetWeaver, you may get many related
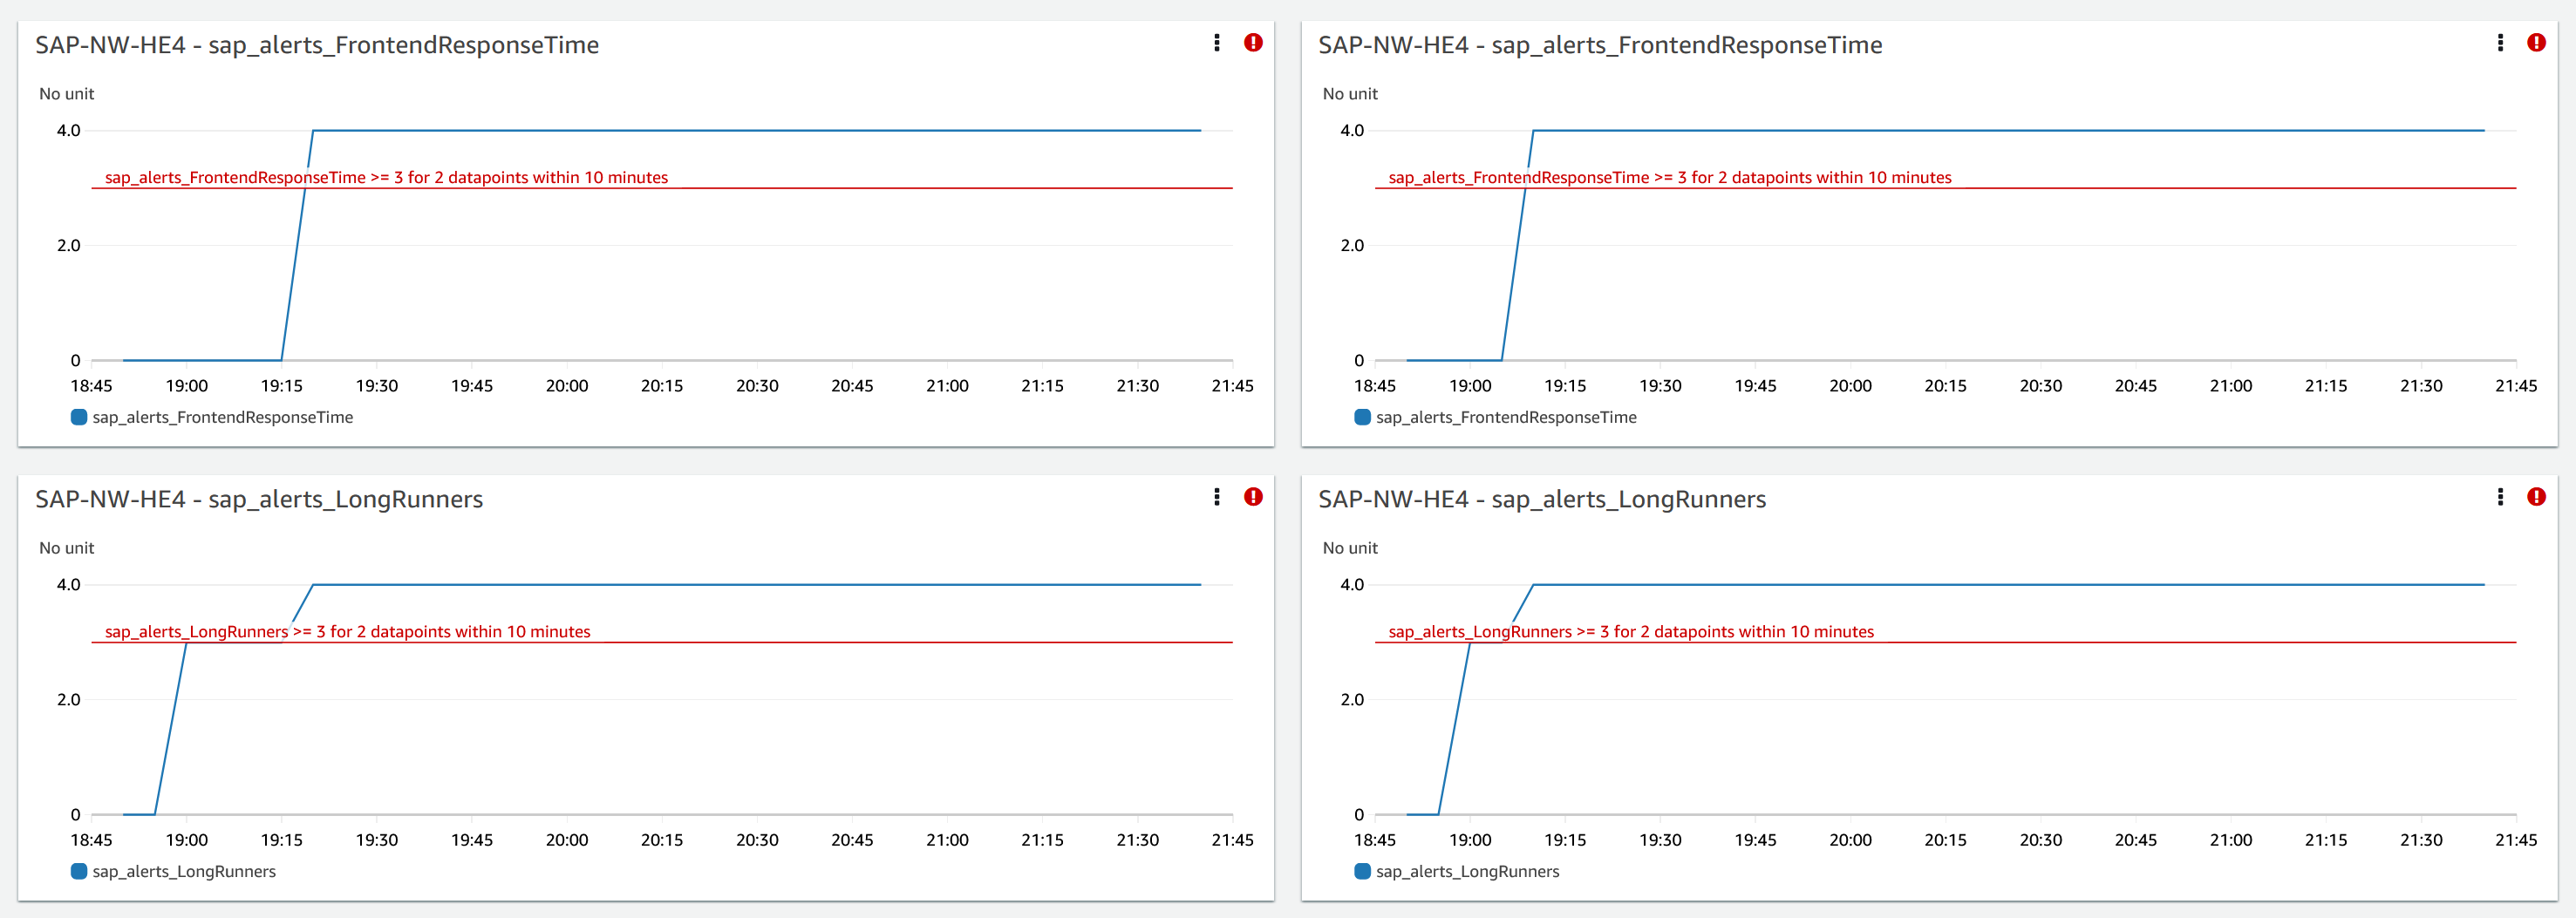
alarms when the database has an issue or failure. In the following example, the
sap_alerts_FrontendResponseTime and
sap_alerts_LongRunners metrics are initiated because the database
is not available.
Resolution
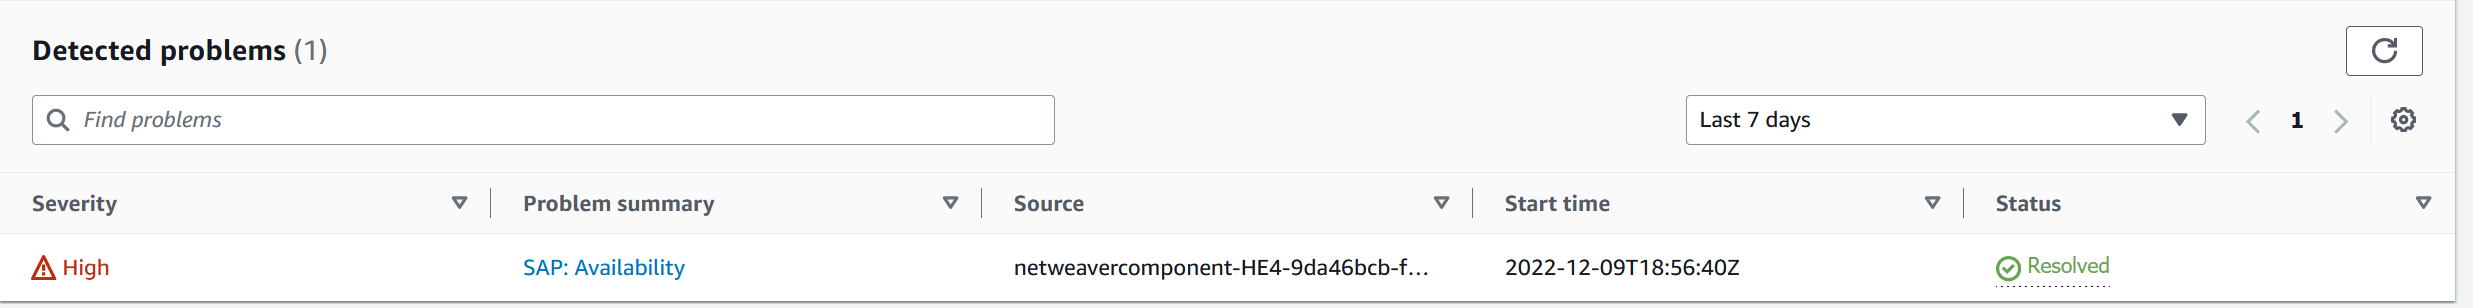
Application Insights monitors the detected problem hourly. If there are no new related log entries in your SAP NetWeaver log files, the older log entries will be treated as resolved. You must fix any error conditions related to the CloudWatch alarms. After the error conditions are fixed, the alarm is resolved when the alarms and logs are recovered. When all of the CloudWatch log errors and alarms are resolved, Application Insights stops detecting errors and the problem is automatically resolved within an hour. We recommend that you resolve all log error conditions and alarms so that you have the latest problems on the problem dashboard.
In the following example, the SAP Availability issue is resolved.
SAP NetWeaver application availability issues
Description
Your SAP NetWeaver High Availability Enqueue replication stopped working.
Cause
You can identify the connectivity issue by going to the CloudWatch Application Insights console and checking the SAP NetWeaver Application Insights problem dashboard. Select the link under Problem summary to see the specific issue.
In the following example, under Problem summary, High Availability Enqueue Replication is the issue.
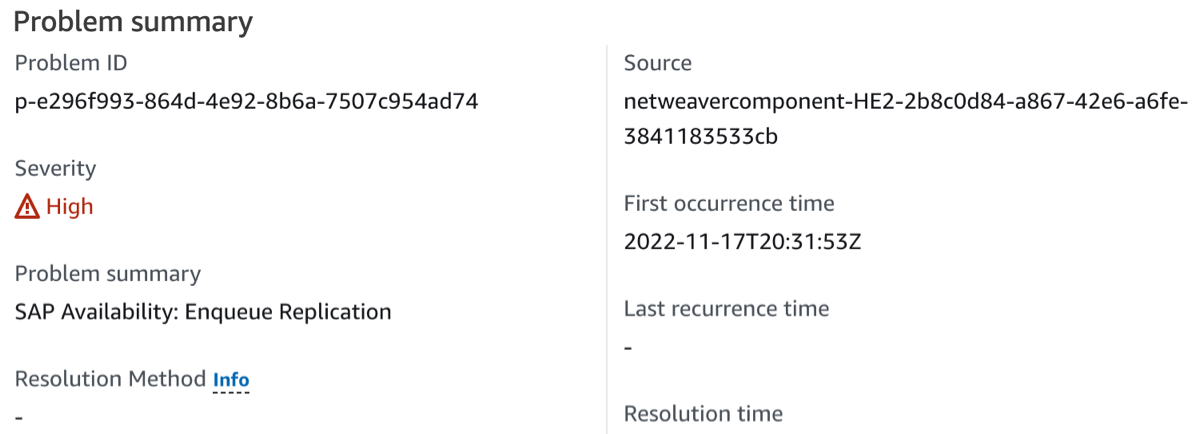
Immediately following the Problem summary, the Insight section provides more context about the error and where you can get more information about the causes of the issue.

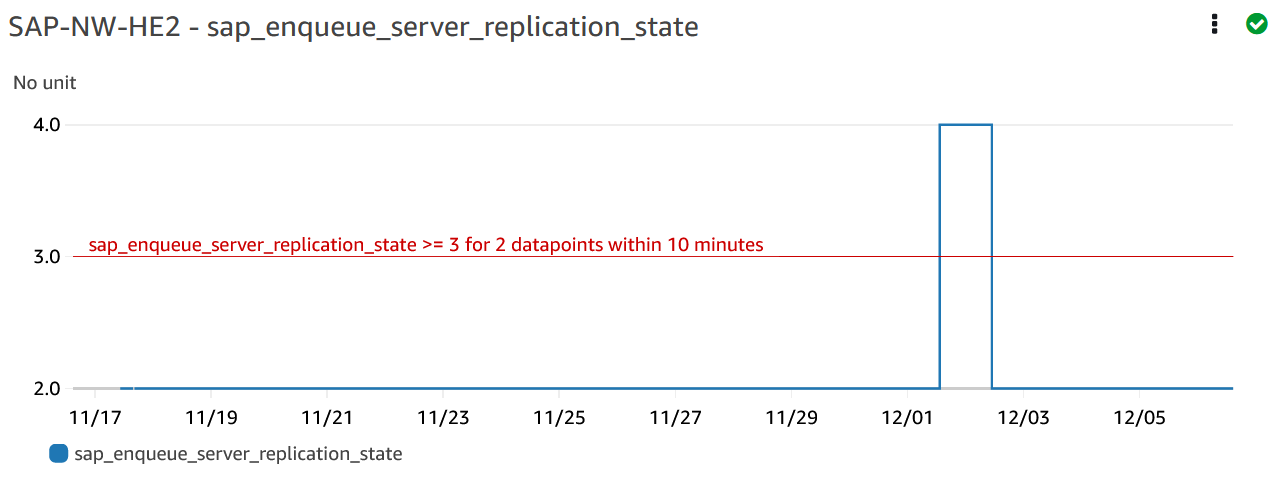
The following example shows the problem dashboard where you view logs and metrics which are grouped to help you isolate the causes of the error. The sap_enqueue_server_replication_state metric tracks the value over time. You can use historical tracking to correlate when
the metric initiated an error state or breached the alarm threshold.
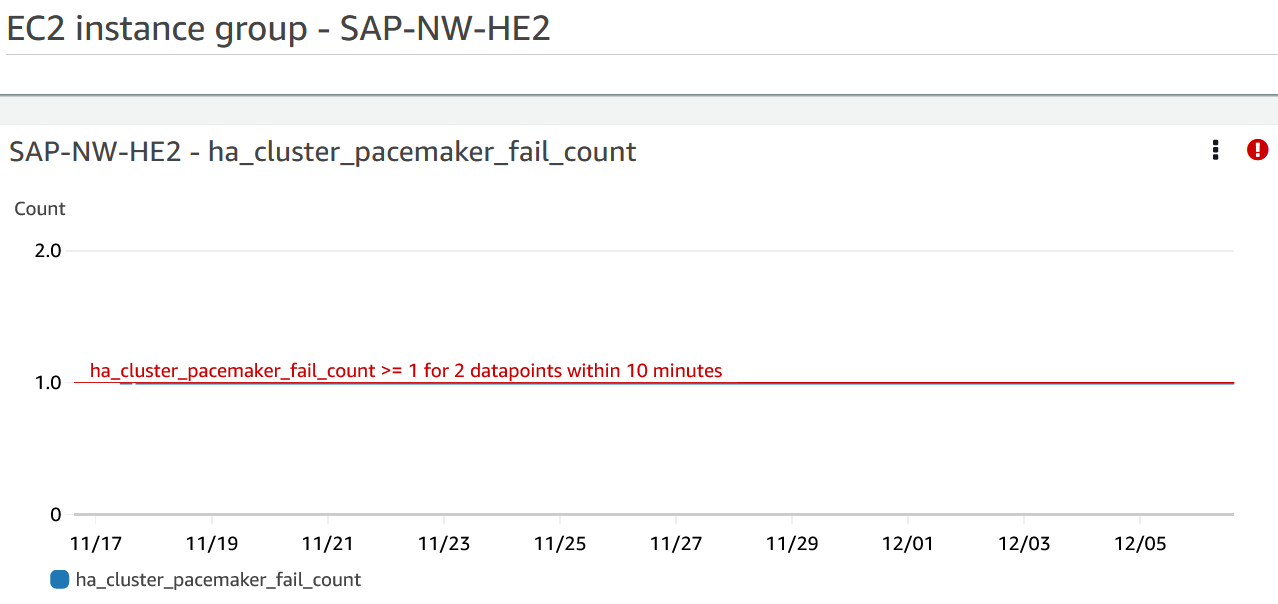
In the following example, the ha_cluster_pacemaker_fail_count metric
shows that the high availability pacemaker cluster experienced a resource failure.
The specific pacemaker resources that had a fail count greater than or equal to one
are identified in the component dashboard.
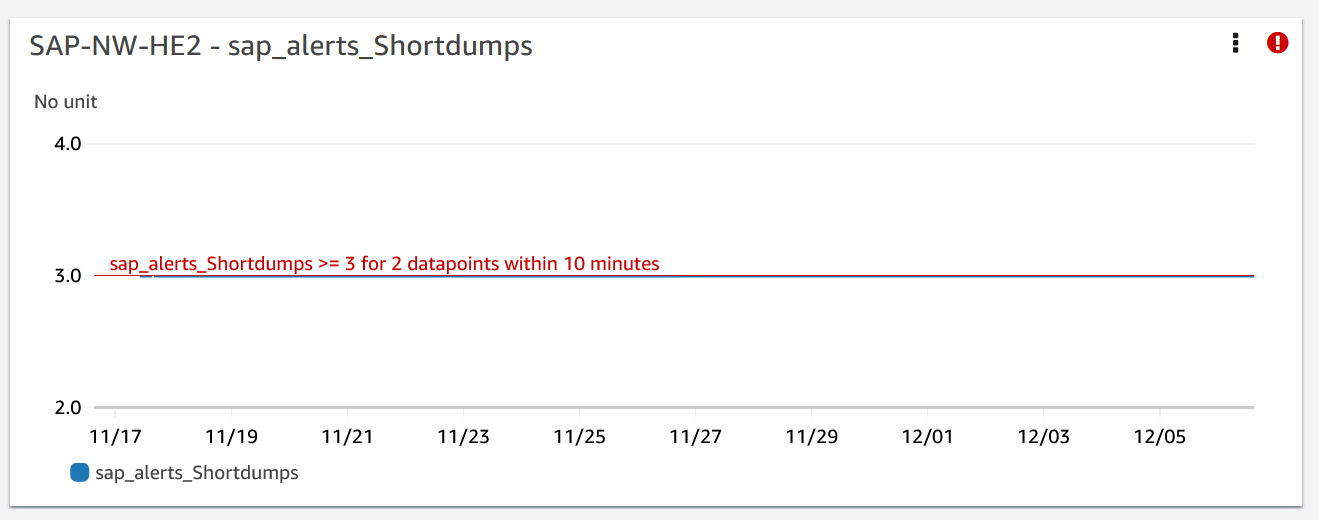
The following example shows the sap_alerts_Shortdumps metric, which
indicates that the SAP application performance was reduced when the problem was
detected.
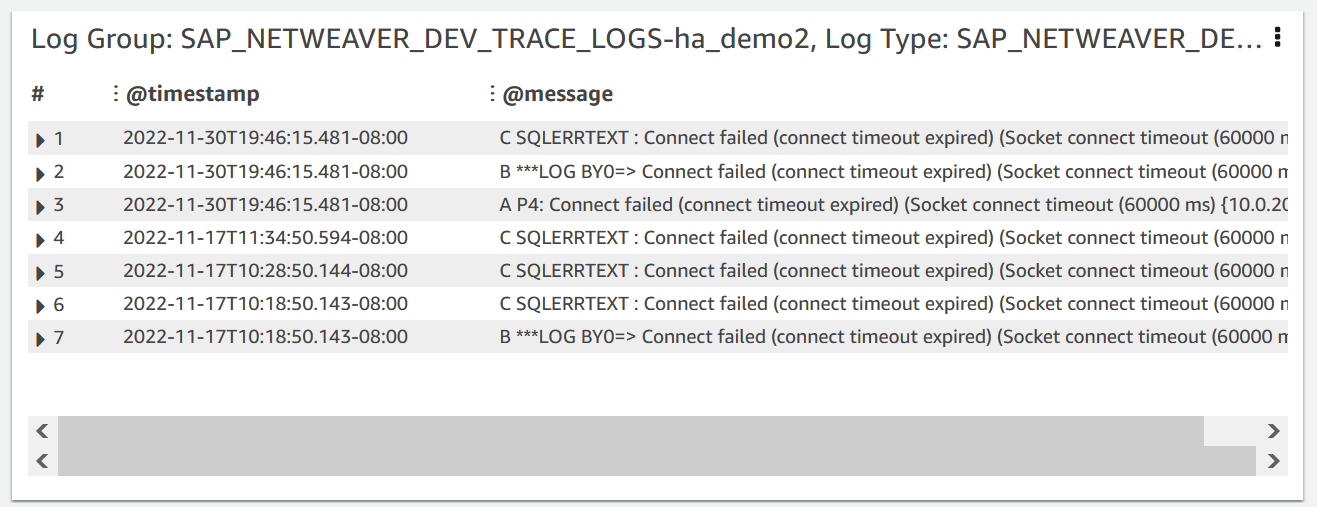
Logs
The log entries are helpful to get a better understanding of issues that occurred at the SAP NetWeaver layer when the problem was detected. The log group widget in the problem dashboard shows the specific time of the issue.
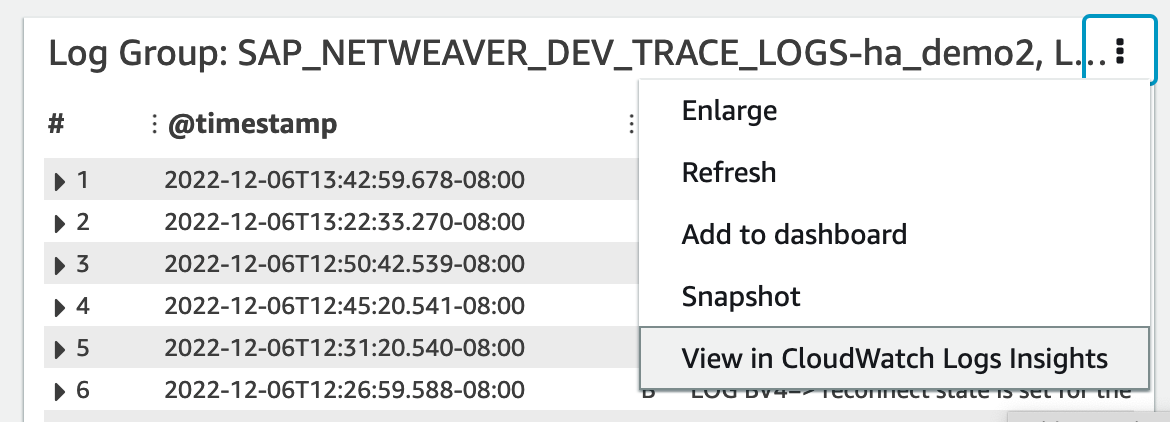
To see detailed information about the logs, select the three vertical dots in the upper-right corner, and select View in CloudWatch Logs Insights.
Use the following steps to get more information about the metrics and alarms displayed in the problem dashboard.
To get more information about metrics and alarms
-
Open the CloudWatch console
. -
In the left navigation pane, under Insights, select Application Insights. Then, choose the List view tab, and select your application.
-
Select the Components tab. Then, select the SAP NetWeaver component about which you want to get more information.
The following example shows the HA Metrics section with the
ha_cluster_pacemaker_fail_countmetric that was displayed in the problem dashboard.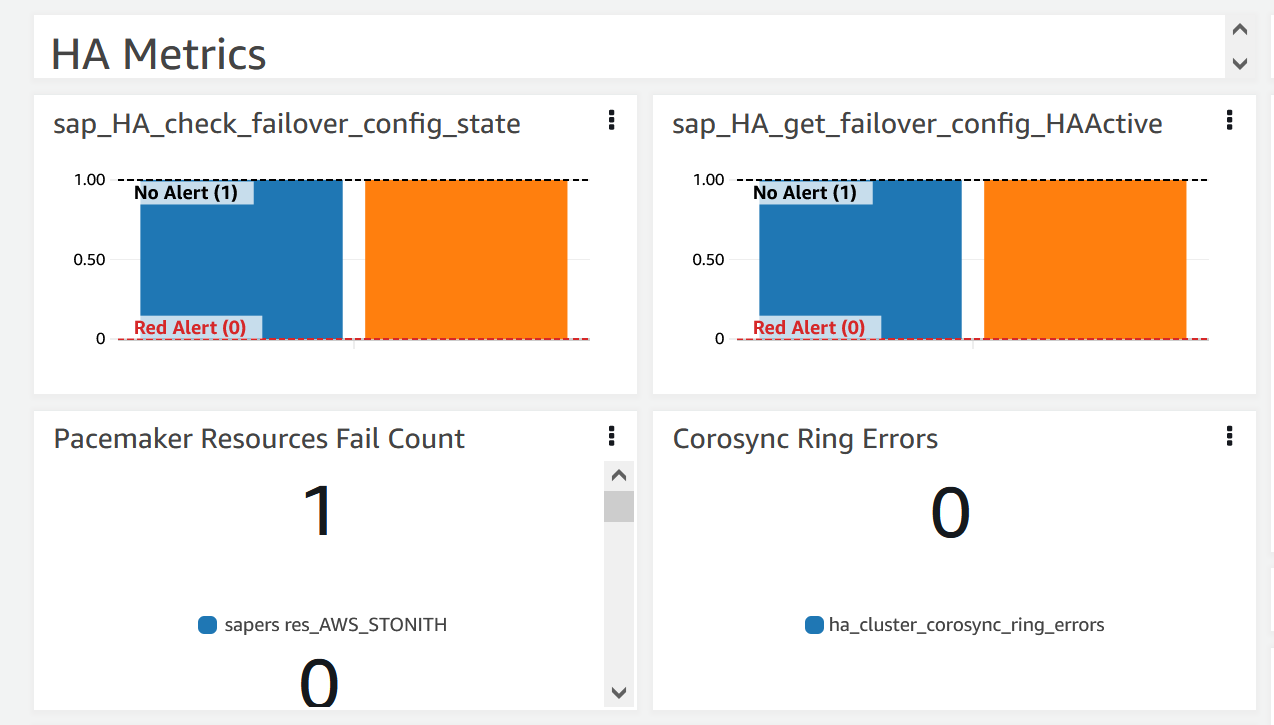
Resolution
Application Insights monitors the detected problem hourly. If there are no new related log entries in your SAP NetWeaver log files, the older log entries will be treated as resolved. You must fix any error conditions related to this problem.
For the sap_alerts_Shortdumps alarm, you must resolve the alert in
the SAP NetWeaver system by using transaction code RZ20 → R3Abap →
Shortdumps to navigate to the CCMS alert. For more information about CCMS
alerts, see the SAP website.
When all of the CloudWatch log errors and alarms are resolved, Application Insights stops detecting errors and the problem is automatically resolved within an hour. We recommend that you resolve all log error conditions and alarms so that you have the latest problems on the problem dashboard. In the following example, the SAP Netweaver High Availability Enqueue Replication problem is resolved.

Troubleshooting Application Insights for SAP NetWeaver
This section provides steps to help you resolve common errors returned by the Application Insights dashboard.
Unable to add more than 60 monitor metrics
Error returned: Component cannot have more than 60 monitored metrics.
Root cause: The current metric limit is 60 monitor metrics per component.
Resolution: Remove metrics that are not necessary to adhere to the limit.
SAP metrics do not appear on the dashboard after the onboarding process
Root cause: Component Dashboard uses a five minute metric period to aggregate the data points.
Resolution: All metrics should show up on the dashboard after five minutes.
SAP metrics and alarms don't appear on the dashboard
Use the following steps to identify why SAP metrics and alarms don't appear on the dashboard after the onboarding process.
To identify the issue with metrics and alarms
-
Open the CloudWatch console
. -
In the left navigation pane, under Insights, select Application Insights. Then, choose the List view tab, and select your application.
-
Choose the Configuration history tab.
-
If you see missing metrics datapoints, check for errors related to
prometheus-sap_host_exporter. -
If you don't find an error in the previous step, Connect to your Linux instance. For High Availability deployments, connect to the primary cluster Amazon EC2 instance.
-
In your instance, verify that the exporter is running by using the following command. The default port is
9680. If you are using a different port, replace9680with the port you are using.curl localhost:9680/metricsIf no data is returned, then the exporter failed to start.
-
To find the correct naming convention to use for
WORKLOAD_SHORT_NAMEin the next two steps, run the following command.Note
Application Insights adds a suffix,
WORKLOAD_SHORT_NAME, to the service name depending on the workload that is running. The short names for NetWeaver Distributed, Standard, and High Availability deployments areSAP_NWD,SAP_NWS, andSAP_NWH.sudo systemctl | grep exporter -
To check for errors in the exporter service logs, run the following command:
sudo journalctl -e --unit=prometheus-sap_host_exporter_WORKLOAD_SHORT_NAME.service -
To check for errors in the exporter manager service logs, run the following command:
sudo journalctl -e --unit=prometheus-sap_host_exporter_manager_WORKLOAD_SHORT_NAME.serviceNote
This service should be up and running at all times.
If this command does not return an error, continue to the next step.
-
To manually start the exporter, run the following command. Then, check the exporter output.
sudo /opt/aws/sap_host_exporter/sap_host_exporterYou can exit the exporter process after you check for errors.
Root cause: There are several possible causes for this issue. A common cause is that the exporter is not able to connect to one of the application server instances.
Resolution
Use the following steps to connect the exporter to the application server instances. You will verify that the SAP application instance is running and use SAPControl to connect to the instance.
To connect the exporter to the application server instances
-
In your Amazon EC2 instance, run the following command to verify that the SAP application is running.
sapcontrol -nr <App_InstNo> -function GetProcessList -
You must establish a working SAPControl connection. If the SAPControl connection doesn't work, find the root cause of the issue on the relevant SAP application instance.
-
To manually start the exporter after you fix the SAP Control connection issue, run the following command:
sudo systemctl start prometheus-sap_host_exporter.service -
If you can't resolve the SAPControl connection issue, use the following procedure as a temporary fix.
-
Open the Amazon Systems Manager console
. -
From the left navigation pane, choose State Manager.
-
Under Associations search for the SAP NetWeaver system's association.
Association Name: Equal: AWS-ApplicationInsights-SSMSAPHostExporterAssociationForCUSTOMSAPNW<SID>-1 -
Select the Association id.
-
Choose the Parameters tab and remove the application server number from additionalArguments.
-
Choose Apply Association Now.
Note
This is a temporary fix. If updates are made to the component's monitoring configurations, the instance will be added back.
-