Viewing Performance Insights proactive recommendations
Amazon RDS Performance Insights monitors specific metrics and automatically creates thresholds by analyzing what levels might be potentially problematic for a specified resource. When the new metric values cross a predefined threshold over a given period of time, Performance Insights generates a proactive recommendation. This recommendation helps to prevent future database performance impact. To receive these proactive recommendations, you must turn on Performance Insights with a paid tier retention period.
For more information about turning on Performance Insights, see Turning Performance Insights on and off for Amazon RDS. For information about pricing and data retention for Performance Insights, see Pricing and data retention for Performance Insights.
To find out the regions, DB engines, and instance classes supported for the proactive recommendations, see Amazon RDS DB engine, Region, and instance class support for Performance Insights features.
You can view the detailed analysis and recommended investigations of proactive recommendations in the recommendation details page.
For more information about recommendations, see Recommendations from Amazon RDS.
To view the detailed analysis of a proactive recommendation
Sign in to the Amazon Web Services Management Console and open the Amazon RDS console at https://console.amazonaws.cn/rds/
. In the navigation pane, do any of the following:
Choose Recommendations.
The Recommendations page displays a list of recommendations sorted by the severity for all the resources in your account.
Choose Databases and then choose Recommendations for a resource in the databases page.
The Recommendations tab displays the recommendations and its details for the selected resource.
-
Find a proactive recommendation and choose View details.
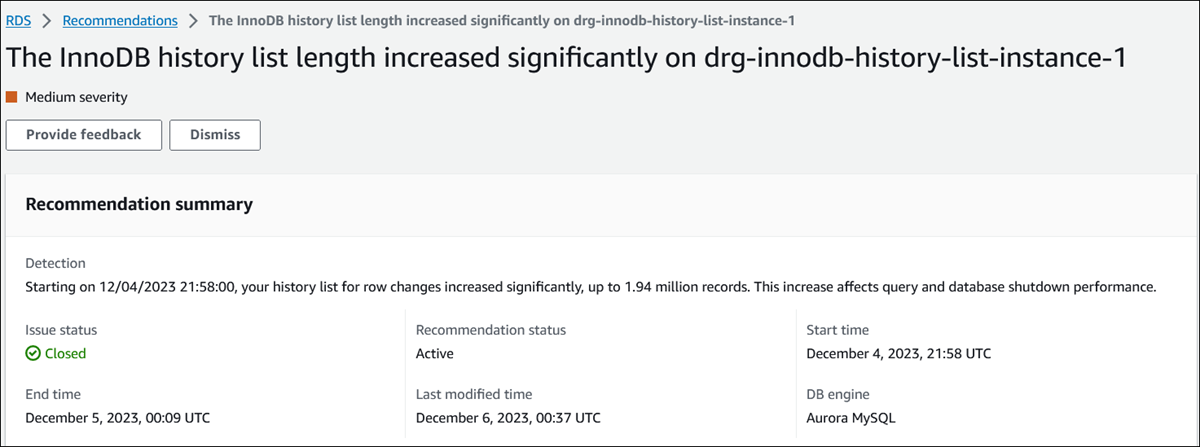
The recommendation details page appears. The title provides the name of the affected resource with the issue detected and the severity.
The following are the components on the recommendation details page:
-
Recommendation summary – The detected issue, recommendation and issue status, issue start and end time, recommendation modified time, and the engine type.
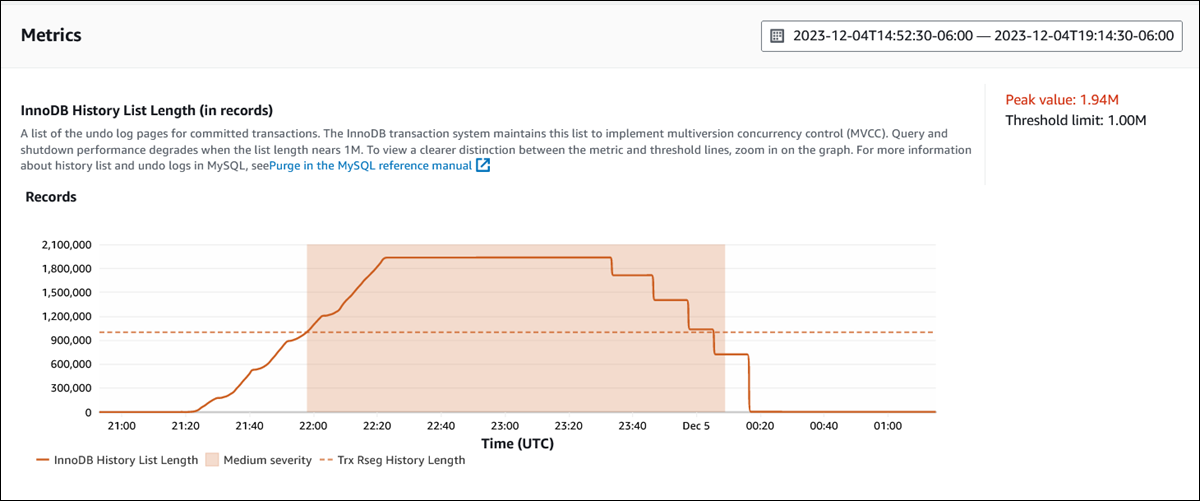
Metrics – The graphs of the detected issue. Each graph displays a threshold determined by the resource's baseline behavior and data of the metric reported from the issue start time.
Analysis and recommendations – The recommendation and the reason for the suggested recommendation.
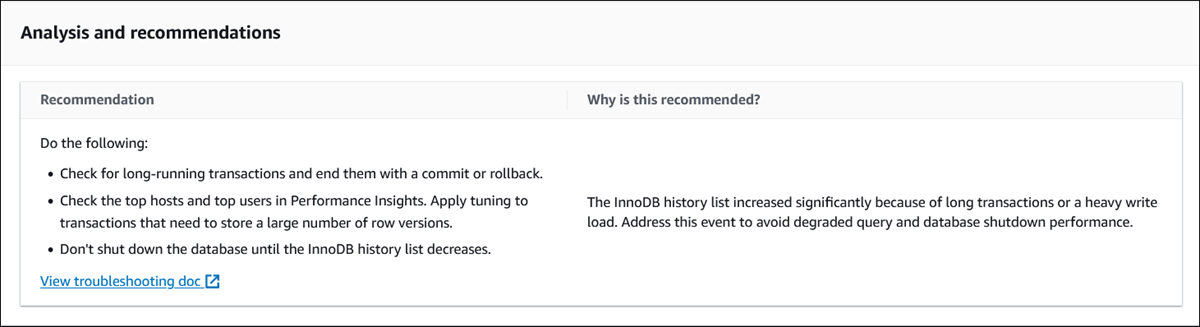
You can review the cause of the issue and then perform the suggested recommended actions to fix the issue, or choose Dismiss in the upper right to dismiss the recommendation.
-