Viewing SQL statistics in the Performance Insights dashboard
In the Performance Insights dashboard, SQL statistics are available in the Top SQL tab of the Database load chart.
To view SQL statistics
Open the Amazon RDS console at https://console.amazonaws.cn/rds/
. -
In the left navigation pane, choose Performance Insights.
-
At the top of the page, choose the database whose SQL statistics you want to see.
-
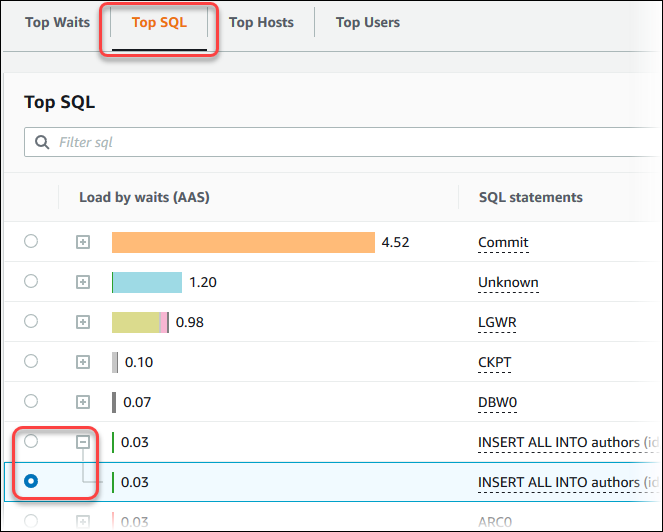
Scroll to the bottom of the page and choose the Top SQL tab.
-
Choose an individual statement or digest query.
-
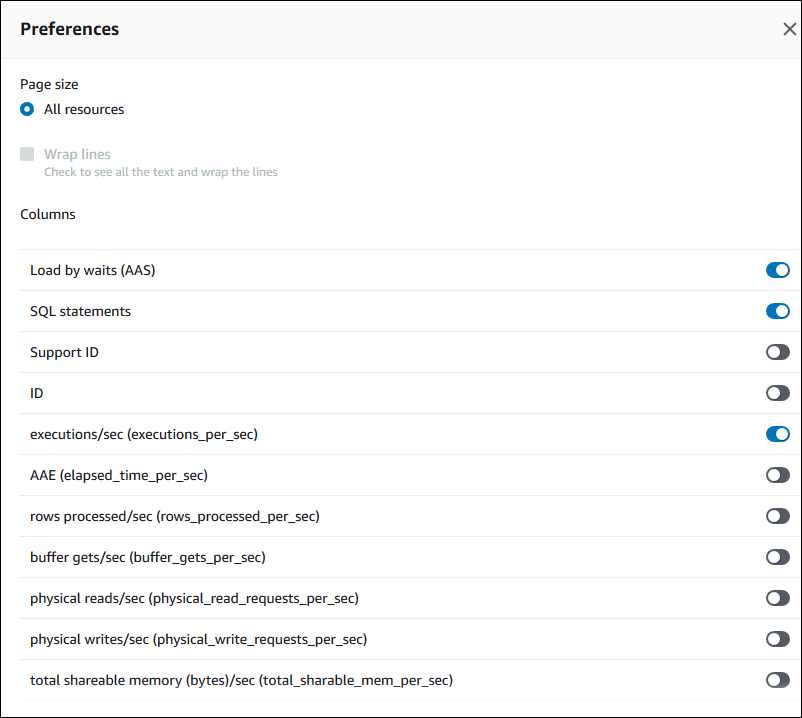
Choose which statistics to display by choosing the gear icon in the upper-right corner of the chart. For descriptions of the SQL statistics for the Amazon RDS engines, see SQL statistics for Performance Insights.
The following example shows the statistics preferences for Oracle DB instances.
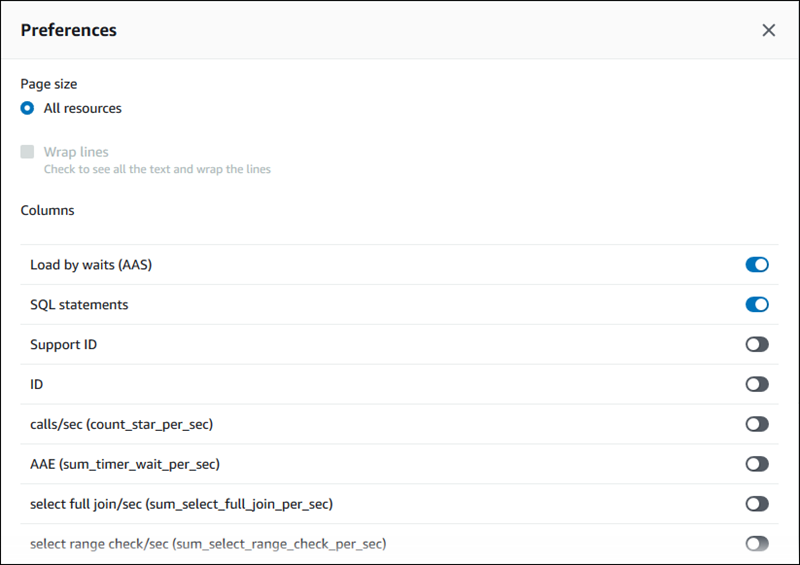
The following example shows the preferences for MariaDB and MySQL DB instances.
-
Choose Save to save your preferences.
The Top SQL table refreshes.
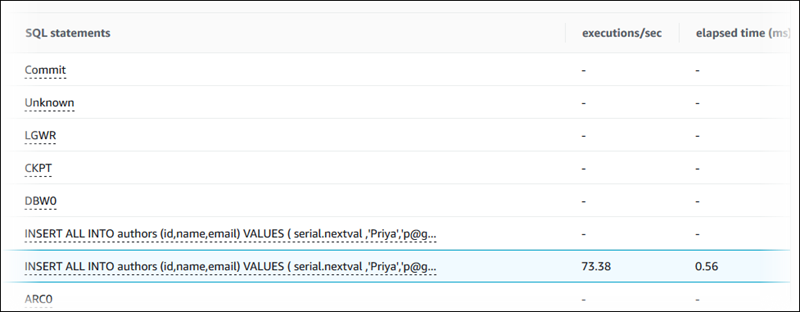
The following example shows statistics for an Oracle SQL query.