排查 Aurora MySQL 数据库的内存使用问题
虽然 CloudWatch、增强监控和性能详情可以很好地概述操作系统级别的内存使用情况,例如数据库进程使用了多少内存,但它们不允许您细分引擎中的哪些连接或组件可能导致这种内存使用。
要对此进行故障排除,您可以使用 Performance Schema 和 sys 架构。在 Aurora MySQL 版本 3 中,当启用 Performance Schema 时,默认情况下会启用内存检测。在 Aurora MySQL 版本 2 中,默认情况下,仅对 Performance Schema 内存使用情况启用内存检测。有关 Performance Schema 中可用于跟踪内存使用情况和启用 Performance Schema 内存检测的表的信息,请参阅 MySQL 文档中的 Memory summary tables
虽然 Performance Schema 中提供了用于跟踪当前内存使用情况的详细信息,但 MySQL sys schema
在 sys 架构中,可以使用以下视图,按连接、组件和查询来跟踪内存使用情况。
| 视图 | 描述 |
|---|---|
|
按主机提供有关引擎内存使用情况的信息。这对于识别哪些应用程序服务器或客户端主机正在消耗内存很有用。 |
|
|
按线程 ID 提供有关引擎内存使用情况的信息。MySQL 中的线程 ID 可以是客户端连接或后台线程。您可以使用 sys.processlist |
|
|
按用户提供有关引擎内存使用情况的信息。这对于识别哪些用户账户或客户端正在消耗内存很有用。 |
|
|
按引擎组件提供有关引擎内存使用情况的信息。这对于按引擎缓冲区或组件全局识别内存使用情况很有用。例如,您可能会看到 InnoDB 缓冲池的 |
|
|
概述数据库引擎中跟踪的内存使用总量。 |
在 Aurora MySQL 版本 3.05 及更高版本中,您还可以在 Performance Schema statement summary tablesMAX_TOTAL_MEMORY 列可以帮助您确定自上次重置统计数据以来或自重启数据库实例以来,查询摘要所使用的最大内存。这对于识别可能消耗大量内存的特定查询很有用。
注意
Performance Schema 和 sys 架构显示服务器上的当前内存使用情况,以及每个连接和引擎组件消耗的内存的历史最高水平。由于 Performance Schema 在内存中维护,因此数据库实例重启时会重置信息。为了保持一段时间内的历史记录,建议您在 Performance Schema 之外配置此数据的检索和存储。
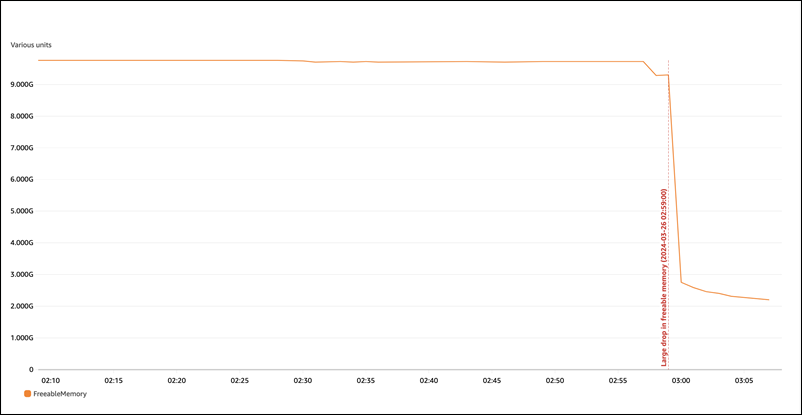
示例 1:持续的高内存使用量
在 CloudWatch 中全局观察 FreeableMemory,我们可以看到,在 2024 年 3 月 26 日凌晨 2:59(UTC 时间),内存使用量大幅增加。
这并不能告诉我们全貌。要确定哪个组件使用的内存最多,您可以登录数据库并查看 sys.memory_global_by_current_bytes。此表包含 MySQL 跟踪的内存事件列表,以及有关每个事件的内存分配的信息。每个内存跟踪事件都以 memory/% 开头,后跟与该事件关联的引擎组件/功能的其它信息。
例如,memory/performance_schema/% 用于与 Performance Schema 相关的内存事件,memory/innodb/% 用于 InnoDB,等等。有关事件命名约定的更多信息,请参阅 MySQL 文档中的 Performance Schema instrument naming conventions
从以下查询中,我们可以根据 current_alloc 找到可能的罪魁祸首,但我们也可能看到许多 memory/performance_schema/% 事件。
mysql> SELECT * FROM sys.memory_global_by_current_bytes LIMIT 10;

+-----------------------------------------------------------------------------+---------------+---------------+-------------------+------------+------------+----------------+
| event_name                                                                  | current_count | current_alloc | current_avg_alloc | high_count | high_alloc | high_avg_alloc |
+-----------------------------------------------------------------------------+---------------+---------------+-------------------+------------+------------+----------------+
| memory/sql/Prepared_statement::main_mem_root                                |        512817 | 4.91 GiB      | 10.04 KiB         |     512823 | 4.91 GiB   | 10.04 KiB      |
| memory/performance_schema/prepared_statements_instances                     |           252 | 488.25 MiB    | 1.94 MiB          |        252 | 488.25 MiB | 1.94 MiB       |
| memory/innodb/hash0hash                                                     |             4 | 79.07 MiB     | 19.77 MiB         |          4 | 79.07 MiB  | 19.77 MiB      |
| memory/performance_schema/events_errors_summary_by_thread_by_error          |          1028 | 52.27 MiB     | 52.06 KiB         |       1028 | 52.27 MiB  | 52.06 KiB      |
| memory/performance_schema/events_statements_summary_by_thread_by_event_name |             4 | 47.25 MiB     | 11.81 MiB         |          4 | 47.25 MiB  | 11.81 MiB      |
| memory/performance_schema/events_statements_summary_by_digest               |             1 | 40.28 MiB     | 40.28 MiB         |          1 | 40.28 MiB  | 40.28 MiB      |
| memory/performance_schema/memory_summary_by_thread_by_event_name            |             4 | 31.64 MiB     | 7.91 MiB          |          4 | 31.64 MiB  | 7.91 MiB       |
| memory/innodb/memory                                                        |         15227 | 27.44 MiB     | 1.85 KiB          |      20619 | 33.33 MiB  | 1.66 KiB       |
| memory/sql/String::value                                                    |         74411 | 21.85 MiB     |  307 bytes        |      76867 | 25.54 MiB  |  348 bytes     |
| memory/sql/TABLE                                                            |          8381 | 21.03 MiB     | 2.57 KiB          |       8381 | 21.03 MiB  | 2.57 KiB       |
+-----------------------------------------------------------------------------+---------------+---------------+-------------------+------------+------------+----------------+
10 rows in set (0.02 sec)
我们之前提到过, Performance Schema 存储在内存中,这意味着在 performance_schema 内存检测中也会对它进行跟踪。
注意
如果您发现 Performance Schema 使用了大量内存,并且想要限制其内存使用量,则可以根据需要调整数据库参数。有关更多信息,请参阅 MySQL 文档中的 The Performance Schema memory-allocation model
为了便于阅读,您可以重新运行相同的查询,但排除 Performance Schema 事件。输出显示以下内容:
-
主要的内存消耗者是
memory/sql/Prepared_statement::main_mem_root。 -
current_alloc列告诉我们,MySQL 当前为此事件分配了 4.91 GiB。 -
high_alloc column告诉我们,4.91 GiB 是自上次重置统计数据或服务器重启以来current_alloc的历史最高水平。这意味着memory/sql/Prepared_statement::main_mem_root已达到其最高值。
mysql> SELECT * FROM sys.memory_global_by_current_bytes WHERE event_name NOT LIKE 'memory/performance_schema/%' LIMIT 10;

+-----------------------------------------------+---------------+---------------+-------------------+------------+------------+----------------+
| event_name                                    | current_count | current_alloc | current_avg_alloc | high_count | high_alloc | high_avg_alloc |
+-----------------------------------------------+---------------+---------------+-------------------+------------+------------+----------------+
| memory/sql/Prepared_statement::main_mem_root  |        512817 | 4.91 GiB      | 10.04 KiB         |     512823 | 4.91 GiB   | 10.04 KiB      |
| memory/innodb/hash0hash                       |             4 | 79.07 MiB     | 19.77 MiB         |          4 | 79.07 MiB  | 19.77 MiB      |
| memory/innodb/memory                          |         17096 | 31.68 MiB     | 1.90 KiB          |      22498 | 37.60 MiB  | 1.71 KiB       |
| memory/sql/String::value                      |        122277 | 27.94 MiB     |  239 bytes        |     124699 | 29.47 MiB  |  247 bytes     |
| memory/sql/TABLE                              |          9927 | 24.67 MiB     | 2.55 KiB          |       9929 | 24.68 MiB  | 2.55 KiB       |
| memory/innodb/lock0lock                       |          8888 | 19.71 MiB     | 2.27 KiB          |       8888 | 19.71 MiB  | 2.27 KiB       |
| memory/sql/Prepared_statement::infrastructure |        257623 | 16.24 MiB     |   66 bytes        |     257631 | 16.24 MiB  |   66 bytes     |
| memory/mysys/KEY_CACHE                        |             3 | 16.00 MiB     | 5.33 MiB          |          3 | 16.00 MiB  | 5.33 MiB       |
| memory/innodb/sync0arr                        |             3 | 7.03 MiB      | 2.34 MiB          |          3 | 7.03 MiB   | 2.34 MiB       |
| memory/sql/THD::main_mem_root                 |           815 | 6.56 MiB      | 8.24 KiB          |        849 | 7.19 MiB   | 8.67 KiB       |
+-----------------------------------------------+---------------+---------------+-------------------+------------+------------+----------------+
10 rows in set (0.06 sec)
从事件的名称中,我们可以看出此内存正用于预处理语句。如果您想查看哪些连接正在使用此内存,您可以检查 memory_by_thread_by_current_bytes
在以下示例中,为每个连接分配了大约 7 MiB,历史最高水平约为 6.29 MiB (current_max_alloc)。这是有道理的,因为该示例正在将 sysbench 用于 80 个表和 800 个带有预处理语句的连接。如果您要在这种情况下减少内存使用量,可以优化应用程序对预处理语句的使用,来减少内存消耗。
mysql> SELECT * FROM sys.memory_by_thread_by_current_bytes;

+-----------+-------------------------------------------+--------------------+-------------------+-------------------+-------------------+-----------------+
| thread_id | user                                      | current_count_used | current_allocated | current_avg_alloc | current_max_alloc | total_allocated |
+-----------+-------------------------------------------+--------------------+-------------------+-------------------+-------------------+-----------------+
|        46 | rdsadmin@localhost                        |                405 | 8.47 MiB          | 21.42 KiB         | 8.00 MiB          | 155.86 MiB      |
|        61 | reinvent@10.0.4.4                         |               1749 | 6.72 MiB          | 3.93 KiB          | 6.29 MiB          | 14.24 MiB       |
|       101 | reinvent@10.0.4.4                         |               1845 | 6.71 MiB          | 3.72 KiB          | 6.29 MiB          | 14.50 MiB       |
|        55 | reinvent@10.0.4.4                         |               1674 | 6.68 MiB          | 4.09 KiB          | 6.29 MiB          | 14.13 MiB       |
|        57 | reinvent@10.0.4.4                         |               1416 | 6.66 MiB          | 4.82 KiB          | 6.29 MiB          | 13.52 MiB       |
|       112 | reinvent@10.0.4.4                         |               1759 | 6.66 MiB          | 3.88 KiB          | 6.29 MiB          | 14.17 MiB       |
|        66 | reinvent@10.0.4.4                         |               1428 | 6.64 MiB          | 4.76 KiB          | 6.29 MiB          | 13.47 MiB       |
|        75 | reinvent@10.0.4.4                         |               1389 | 6.62 MiB          | 4.88 KiB          | 6.29 MiB          | 13.40 MiB       |
|       116 | reinvent@10.0.4.4                         |               1333 | 6.61 MiB          | 5.08 KiB          | 6.29 MiB          | 13.21 MiB       |
|        90 | reinvent@10.0.4.4                         |               1448 | 6.59 MiB          | 4.66 KiB          | 6.29 MiB          | 13.58 MiB       |
|        98 | reinvent@10.0.4.4                         |               1440 | 6.57 MiB          | 4.67 KiB          | 6.29 MiB          | 13.52 MiB       |
|        94 | reinvent@10.0.4.4                         |               1433 | 6.57 MiB          | 4.69 KiB          | 6.29 MiB          | 13.49 MiB       |
|        62 | reinvent@10.0.4.4                         |               1323 | 6.55 MiB          | 5.07 KiB          | 6.29 MiB          | 13.48 MiB       |
|        87 | reinvent@10.0.4.4                         |               1323 | 6.55 MiB          | 5.07 KiB          | 6.29 MiB          | 13.25 MiB       |
|        99 | reinvent@10.0.4.4                         |               1346 | 6.54 MiB          | 4.98 KiB          | 6.29 MiB          | 13.24 MiB       |
|       105 | reinvent@10.0.4.4                         |               1347 | 6.54 MiB          | 4.97 KiB          | 6.29 MiB          | 13.34 MiB       |
|        73 | reinvent@10.0.4.4                         |               1335 | 6.54 MiB          | 5.02 KiB          | 6.29 MiB          | 13.23 MiB       |
|        54 | reinvent@10.0.4.4                         |               1510 | 6.53 MiB          | 4.43 KiB          | 6.29 MiB          | 13.49 MiB       |
.                                                                                                                                                          .
.                                                                                                                                                          .
.                                                                                                                                                          .
|       812 | reinvent@10.0.4.4                         |               1259 | 6.38 MiB          | 5.19 KiB          | 6.29 MiB          | 13.05 MiB       |
|       214 | reinvent@10.0.4.4                         |               1279 | 6.38 MiB          | 5.10 KiB          | 6.29 MiB          | 12.90 MiB       |
|       325 | reinvent@10.0.4.4                         |               1254 | 6.38 MiB          | 5.21 KiB          | 6.29 MiB          | 12.99 MiB       |
|       705 | reinvent@10.0.4.4                         |               1273 | 6.37 MiB          | 5.13 KiB          | 6.29 MiB          | 13.03 MiB       |
|       530 | reinvent@10.0.4.4                         |               1268 | 6.37 MiB          | 5.15 KiB          | 6.29 MiB          | 12.92 MiB       |
|       307 | reinvent@10.0.4.4                         |               1263 | 6.37 MiB          | 5.17 KiB          | 6.29 MiB          | 12.87 MiB       |
|       738 | reinvent@10.0.4.4                         |               1260 | 6.37 MiB          | 5.18 KiB          | 6.29 MiB          | 13.00 MiB       |
|       819 | reinvent@10.0.4.4                         |               1252 | 6.37 MiB          | 5.21 KiB          | 6.29 MiB          | 13.01 MiB       |
|        31 | innodb/srv_purge_thread                   |              17810 | 3.14 MiB          |  184 bytes        | 2.40 MiB          | 205.69 MiB      |
|        38 | rdsadmin@localhost                        |                599 | 1.76 MiB          | 3.01 KiB          | 1.00 MiB          | 25.58 MiB       |
|         1 | sql/main                                  |               3756 | 1.32 MiB          |  367 bytes        | 355.78 KiB        | 6.19 MiB        |
|       854 | rdsadmin@localhost                        |                 46 | 1.08 MiB          | 23.98 KiB         | 1.00 MiB          | 5.10 MiB        |
|        30 | innodb/clone_gtid_thread                  |               1596 | 573.14 KiB        |  367 bytes        | 254.91 KiB        | 970.69 KiB      |
|        40 | rdsadmin@localhost                        |                235 | 245.19 KiB        | 1.04 KiB          | 128.88 KiB        | 808.64 KiB      |
|       853 | rdsadmin@localhost                        |                 96 | 94.63 KiB         | 1009 bytes        | 29.73 KiB         | 422.45 KiB      |
|        36 | rdsadmin@localhost                        |                 33 | 36.29 KiB         | 1.10 KiB          | 16.08 KiB         | 74.15 MiB       |
|        33 | sql/event_scheduler                       |                  3 | 16.27 KiB         | 5.42 KiB          | 16.04 KiB         | 16.27 KiB       |
|        35 | sql/compress_gtid_table                   |                  8 | 14.20 KiB         | 1.77 KiB          | 8.05 KiB          | 18.62 KiB       |
|        25 | innodb/fts_optimize_thread                |                 12 | 1.86 KiB          |  158 bytes        |  648 bytes        | 1.98 KiB        |
|        23 | innodb/srv_master_thread                  |                 11 | 1.23 KiB          |  114 bytes        |  361 bytes        | 24.40 KiB       |
|        24 | innodb/dict_stats_thread                  |                 11 | 1.23 KiB          |  114 bytes        |  361 bytes        | 1.35 KiB        |
|         5 | innodb/io_read_thread                     |                  1 |  144 bytes        |  144 bytes        |  144 bytes        |  144 bytes      |
|         6 | innodb/io_read_thread                     |                  1 |  144 bytes        |  144 bytes        |  144 bytes        |  144 bytes      |
|         2 | sql/aws_oscar_log_level_monitor           |                  0 |    0 bytes        |    0 bytes        |    0 bytes        |    0 bytes      |
|         4 | innodb/io_ibuf_thread                     |                  0 |    0 bytes        |    0 bytes        |    0 bytes        |    0 bytes      |
|         7 | innodb/io_write_thread                    |                  0 |    0 bytes        |    0 bytes        |    0 bytes        |    0 bytes      |
|         8 | innodb/io_write_thread                    |                  0 |    0 bytes        |    0 bytes        |    0 bytes        |    0 bytes      |
|         9 | innodb/io_write_thread                    |                  0 |    0 bytes        |    0 bytes        |    0 bytes        |    0 bytes      |
|        10 | innodb/io_write_thread                    |                  0 |    0 bytes        |    0 bytes        |    0 bytes        |    0 bytes      |
|        11 | innodb/srv_lra_thread                     |                  0 |    0 bytes        |    0 bytes        |    0 bytes        |    0 bytes      |
|        12 | innodb/srv_akp_thread                     |                  0 |    0 bytes        |    0 bytes        |    0 bytes        |    0 bytes      |
|        18 | innodb/srv_lock_timeout_thread            |                  0 |    0 bytes        |    0 bytes        |    0 bytes        |  248 bytes      |
|        19 | innodb/srv_error_monitor_thread           |                  0 |    0 bytes        |    0 bytes        |    0 bytes        |    0 bytes      |
|        20 | innodb/srv_monitor_thread                 |                  0 |    0 bytes        |    0 bytes        |    0 bytes        |    0 bytes      |
|        21 | innodb/buf_resize_thread                  |                  0 |    0 bytes        |    0 bytes        |    0 bytes        |    0 bytes      |
|        22 | innodb/btr_search_sys_toggle_thread       |                  0 |    0 bytes        |    0 bytes        |    0 bytes        |    0 bytes      |
|        32 | innodb/dict_persist_metadata_table_thread |                  0 |    0 bytes        |    0 bytes        |    0 bytes        |    0 bytes      |
|        34 | sql/signal_handler                        |                  0 |    0 bytes        |    0 bytes        |    0 bytes        |    0 bytes      |
+-----------+-------------------------------------------+--------------------+-------------------+-------------------+-------------------+-----------------+
831 rows in set (2.48 sec)
如前所述,此处的线程 ID (thd_id) 值可以指服务器后台线程或数据库连接。如果要将线程 ID 值映射到数据库连接 ID,则可以使用 performance_schema.threads 表或 sys.processlist 视图,其中 conn_id 是连接 ID。
mysql> SELECT thd_id,conn_id,user,db,command,state,time,last_wait FROM sys.processlist WHERE user='reinvent@10.0.4.4';

+--------+---------+-------------------+----------+---------+----------------+------+-------------------------------------------------+
| thd_id | conn_id | user              | db       | command | state          | time | last_wait                                       |
+--------+---------+-------------------+----------+---------+----------------+------+-------------------------------------------------+
|    590 |     562 | reinvent@10.0.4.4 | sysbench | Execute | closing tables |    0 | wait/io/redo_log_flush                          |
|    578 |     550 | reinvent@10.0.4.4 | sysbench | Sleep   | NULL           |    0 | idle                                            |
|    579 |     551 | reinvent@10.0.4.4 | sysbench | Execute | closing tables |    0 | wait/io/redo_log_flush                          |
|    580 |     552 | reinvent@10.0.4.4 | sysbench | Execute | updating       |    0 | wait/io/table/sql/handler                       |
|    581 |     553 | reinvent@10.0.4.4 | sysbench | Execute | updating       |    0 | wait/io/table/sql/handler                       |
|    582 |     554 | reinvent@10.0.4.4 | sysbench | Sleep   | NULL           |    0 | idle                                            |
|    583 |     555 | reinvent@10.0.4.4 | sysbench | Sleep   | NULL           |    0 | idle                                            |
|    584 |     556 | reinvent@10.0.4.4 | sysbench | Execute | updating       |    0 | wait/io/table/sql/handler                       |
|    585 |     557 | reinvent@10.0.4.4 | sysbench | Execute | closing tables |    0 | wait/io/redo_log_flush                          |
|    586 |     558 | reinvent@10.0.4.4 | sysbench | Execute | updating       |    0 | wait/io/table/sql/handler                       |
|    587 |     559 | reinvent@10.0.4.4 | sysbench | Execute | closing tables |    0 | wait/io/redo_log_flush                          |
.                                                                                                                                     .
.                                                                                                                                     .
.                                                                                                                                     .
|    323 |     295 | reinvent@10.0.4.4 | sysbench | Sleep   | NULL           |    0 | idle                                            |
|    324 |     296 | reinvent@10.0.4.4 | sysbench | Execute | updating       |    0 | wait/io/table/sql/handler                       |
|    325 |     297 | reinvent@10.0.4.4 | sysbench | Execute | closing tables |    0 | wait/io/redo_log_flush                          |
|    326 |     298 | reinvent@10.0.4.4 | sysbench | Execute | updating       |    0 | wait/io/table/sql/handler                       |
|    438 |     410 | reinvent@10.0.4.4 | sysbench | Execute | System lock    |    0 | wait/lock/table/sql/handler                     |
|    280 |     252 | reinvent@10.0.4.4 | sysbench | Sleep   | starting       |    0 | wait/io/socket/sql/client_connection            |
|     98 |      70 | reinvent@10.0.4.4 | sysbench | Query   | freeing items  |    0 | NULL                                            |
+--------+---------+-------------------+----------+---------+----------------+------+-------------------------------------------------+
804 rows in set (5.51 sec)
现在我们停止 sysbench 工作负载,这会关闭连接并释放内存。再次检查事件,我们可以确认内存已释放,但 high_alloc 仍然可以告诉我们历史最高水平是多少。high_alloc 列在识别内存使用量的短暂峰值时可能非常有用,在这种情况下,您可能无法根据 current_alloc 立即识别使用量,它仅显示当前分配的内存。
mysql> SELECT * FROM sys.memory_global_by_current_bytes WHERE event_name='memory/sql/Prepared_statement::main_mem_root' LIMIT 10;

+----------------------------------------------+---------------+---------------+-------------------+------------+------------+----------------+
| event_name                                   | current_count | current_alloc | current_avg_alloc | high_count | high_alloc | high_avg_alloc |
+----------------------------------------------+---------------+---------------+-------------------+------------+------------+----------------+
| memory/sql/Prepared_statement::main_mem_root |            17 | 253.80 KiB    | 14.93 KiB         |     512823 | 4.91 GiB   | 10.04 KiB      |
+----------------------------------------------+---------------+---------------+-------------------+------------+------------+----------------+
1 row in set (0.00 sec)
如果要重置 high_alloc,可以截断 performance_schema 内存摘要表,但这会重置所有内存检测。有关更多信息,请参阅 MySQL 文档中的 Performance Schema general table characteristics
在下面的示例中,我们可以看到截断后重置 high_alloc。
mysql> TRUNCATE `performance_schema`.`memory_summary_global_by_event_name`;
Query OK, 0 rows affected (0.00 sec)

mysql> SELECT * FROM sys.memory_global_by_current_bytes WHERE event_name='memory/sql/Prepared_statement::main_mem_root' LIMIT 10;

+----------------------------------------------+---------------+---------------+-------------------+------------+------------+----------------+
| event_name                                   | current_count | current_alloc | current_avg_alloc | high_count | high_alloc | high_avg_alloc |
+----------------------------------------------+---------------+---------------+-------------------+------------+------------+----------------+
| memory/sql/Prepared_statement::main_mem_root |            17 | 253.80 KiB    | 14.93 KiB         |         17 | 253.80 KiB | 14.93 KiB      |
+----------------------------------------------+---------------+---------------+-------------------+------------+------------+----------------+
1 row in set (0.00 sec)
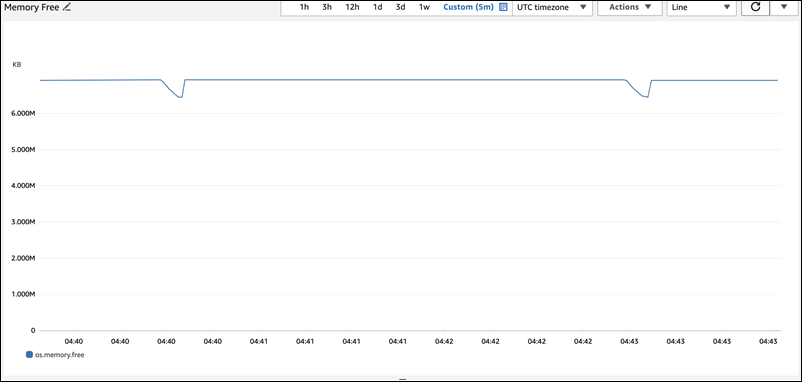
示例 2:短暂内存峰值
另一种常见的情况是数据库服务器上的内存使用量出现短暂的峰值。这些可能是可释放内存的周期性下降,使用 sys.memory_global_by_current_bytes 中的 current_alloc 很难排除故障,因为内存已经被释放。
注意
如果 Performance Schema 统计数据已重置,或者数据库实例已重启,则这些信息将无法在 sys 或 performance_schema 中找到。为保留该信息,建议您配置外部指标收集。
下图展示了增强监控中的 os.memory.free 指标,其中显示了内存使用量短暂的 7 秒峰值。增强监控让您能够以短至 1 秒的间隔进行监控,这非常适合捕捉此类短暂峰值。
为协助诊断此处内存使用量的原因,我们可以结合使用 sys 内存摘要视图中的 high_alloc 和 Performance Schema statement summary tables
正如预期的那样,由于目前内存使用量不高,因此我们在 sys 架构视图的 current_alloc 下看不到任何严重问题。
mysql> SELECT * FROM sys.memory_global_by_current_bytes LIMIT 10;

+-----------------------------------------------------------------------------+---------------+---------------+-------------------+------------+------------+----------------+
| event_name                                                                  | current_count | current_alloc | current_avg_alloc | high_count | high_alloc | high_avg_alloc |
+-----------------------------------------------------------------------------+---------------+---------------+-------------------+------------+------------+----------------+
| memory/innodb/hash0hash                                                     |             4 | 79.07 MiB     | 19.77 MiB         |          4 | 79.07 MiB  | 19.77 MiB      |
| memory/innodb/os0event                                                      |        439372 | 60.34 MiB     |  144 bytes        |     439372 | 60.34 MiB  |  144 bytes     |
| memory/performance_schema/events_statements_summary_by_digest               |             1 | 40.28 MiB     | 40.28 MiB         |          1 | 40.28 MiB  | 40.28 MiB      |
| memory/mysys/KEY_CACHE                                                      |             3 | 16.00 MiB     | 5.33 MiB          |          3 | 16.00 MiB  | 5.33 MiB       |
| memory/performance_schema/events_statements_history_long                    |             1 | 14.34 MiB     | 14.34 MiB         |          1 | 14.34 MiB  | 14.34 MiB      |
| memory/performance_schema/events_errors_summary_by_thread_by_error          |           257 | 13.07 MiB     | 52.06 KiB         |        257 | 13.07 MiB  | 52.06 KiB      |
| memory/performance_schema/events_statements_summary_by_thread_by_event_name |             1 | 11.81 MiB     | 11.81 MiB         |          1 | 11.81 MiB  | 11.81 MiB      |
| memory/performance_schema/events_statements_summary_by_digest.digest_text   |             1 | 9.77 MiB      | 9.77 MiB          |          1 | 9.77 MiB   | 9.77 MiB       |
| memory/performance_schema/events_statements_history_long.digest_text        |             1 | 9.77 MiB      | 9.77 MiB          |          1 | 9.77 MiB   | 9.77 MiB       |
| memory/performance_schema/events_statements_history_long.sql_text           |             1 | 9.77 MiB      | 9.77 MiB          |          1 | 9.77 MiB   | 9.77 MiB       |
+-----------------------------------------------------------------------------+---------------+---------------+-------------------+------------+------------+----------------+
10 rows in set (0.01 sec)
将视图扩展为按 high_alloc 排序,我们现在可以看到,此处 memory/temptable/physical_ram 组件是一个非常好的候选组件。最高时,它消耗了 515.00 MiB。
顾名思义,memory/temptable/physical_ram 在 MySQL 中检测 TEMP 存储引擎的内存使用量(在 MySQL 8.0 中引入)。有关 MySQL 如何使用临时表的更多信息,请参阅 MySQL 文档中的 Internal temporary table use in MySQL
注意
我们在该示例中使用 sys.x$memory_global_by_current_bytes 视图。
mysql> SELECT event_name, format_bytes(current_alloc) AS "currently allocated", sys.format_bytes(high_alloc) AS "high-water mark"
FROM sys.x$memory_global_by_current_bytes ORDER BY high_alloc DESC LIMIT 10;

+-----------------------------------------------------------------------------+---------------------+-----------------+
| event_name                                                                  | currently allocated | high-water mark |
+-----------------------------------------------------------------------------+---------------------+-----------------+
| memory/temptable/physical_ram                                               | 4.00 MiB            | 515.00 MiB      |
| memory/innodb/hash0hash                                                     | 79.07 MiB           | 79.07 MiB       |
| memory/innodb/os0event                                                      | 63.95 MiB           | 63.95 MiB       |
| memory/performance_schema/events_statements_summary_by_digest               | 40.28 MiB           | 40.28 MiB       |
| memory/mysys/KEY_CACHE                                                      | 16.00 MiB           | 16.00 MiB       |
| memory/performance_schema/events_statements_history_long                    | 14.34 MiB           | 14.34 MiB       |
| memory/performance_schema/events_errors_summary_by_thread_by_error          | 13.07 MiB           | 13.07 MiB       |
| memory/performance_schema/events_statements_summary_by_thread_by_event_name | 11.81 MiB           | 11.81 MiB       |
| memory/performance_schema/events_statements_summary_by_digest.digest_text   | 9.77 MiB            | 9.77 MiB        |
| memory/performance_schema/events_statements_history_long.sql_text           | 9.77 MiB            | 9.77 MiB        |
+-----------------------------------------------------------------------------+---------------------+-----------------+
10 rows in set (0.00 sec)
在示例 1:持续的高内存使用量中,我们检查了每个连接的当前内存使用量,来确定哪个连接负责使用相关内存。在此示例中,内存已被释放,因此检查当前连接的内存使用量并无用处。
为了更深入地挖掘并找到有问题的语句、用户和主机,我们使用 Performance Schema。Performance Schema 包含多个语句摘要表,这些摘要表按事件名称、语句摘要、主机、线程和用户等不同维度进行切片。每个视图都让您能够更深入地了解某些语句的运行位置以及它们的作用是什么。本节重点介绍 MAX_TOTAL_MEMORY,但您可以在 Performance Schema statement summary tables
mysql> SHOW TABLES IN performance_schema LIKE 'events_statements_summary_%';

+------------------------------------------------------------+
| Tables_in_performance_schema (events_statements_summary_%) |
+------------------------------------------------------------+
| events_statements_summary_by_account_by_event_name         |
| events_statements_summary_by_digest                        |
| events_statements_summary_by_host_by_event_name            |
| events_statements_summary_by_program                       |
| events_statements_summary_by_thread_by_event_name          |
| events_statements_summary_by_user_by_event_name            |
| events_statements_summary_global_by_event_name             |
+------------------------------------------------------------+
7 rows in set (0.00 sec)
首先,我们检查 events_statements_summary_by_digest 来查看 MAX_TOTAL_MEMORY。
从这里,我们可以看到以下内容:
-
带有摘要
20676ce4a690592ff05debcffcbc26faeb76f22005e7628364d7a498769d0c4a的查询似乎是这种内存使用量的一个很好的候选查询。MAX_TOTAL_MEMORY为 537450710,与我们在sys.x$memory_global_by_current_bytes中看到的memory/temptable/physical_ram事件的历史最高水平相符。 -
它已经运行了四次 (
COUNT_STAR),第一次是在 2024-03-26 04:08:34.943256,最后一次是在 2024-03-26 04:43:06.998310。
mysql> SELECT SCHEMA_NAME,DIGEST,COUNT_STAR,MAX_TOTAL_MEMORY,FIRST_SEEN,LAST_SEEN
FROM performance_schema.events_statements_summary_by_digest ORDER BY MAX_TOTAL_MEMORY DESC LIMIT 5;

+-------------+------------------------------------------------------------------+------------+------------------+----------------------------+----------------------------+
| SCHEMA_NAME | DIGEST                                                           | COUNT_STAR | MAX_TOTAL_MEMORY | FIRST_SEEN                 | LAST_SEEN                  |
+-------------+------------------------------------------------------------------+------------+------------------+----------------------------+----------------------------+
| sysbench    | 20676ce4a690592ff05debcffcbc26faeb76f22005e7628364d7a498769d0c4a |          4 |        537450710 | 2024-03-26 04:08:34.943256 | 2024-03-26 04:43:06.998310 |
| NULL        | f158282ea0313fefd0a4778f6e9b92fc7d1e839af59ebd8c5eea35e12732c45d |          4 |          3636413 | 2024-03-26 04:29:32.712348 | 2024-03-26 04:36:26.269329 |
| NULL        | 0046bc5f642c586b8a9afd6ce1ab70612dc5b1fd2408fa8677f370c1b0ca3213 |          2 |          3459965 | 2024-03-26 04:31:37.674008 | 2024-03-26 04:32:09.410718 |
| NULL        | 8924f01bba3c55324701716c7b50071a60b9ceaf17108c71fd064c20c4ab14db |          1 |          3290981 | 2024-03-26 04:31:49.751506 | 2024-03-26 04:31:49.751506 |
| NULL        | 90142bbcb50a744fcec03a1aa336b2169761597ea06d85c7f6ab03b5a4e1d841 |          1 |          3131729 | 2024-03-26 04:15:09.719557 | 2024-03-26 04:15:09.719557 |
+-------------+------------------------------------------------------------------+------------+------------------+----------------------------+----------------------------+
5 rows in set (0.00 sec)
现在我们知道了有问题的摘要,我们可以获得更多详细信息,例如查询文本、运行它的用户以及运行它的位置。根据返回的摘要文本,我们可以看到这是一个公用表表达式(CTE),它创建了四个临时表并执行了四次表扫描,效率非常低。
mysql> SELECT SCHEMA_NAME,DIGEST_TEXT,QUERY_SAMPLE_TEXT,MAX_TOTAL_MEMORY,SUM_ROWS_SENT,SUM_ROWS_EXAMINED,SUM_CREATED_TMP_TABLES,SUM_NO_INDEX_USED
FROM performance_schema.events_statements_summary_by_digest
WHERE DIGEST='20676ce4a690592ff05debcffcbc26faeb76f22005e7628364d7a498769d0c4a'\G;

*************************** 1. row ***************************
           SCHEMA_NAME: sysbench
           DIGEST_TEXT: WITH RECURSIVE `cte` ( `n` ) AS ( SELECT ? FROM `sbtest1` UNION ALL SELECT `id` + ? FROM `sbtest1` ) SELECT * FROM `cte`
     QUERY_SAMPLE_TEXT: WITH RECURSIVE cte (n) AS (   SELECT 1  from sbtest1 UNION ALL   SELECT id + 1 FROM sbtest1) SELECT * FROM cte
      MAX_TOTAL_MEMORY: 537450710
         SUM_ROWS_SENT: 80000000
     SUM_ROWS_EXAMINED: 80000000
SUM_CREATED_TMP_TABLES: 4
     SUM_NO_INDEX_USED: 4
1 row in set (0.01 sec)
有关 events_statements_summary_by_digest 表和其它 Performance Schema 语句摘要表的更多信息,请参阅 MySQL 文档中的 Statement summary tables
您也可以运行 EXPLAIN
注意
EXPLAIN ANALYZE 可以比 EXPLAIN 提供更多的信息,但它也会运行查询,所以要小心。
-- EXPLAIN
mysql> EXPLAIN WITH RECURSIVE cte (n) AS (SELECT 1  FROM sbtest1 UNION ALL SELECT id + 1 FROM sbtest1) SELECT * FROM cte;

+----+-------------+------------+------------+-------+---------------+------+---------+------+----------+----------+-------------+
| id | select_type | table      | partitions | type  | possible_keys | key  | key_len | ref  | rows     | filtered | Extra       |
+----+-------------+------------+------------+-------+---------------+------+---------+------+----------+----------+-------------+
|  1 | PRIMARY     | <derived2> | NULL       | ALL   | NULL          | NULL | NULL    | NULL | 19221520 |   100.00 | NULL        |
|  2 | DERIVED     | sbtest1    | NULL       | index | NULL          | k_1  | 4       | NULL |  9610760 |   100.00 | Using index |
|  3 | UNION       | sbtest1    | NULL       | index | NULL          | k_1  | 4       | NULL |  9610760 |   100.00 | Using index |
+----+-------------+------------+------------+-------+---------------+------+---------+------+----------+----------+-------------+
3 rows in set, 1 warning (0.00 sec)

-- EXPLAIN format=tree
mysql> EXPLAIN format=tree WITH RECURSIVE cte (n) AS (SELECT 1 FROM sbtest1 UNION ALL SELECT id + 1 FROM sbtest1) SELECT * FROM cte\G;

*************************** 1. row ***************************
EXPLAIN: -> Table scan on cte  (cost=4.11e+6..4.35e+6 rows=19.2e+6)
    -> Materialize union CTE cte  (cost=4.11e+6..4.11e+6 rows=19.2e+6)
        -> Index scan on sbtest1 using k_1  (cost=1.09e+6 rows=9.61e+6)
        -> Index scan on sbtest1 using k_1  (cost=1.09e+6 rows=9.61e+6)
1 row in set (0.00 sec)

-- EXPLAIN ANALYZE
mysql> EXPLAIN ANALYZE WITH RECURSIVE cte (n) AS (SELECT 1 from sbtest1 UNION ALL SELECT id + 1 FROM sbtest1) SELECT * FROM cte\G;

*************************** 1. row ***************************
EXPLAIN: -> Table scan on cte  (cost=4.11e+6..4.35e+6 rows=19.2e+6) (actual time=6666..9201 rows=20e+6 loops=1)
    -> Materialize union CTE cte  (cost=4.11e+6..4.11e+6 rows=19.2e+6) (actual time=6666..6666 rows=20e+6 loops=1)
        -> Covering index scan on sbtest1 using k_1  (cost=1.09e+6 rows=9.61e+6) (actual time=0.0365..2006 rows=10e+6 loops=1)
        -> Covering index scan on sbtest1 using k_1  (cost=1.09e+6 rows=9.61e+6) (actual time=0.0311..2494 rows=10e+6 loops=1)
1 row in set (10.53 sec)
但谁运行它呢? 我们可以在 Performance Schema 中看到,destructive_operator 用户拥有 MAX_TOTAL_MEMORY 537450710,这再次与之前的结果相符。
注意
Performance Schema 存储在内存中,因此不应将其作为审计的唯一来源。如果您需要维护语句运行的历史记录以及语句是由哪些用户运行的,我们建议启用 Aurora 高级审计。如果您还需要维护有关内存使用量的信息,建议您将监控配置为导出和存储这些值。
mysql> SELECT USER,EVENT_NAME,COUNT_STAR,MAX_TOTAL_MEMORY FROM performance_schema.events_statements_summary_by_user_by_event_name
ORDER BY MAX_CONTROLLED_MEMORY DESC LIMIT 5;

+----------------------+---------------------------+------------+------------------+
| USER                 | EVENT_NAME                | COUNT_STAR | MAX_TOTAL_MEMORY |
+----------------------+---------------------------+------------+------------------+
| destructive_operator | statement/sql/select      |          4 |        537450710 |
| rdsadmin             | statement/sql/select      |       4172 |          3290981 |
| rdsadmin             | statement/sql/show_tables |          2 |          3615821 |
| rdsadmin             | statement/sql/show_fields |          2 |          3459965 |
| rdsadmin             | statement/sql/show_status |         75 |          1914976 |
+----------------------+---------------------------+------------+------------------+
5 rows in set (0.00 sec)

mysql> SELECT HOST,EVENT_NAME,COUNT_STAR,MAX_TOTAL_MEMORY FROM performance_schema.events_statements_summary_by_host_by_event_name
WHERE HOST != 'localhost' AND COUNT_STAR>0 ORDER BY MAX_CONTROLLED_MEMORY DESC LIMIT 5;

+------------+----------------------+------------+------------------+
| HOST       | EVENT_NAME           | COUNT_STAR | MAX_TOTAL_MEMORY |
+------------+----------------------+------------+------------------+
| 10.0.8.231 | statement/sql/select |          4 |        537450710 |
+------------+----------------------+------------+------------------+
1 row in set (0.00 sec)
示例 3:可释放内存持续下降且无法回收
InnoDB 数据库引擎为不同的组件使用了一系列专门的内存跟踪事件。这些特定事件允许精细跟踪 InnoDB 关键子系统的内存使用情况,例如:
-
memory/innodb/buf0buf– 专门用于监控 InnoDB 缓冲池的内存分配。 -
memory/innodb/ibuf0ibuf– 专门跟踪与 InnoDB 更改缓冲区相关的内存变化。
为了确定内存的最大使用者,我们可以查询 sys.memory_global_by_current_bytes:
mysql> SELECT event_name,current_alloc FROM sys.memory_global_by_current_bytes LIMIT 10;

+-----------------------------------------------------------------+---------------+
| event_name                                                      | current_alloc |
+-----------------------------------------------------------------+---------------+
| memory/innodb/memory                                            | 5.28 GiB      |
| memory/performance_schema/table_io_waits_summary_by_index_usage | 495.00 MiB    |
| memory/performance_schema/table_shares                          | 488.00 MiB    |
| memory/sql/TABLE_SHARE::mem_root                                | 388.95 MiB    |
| memory/innodb/std                                               | 226.88 MiB    |
| memory/innodb/fil0fil                                           | 198.49 MiB    |
| memory/sql/binlog_io_cache                                      | 128.00 MiB    |
| memory/innodb/mem0mem                                           | 96.82 MiB     |
| memory/innodb/dict0dict                                         | 96.76 MiB     |
| memory/performance_schema/rwlock_instances                      | 88.00 MiB     |
+-----------------------------------------------------------------+---------------+
10 rows in set (0.00 sec)
结果表明,memory/innodb/memory 是最大使用者,使用了 5.28 GiB 当前分配的内存。此事件用作与更具体的等待事件(如前所述的 memory/innodb/buf0buf)无关的各种 InnoDB 组件的内存分配类别。
在确定了 InnoDB 组件是内存的主要使用者之后,我们就可以使用以下 MySQL 命令更深入地研究具体细节:
SHOW ENGINE INNODB STATUS \G;
SHOW ENGINE INNODB STATUS
分析 InnoDB 状态报告的 BUFFER POOL AND MEMORY 部分后,我们可以看到,5,051,647,748 字节(4.7 GiB)分配给了字典对象缓存memory/innodb/memory 所跟踪内存的 89%。
---------------------- BUFFER POOL AND MEMORY ---------------------- Total large memory allocated 0Dictionary memory allocated 5051647748Buffer pool size 170512 Free buffers 142568 Database pages 27944 Old database pages 10354 Modified db pages 6 Pending reads 0
字典对象缓存是一种共享全局缓存,它将以前访问过的数据字典对象存储在内存中,以实现对象的重复使用并提高性能。对字典对象缓存的高内存分配表明数据字典缓存中有大量数据库对象。
既然知道了数据字典缓存是主要使用者,我们接下来检查数据字典缓存中是否有打开的表。要查找表定义缓存中的表数量,请查询全局状态变量 open_table_definitions
mysql> show global status like 'open_table_definitions';

+------------------------+-------+
| Variable_name          | Value |
+------------------------+-------+
| Open_table_definitions | 20000 |
+------------------------+-------+
1 row in set (0.00 sec)
有关更多信息,请参阅 MySQL 文档中的 MySQL 如何打开和关闭表
您可以通过限制数据库集群或数据库实例参数组中的 table_definition_cache 参数,来限制数据字典缓存中表定义的数量。对于 Aurora MySQL,此值用作表定义缓存中表数量的软限制。默认值取决于实例类并设置为以下值:
LEAST({DBInstanceClassMemory/393040}, 20000)
当表的数量超过 table_definition_cache 限制时,最近最少使用(LRU)机制会将表从缓存中移出并删除。但是,涉及外键关系的表不会放在 LRU 列表中,以防止其被删除。
在我们当前的场景中,我们运行 FLUSH TABLES
mysql> show global status like 'open_table_definitions';

+------------------------+-------+
| Variable_name          | Value |
+------------------------+-------+
| Open_table_definitions | 12    |
+------------------------+-------+
1 row in set (0.00 sec)
尽管有如此的减少,但我们观察到 memory/innodb/memory 的内存分配依然很高,为 5.18 GiB,且分配的字典内存也未变。从以下查询结果中可以明显看出这一点:
mysql> SELECT event_name,current_alloc FROM sys.memory_global_by_current_bytes LIMIT 10;

+-----------------------------------------------------------------+---------------+
| event_name                                                      | current_alloc |
+-----------------------------------------------------------------+---------------+
| memory/innodb/memory                                            | 5.18 GiB      |
| memory/performance_schema/table_io_waits_summary_by_index_usage | 495.00 MiB    |
| memory/performance_schema/table_shares                          | 488.00 MiB    |
| memory/sql/TABLE_SHARE::mem_root                                | 388.95 MiB    |
| memory/innodb/std                                               | 226.88 MiB    |
| memory/innodb/fil0fil                                           | 198.49 MiB    |
| memory/sql/binlog_io_cache                                      | 128.00 MiB    |
| memory/innodb/mem0mem                                           | 96.82 MiB     |
| memory/innodb/dict0dict                                         | 96.76 MiB     |
| memory/performance_schema/rwlock_instances                      | 88.00 MiB     |
+-----------------------------------------------------------------+---------------+
10 rows in set (0.00 sec)
---------------------- BUFFER POOL AND MEMORY ---------------------- Total large memory allocated 0Dictionary memory allocated 5001599639Buffer pool size 170512 Free buffers 142568 Database pages 27944 Old database pages 10354 Modified db pages 6 Pending reads 0
这种持续的高内存使用量可以归因于涉及外键关系的表。这些表没有放在 LRU 列表中,无法删除,这就解释了为什么即使在刷新了表定义缓存之后,内存分配依然很高。
解决此问题:
-
查看和优化您的数据库架构,尤其是外键关系。
-
可以考虑改用具有更大内存的更大的数据库实例类来容纳您的字典对象。
通过执行这些步骤并了解内存分配模式,您可以更好地管理 Aurora MySQL 数据库实例中的内存使用情况,并防止由于内存压力而导致的潜在性能问题。