Searching and analyzing spans
Transaction Search provides you with a visual editor to search and analyze all ingested spans using attributes. You can use the visual editor to narrow down transaction spans and create interactive visualizations to troubleshoot issues in your distributed applications. You can also use the CloudWatch Logs Insights query language to analyze your spans. This topic describes how to access and use the visual editor.
The visual editor
The following procedure describes how to access the visual editor.
To access the visual editor
-
Open the CloudWatch console at https://console.amazonaws.cn/cloudwatch/
. -
From the navigation pane, choose Application Signals, and then choose Transaction Search.
Use span attributes, such as service name, span duration, and span status to narrow down transaction spans quickly. You can access these filters and more on the right side of the visual editor under Select filters.
This visual editor suggests a list of attributes in the span. These attributes include attributes added through auto-instrumentation and custom attributes added through custom instrumentation.
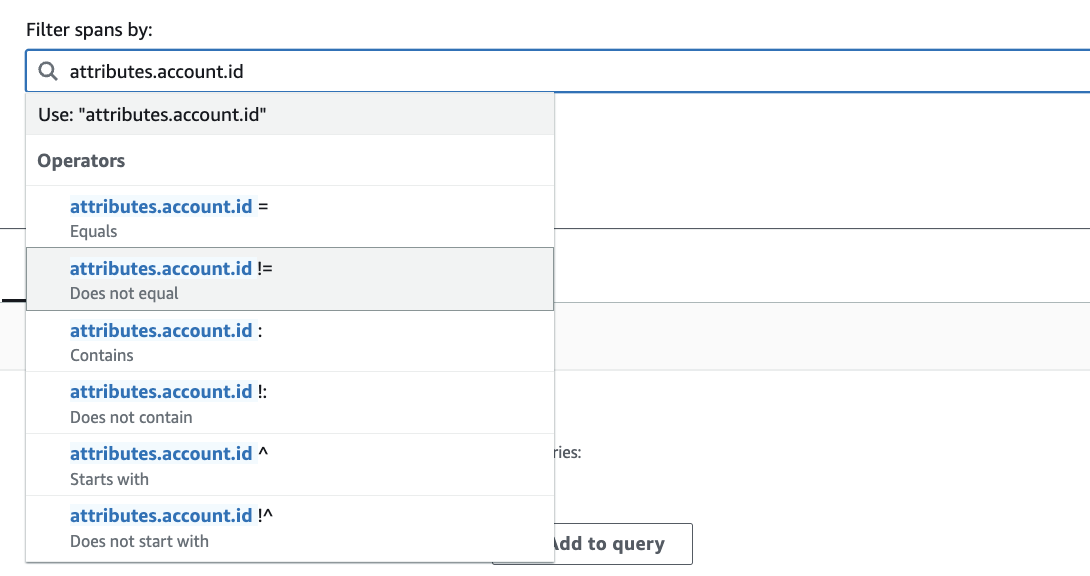
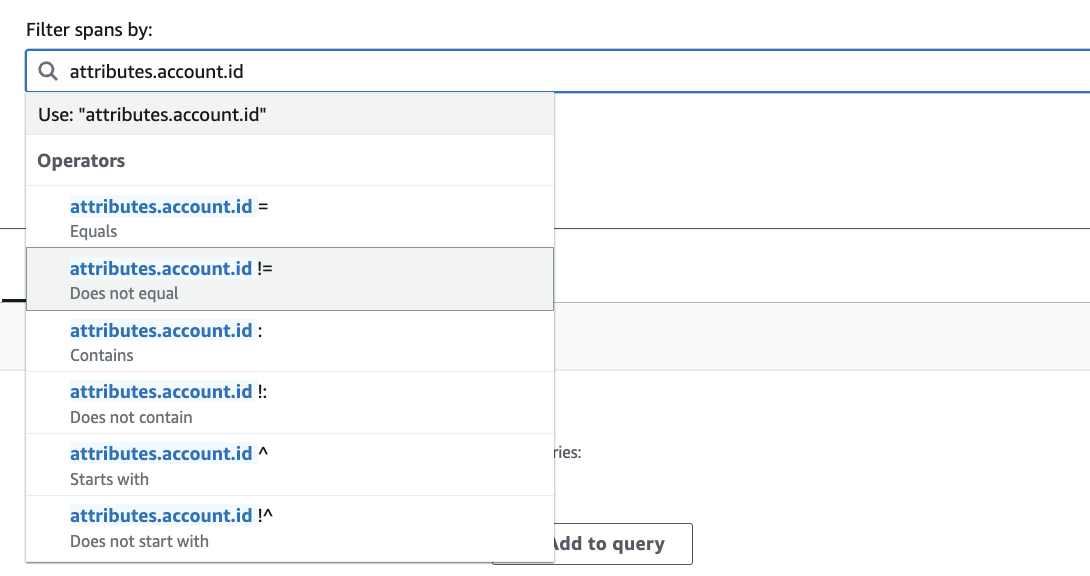
Select a span key, and enter a value to refine span results. You can filter spans using various operations, such as "Equals," "Does Not Equal," and more.
Query formats
You can run queries in the visual editor using different formats. This section describes each of these formats.
List
View spans or span events in a list format, which displays information about each span. Use this type of analysis to analyze individual spans, understand specific transactions, or identify unique patterns in transaction events. Other use cases include the following:
Use cases
-
Troubleshoot customer support tickets
-
Locate APIs or dependencies, such as database queries taking longer than 1000 milliseconds to execute
-
Locate spans with errors
The following screenshots show how to troubleshoot a customer support ticket with this type of analysis.
Example scenario
In the visual editor, filter on all transaction spans with a particular customer issue. Before you run your query, choose List from the Visualize as dropdown.
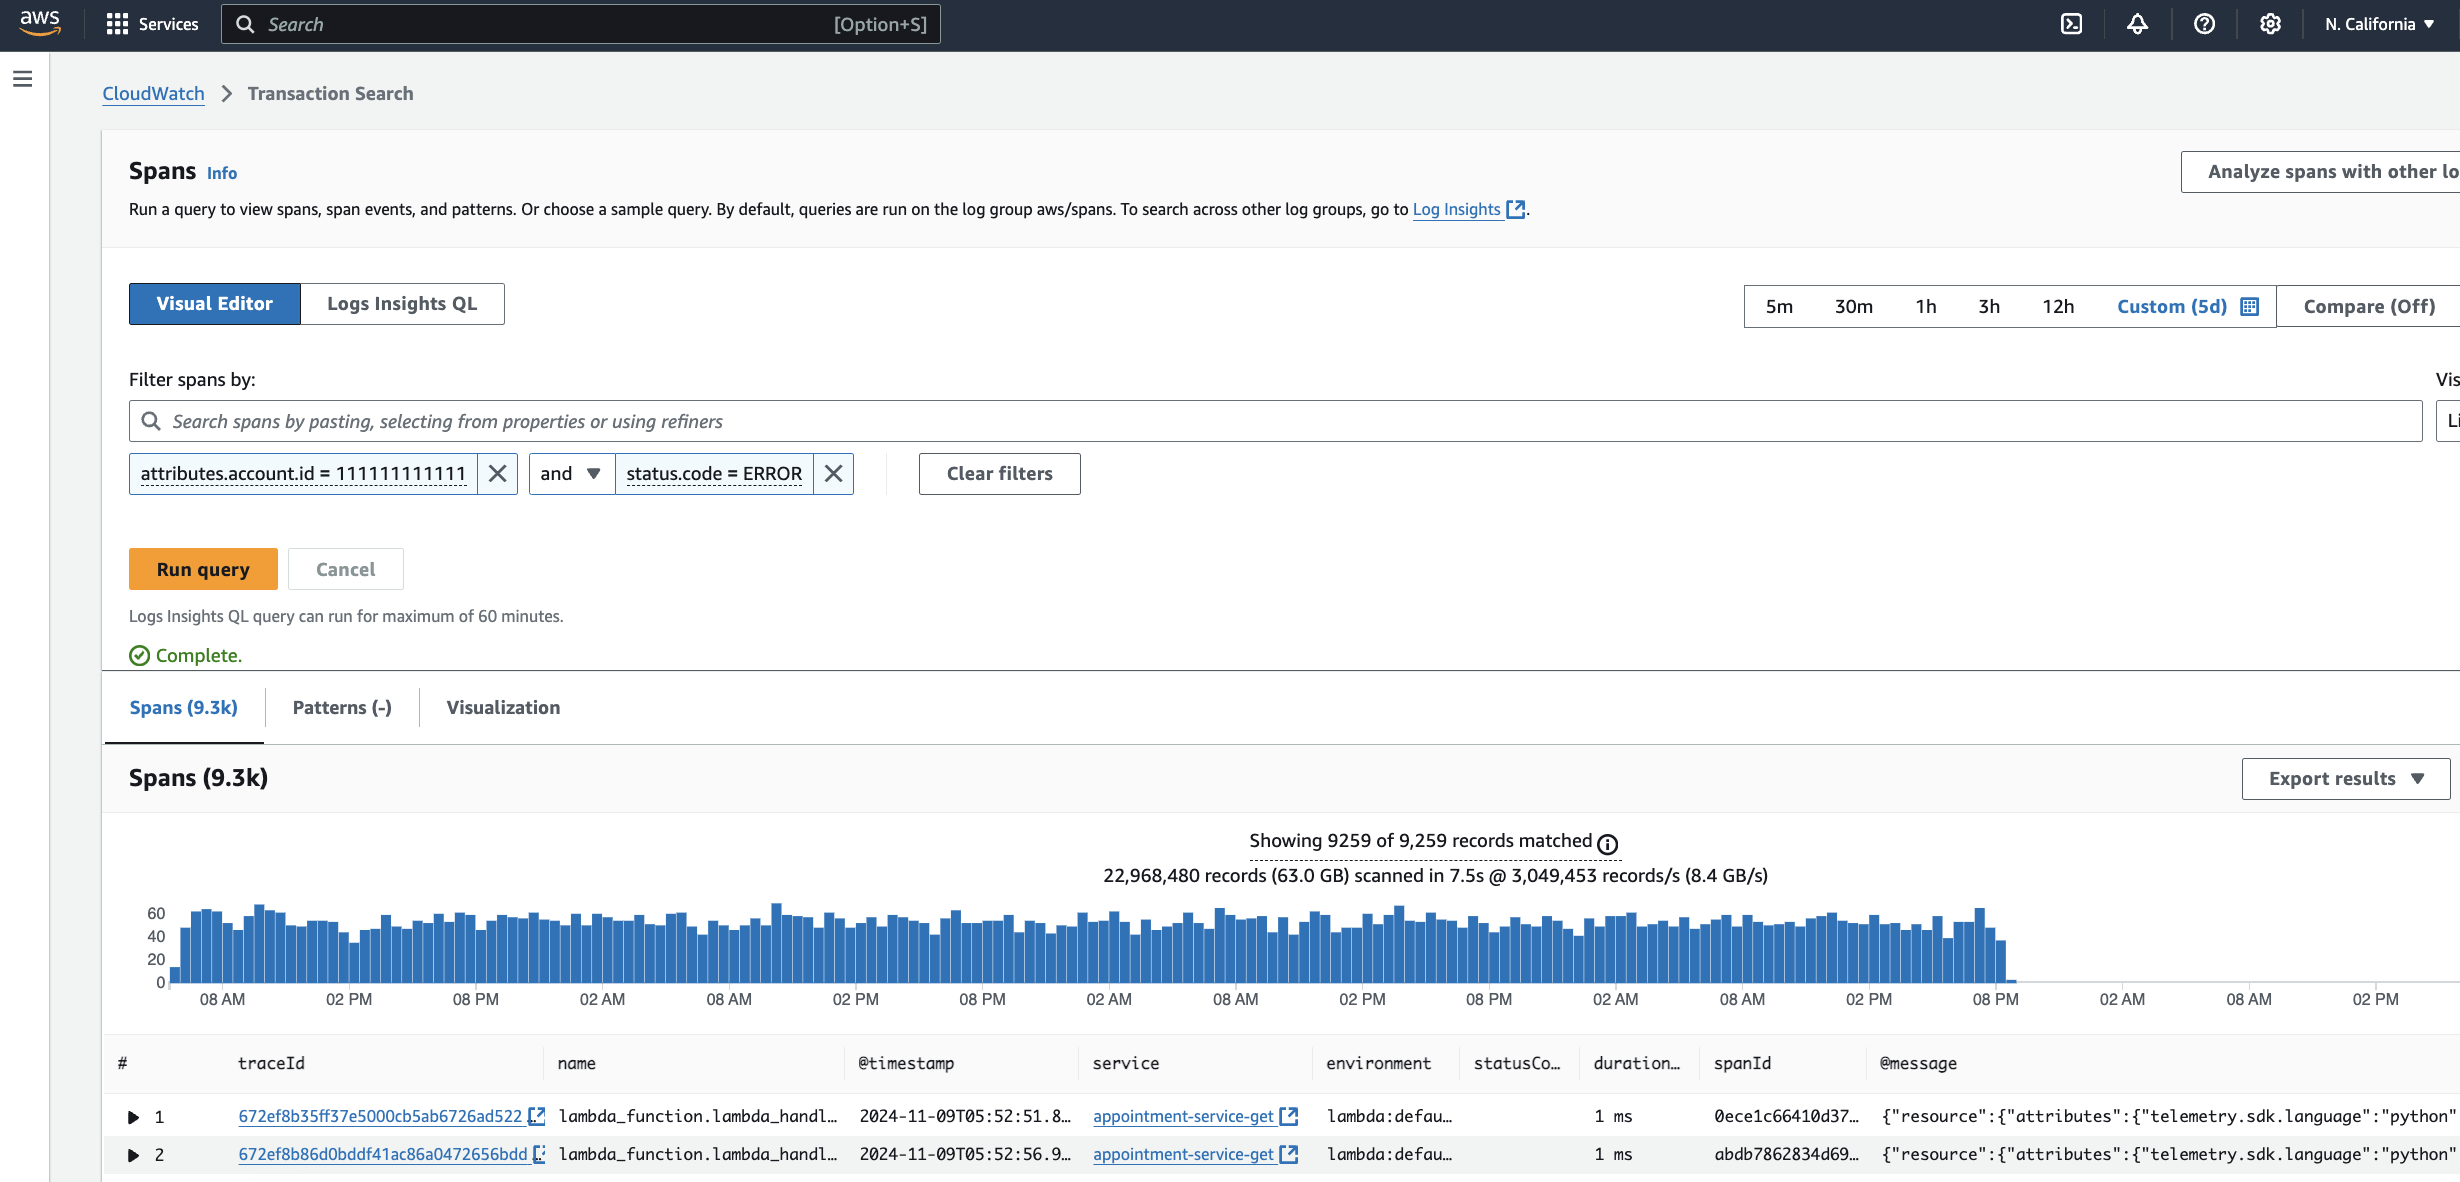
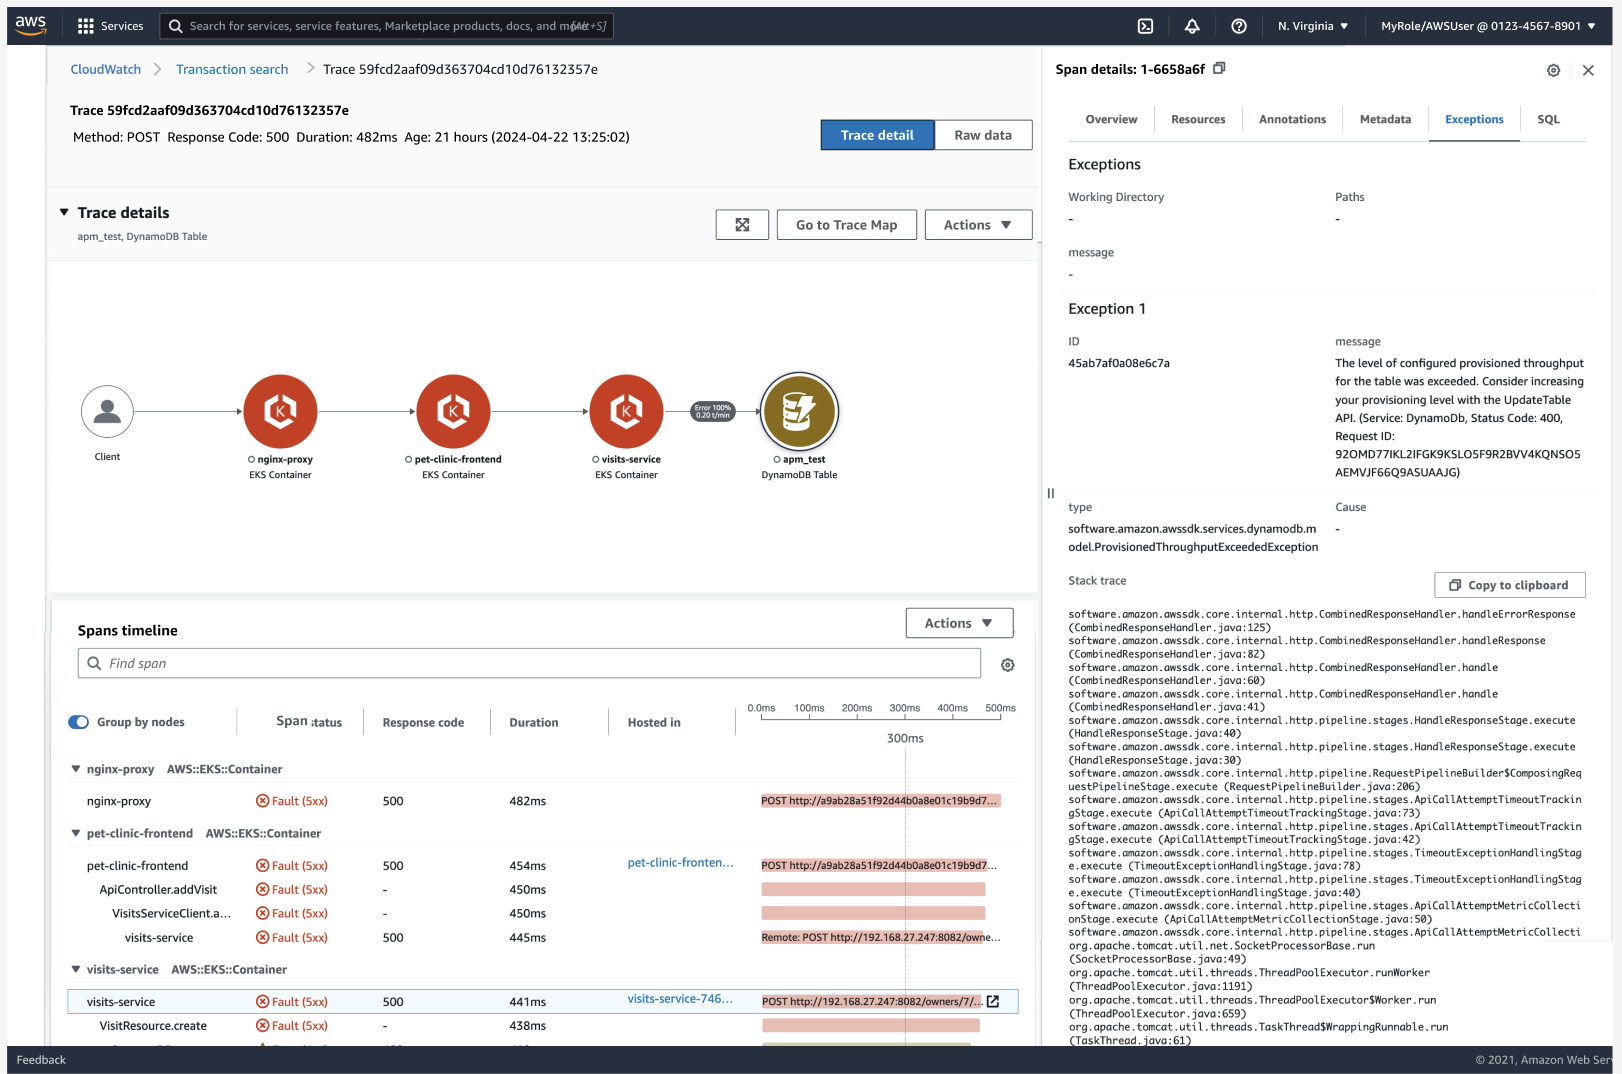
The results show a list of spans where you can choose a trace ID to get the end-to-end journey for the transaction and determine the root cause of the issue.
Timeseries
View spans or span events over time. Use this type of analysis to look at trends and spikes in transaction activity. Other use cases include the following:
-
Visualize latency
-
Visualize frequency of spans
-
Visualize performance
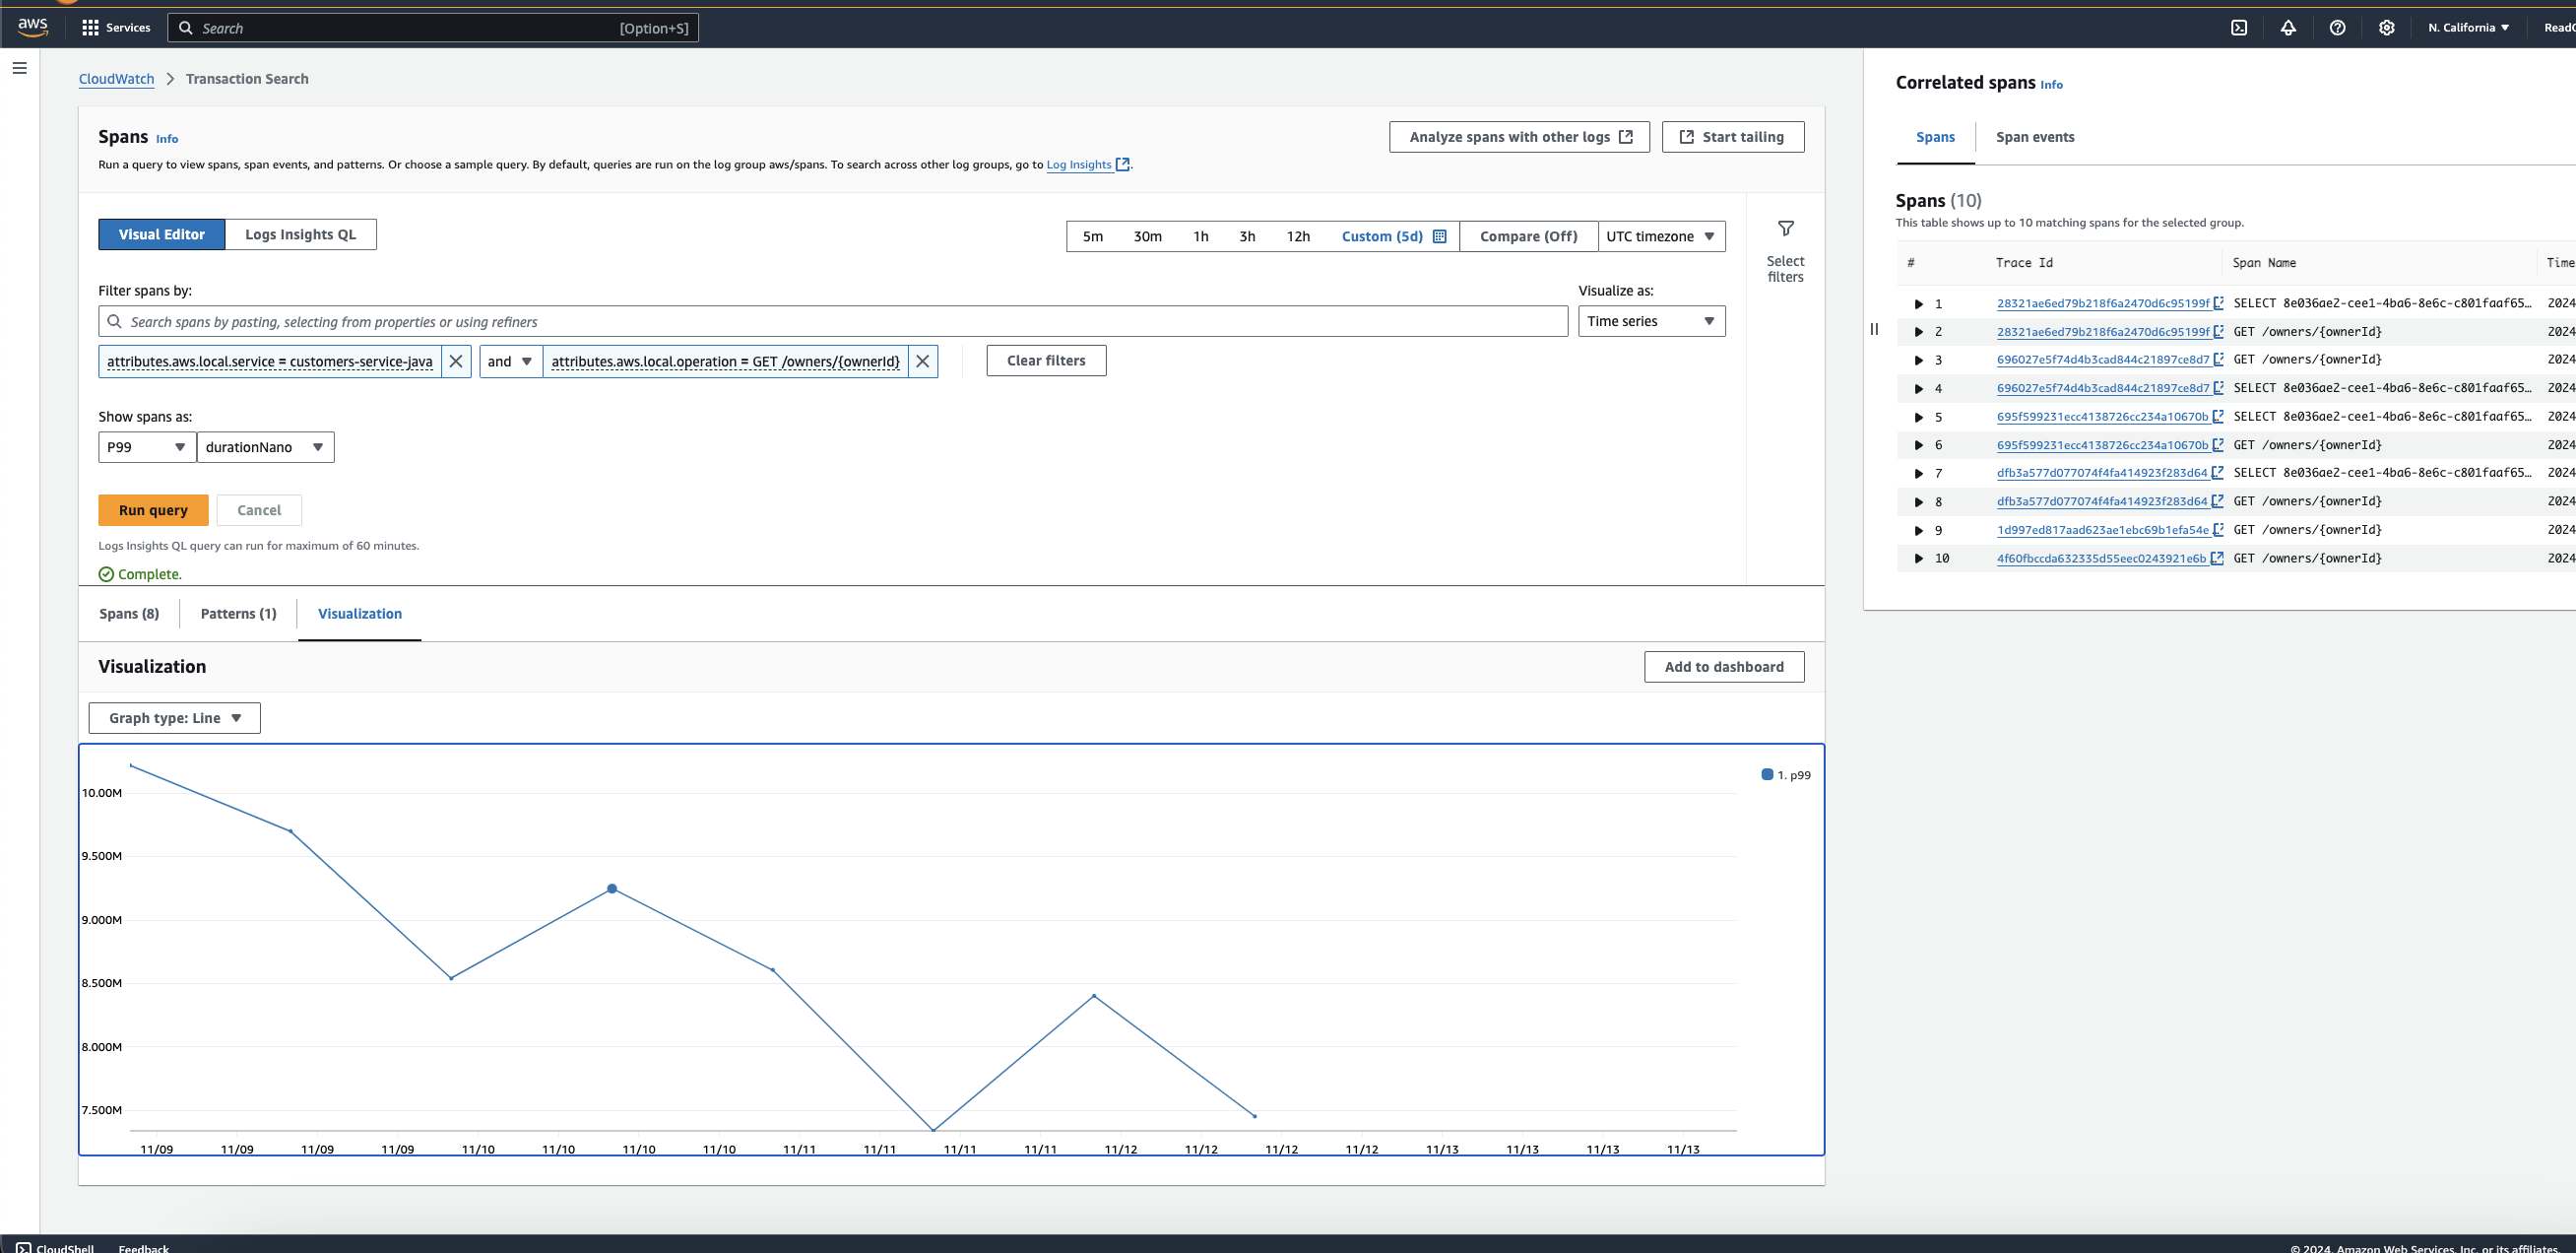
The following screenshots show how you can view p99 latency trends for an API with this type of analysis.
Example scenario
In the visual editor, filter on the service and API you want to analyze.

Before you run your query, choose Time series from the Visualize as dropdown. Choose P99 for the duration statistic from the Show span as dropdown.

The results show a latency trend for the service, with the x-axis of the graph being time and y-axis being p99 duration.
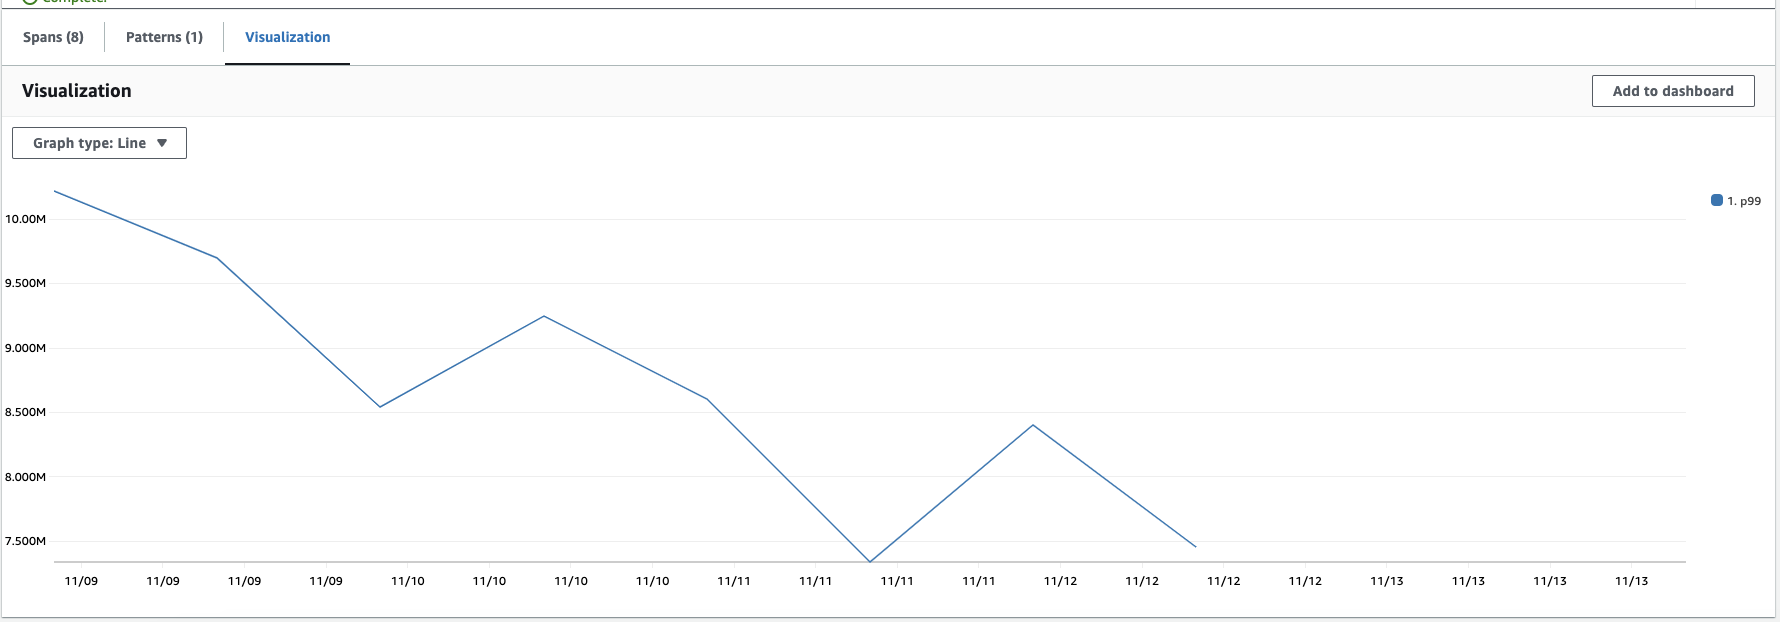
You can choose a point on the chart to view correlated spans and span events.
Group analysis
Aggregate spans or span events based on specific attributes, such as account IDs and status codes, to display statistical metrics. Use this type of analysis to analyze spans in clusters, compare different groups, and uncover trends at the macro level. Other use cases include the following:
Use cases
-
Identify top customers impacted by a service outage
-
Identify availability zones with the most errors
-
Identify the top slowest database queries
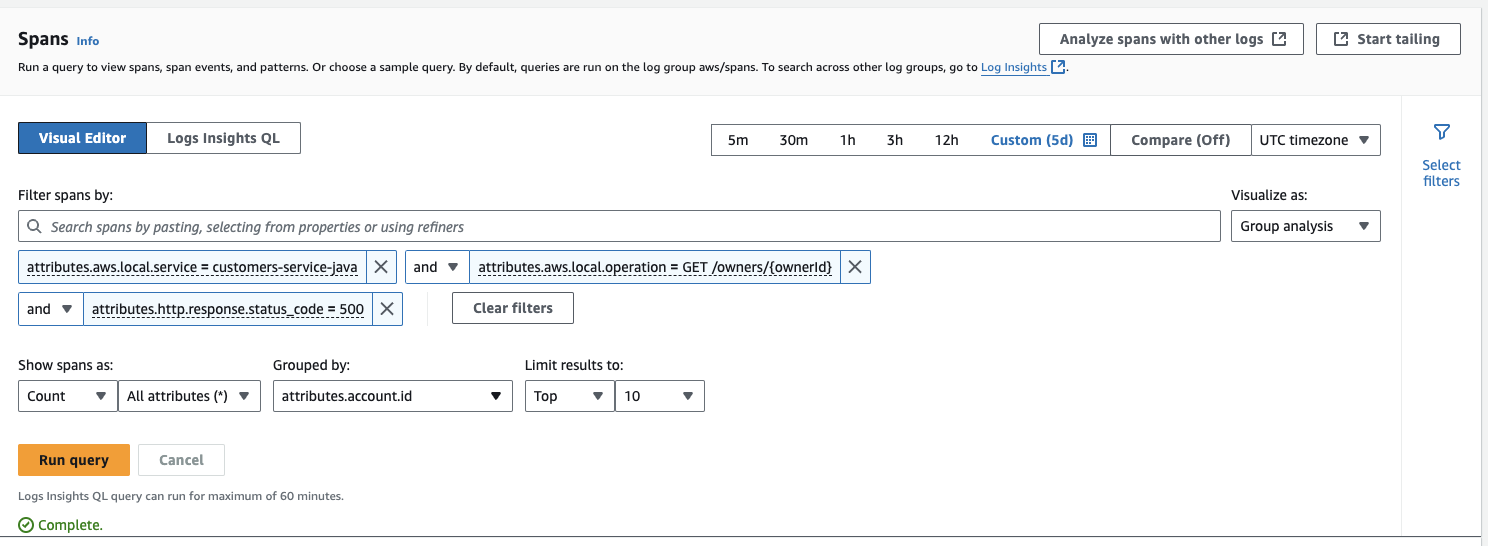
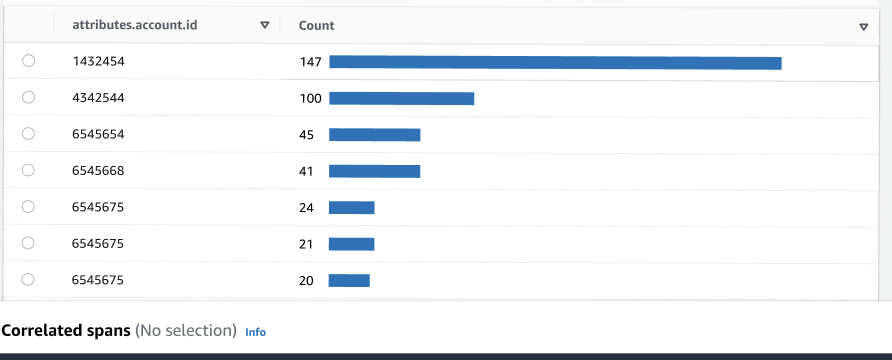
The following screenshots show how you can view the top customers impacted by a service outage with this type of analysis.
Example scenario
In the visual editor, you filter on the service experiencing issues.

Before you run your query, choose Group Analysis from the Visualize as dropdown.
Group your query results by account.id, and limit the number of results to 10..
The results show the top 10 customers who experienced the most number of errors.
CloudWatch Logs Insights
You can use CloudWatch Logs Insights to analyze your spans.
Example query
The following query shows the top five slowest database queries.
STATS pct(durationNano, 99) as `p99` by attributes.db.statement
| SORT p99 ASC
| LIMIT 5
| DISPLAY p99,attributes.db.statement
Example query
The following query shows which top five services are throwing errors.
FILTER `attributes.http.response.status_code` >= 500
| STATS count(*) as `count` by attributes.aws.local.service as service
| SORT count ASC
| LIMIT 5
| DISPLAY count,service