Troubleshooting application issues
With Application Signals, you can troubleshoot rarely occurring latency spikes in your applications. After you enable Transaction Search and configure a head sampling rate capturing 100% of spans, you get complete visibility into any application issue. The following scenario describes how Application Signals can be used with transaction spans to monitor your services and identify service quality issues.
Example troubleshooting scenario
This scenario focuses on a pet clinic application composed of several micro-services calling third-party payment APIs. These calls have been intermittently slow, thus impacting revenue.
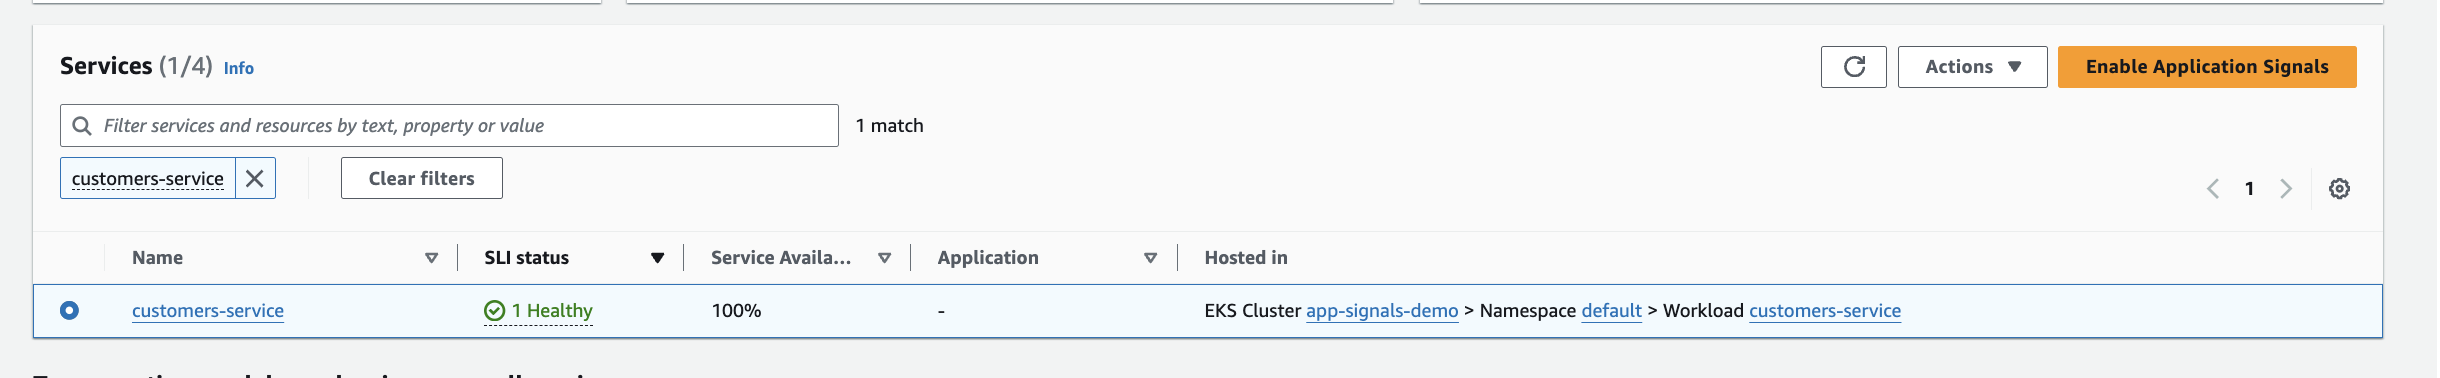
Jane opens the CloudWatch Application Signals console and notices a customer-service application responsible for registering customers is healthy and not breaching any SLOs.
She opens the service to investigate any patterns of rarely occurring failures and notices the registration API experienced intermittent p99 latency spikes.
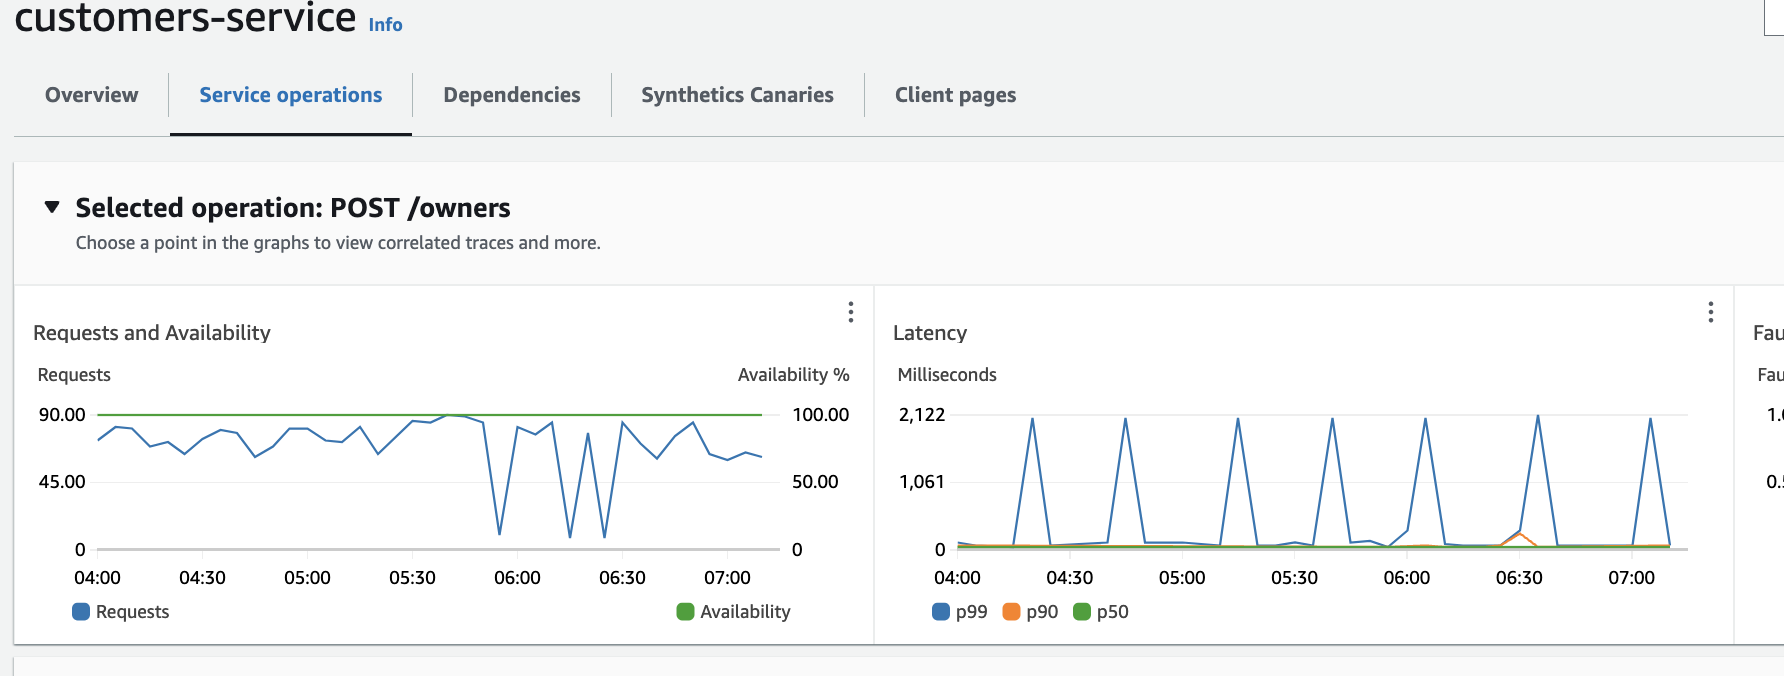
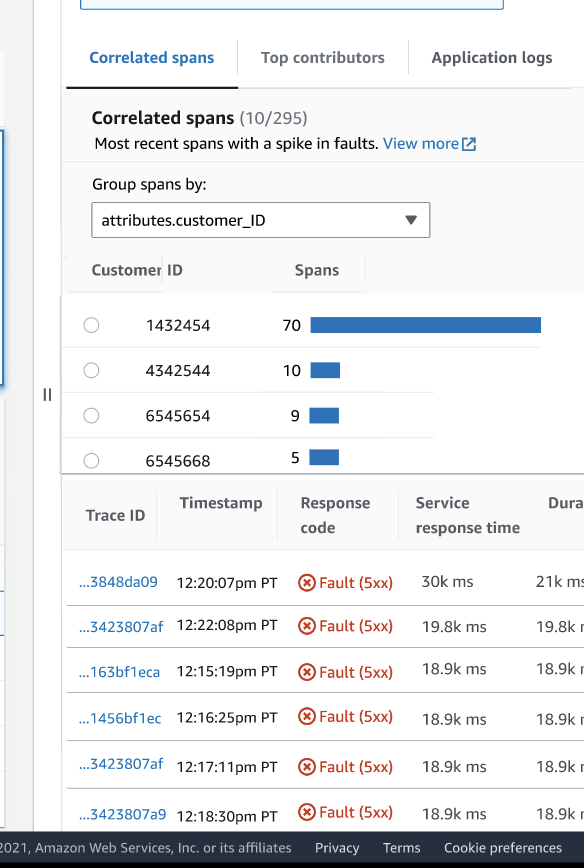
Jane chooses a datapoint in the latency chart to view correlated spans. She groups the spans by customer ID to view all the customers who are impacted by the latency spikes.
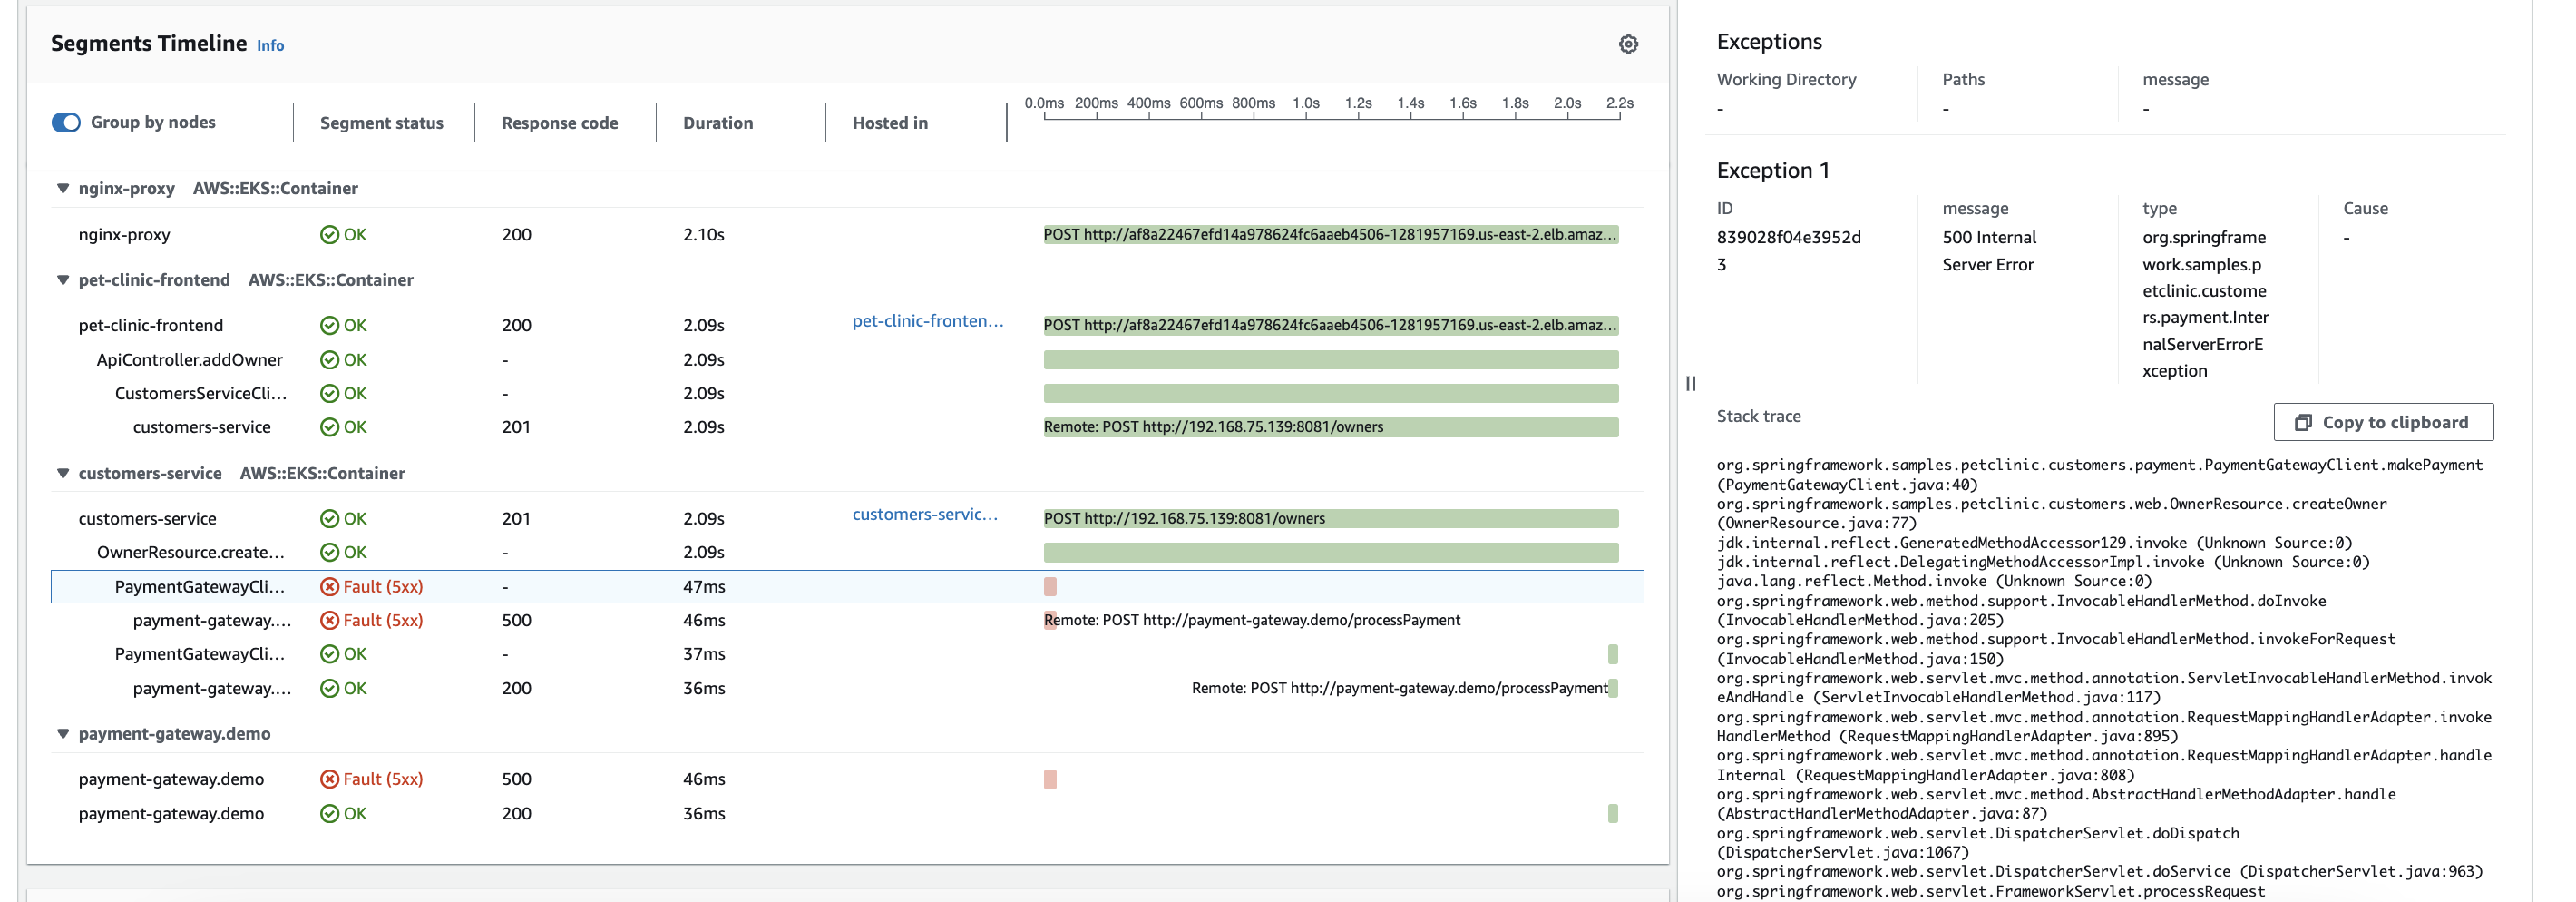
Jane selects one of the correlated spans with a fault status, which opens the trace detail page for the selected trace. She scrolls to the segments timeline section to follow the call path, where she notices that calls to the payment gateway have been failing and preventing customers from registering.