Troubleshooting a failed canary
If your canary fails, check the following for troubleshooting.
General troubleshooting
-
Use the canary details page to find more information. In the CloudWatch console, choose Canaries in the navigation pane and then choose the name of the canary to open the canary details page. In the Availability tab, check the SuccessPercent metric to see whether the problem is constant or intermittent.
While still in the Availability tab, choose a failed data point to see screenshots, logs, and step reports (if available) for that failed run.
If a step report is available because steps are part of your script, check to see which step has failed and see the associated screenshots to see the issue that your customers are seeing.
You can also check the HAR files to see if one or more requests are failing. You can dig deeper by using logs to drill down on failed requests and errors. Finally, you can compare these artifacts with the artifacts from a successful canary run to pinpoint the issue.
By default, CloudWatch Synthetics captures screenshots for each step in a UI canary. However, your script might be configured to disable screenshots. During debugging, you may want to enable screenshots again. Similarly, for API canaries you might want to see HTTP request and response headers and body during debugging. For information about how to include this data in the report, see executeHttpStep(stepName, requestOptions, [callback], [stepConfig]).
-
If you had a recent deployment to your application, roll it back and then debug later.
-
Connect to your endpoint manually to see if you can reproduce the same issue.
Topics
Canary fails after Lambda environment update
CloudWatch Synthetics canaries are implemented as Lambda functions in your account. These Lambda functions are subject to regular Lambda runtime updates containing security updates, bug fixes, and other improvements. Lambda strives to provide runtime updates that are backward-compatible with existing functions. However, as with software patching, there are rare cases in which a runtime update can negatively impact an existing function. If you believe your canary has been impacted by a Lambda runtime update, you can use the Lambda runtime management manual mode (in supported Regions) to temporarily roll back the Lambda runtime version. This keeps your canary function working and minimizes disruption, providing time to remedy the incompatibility before returning to the latest runtime version.
If your canary is failing after a Lambda runtime update, the best solution is to upgrade to one of the newest Synthetics runtimes. For more information about the latest runtimes, see Synthetics runtime versions.
As an alternative solution, in Regions where Lambda runtime management controls are available, you can revert a canary back to an older Lambda managed runtime, using manual mode for runtime management controls. You can set manual mode using either the Amazon CLI or by using the Lambda console, using the steps below in the following sections.
Warning
When you change the runtime settings to manual mode, your Lambda function won't receive automatic security updates until it is reverted back to Auto mode. During this period, your Lambda function might be susceptible to security vulnerabilities.
Prerequisites
-
Install jq
-
Install the latest version of the Amazon CLI. For more information, see Amazon CLI install and update instructions .
Step 1: Obtain the Lambda function ARN
Run the following command to retrieve the EngineArn field from the
response. This EngineArn is the ARN of the Lambda function that is associated
with the canary. You will use this ARN in the following steps.
aws synthetics get-canary --name my-canary | jq '.Canary.EngineArn'
Example output of EngingArn:
"arn:aws:lambda:us-west-2:123456789012:function:cwsyn-my-canary-dc5015c2-db17-4cb5-afb1-EXAMPLE991:8"
Step 2: Obtain the last good Lambda runtime version ARN
To help understand whether your canary was impacted by a Lambda runtime update, check whether the date and time when the Lambda runtime version ARN changes in your logs appeared to the date and time when you saw impact to your canary. If they do not match, it is probably not a Lambda runtime update that is causing your issues.
If your canary is impacted by a Lambda runtime update, you must identify the ARN of the working Lambda runtime version that you were previously using. Follow the instructions in Identifying runtime version changes to find the ARN of the previous runtime. Record the runtime version ARN, and continue to Step 3. for setting the runtime management configuration.
If your canary has not yet been impacted by a Lambda environment update, then you can
find the ARN of the Lambda runtime version that you are currently using. Run the following
command to retrieve the RuntimeVersionArn of the Lambda function from the
response.
aws lambda get-function-configuration \
--function-name "arn:aws:lambda:us-west-2:123456789012:function:cwsyn-my-canary-dc5015c2-db17-4cb5-afb1-EXAMPLE991:8" | jq '.RuntimeVersionConfig.RuntimeVersionArn'
Example output of RuntimeVersionArn:
"arn:aws:lambda:us-west-2::runtime:EXAMPLE647b82f490a45d7ddd96b557b916a30128d9dcab5f4972911ec0f"
Step 3: Updating the Lambda runtime management configuration
You can use either the Amazon CLI or the Lambda console to update the runtime management configuration.
To set Lambda runtime management configuration manual mode using the Amazon CLI
Enter the following command to change the runtime management of the Lambda function to
manual mode. Be sure to replace the function-name and
qualifier with the Lambda function ARN and Lambda function version number
respectively, using the values you found in Step 1. Also replace the the
runtime-version-arn with the version ARN that you found in Step 2.
aws lambda put-runtime-management-config \ --function-name "arn:aws:lambda:us-west-2:123456789012:function:cwsyn-my-canary-dc5015c2-db17-4cb5-afb1-EXAMPLE991" \ --qualifier8\ --update-runtime-on "Manual" \ --runtime-version-arn "arn:aws:lambda:us-west-2::runtime:a993d90ea43647b82f490a45d7ddd96b557b916a30128d9dcab5f4972911ec0f"
To change a canary to manual mode using the Lambda console
Open the Amazon Lambda console at https://console.amazonaws.cn/lambda/
. -
Choose the Versions tab, choose the version number link that corresponds to your ARN, and choose the Code tab.
-
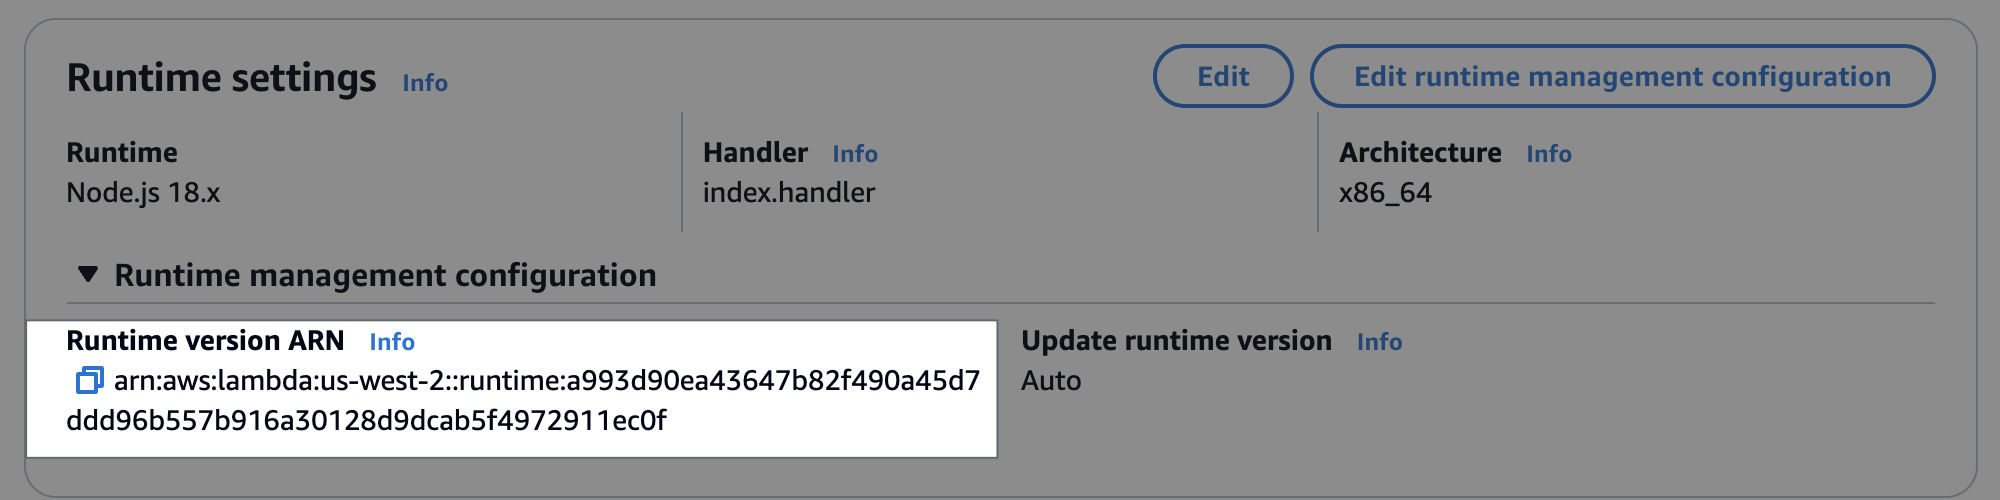
Scroll down to Runtime settings, expand Runtime management configuration, and copy the the Runtime version ARN .
-
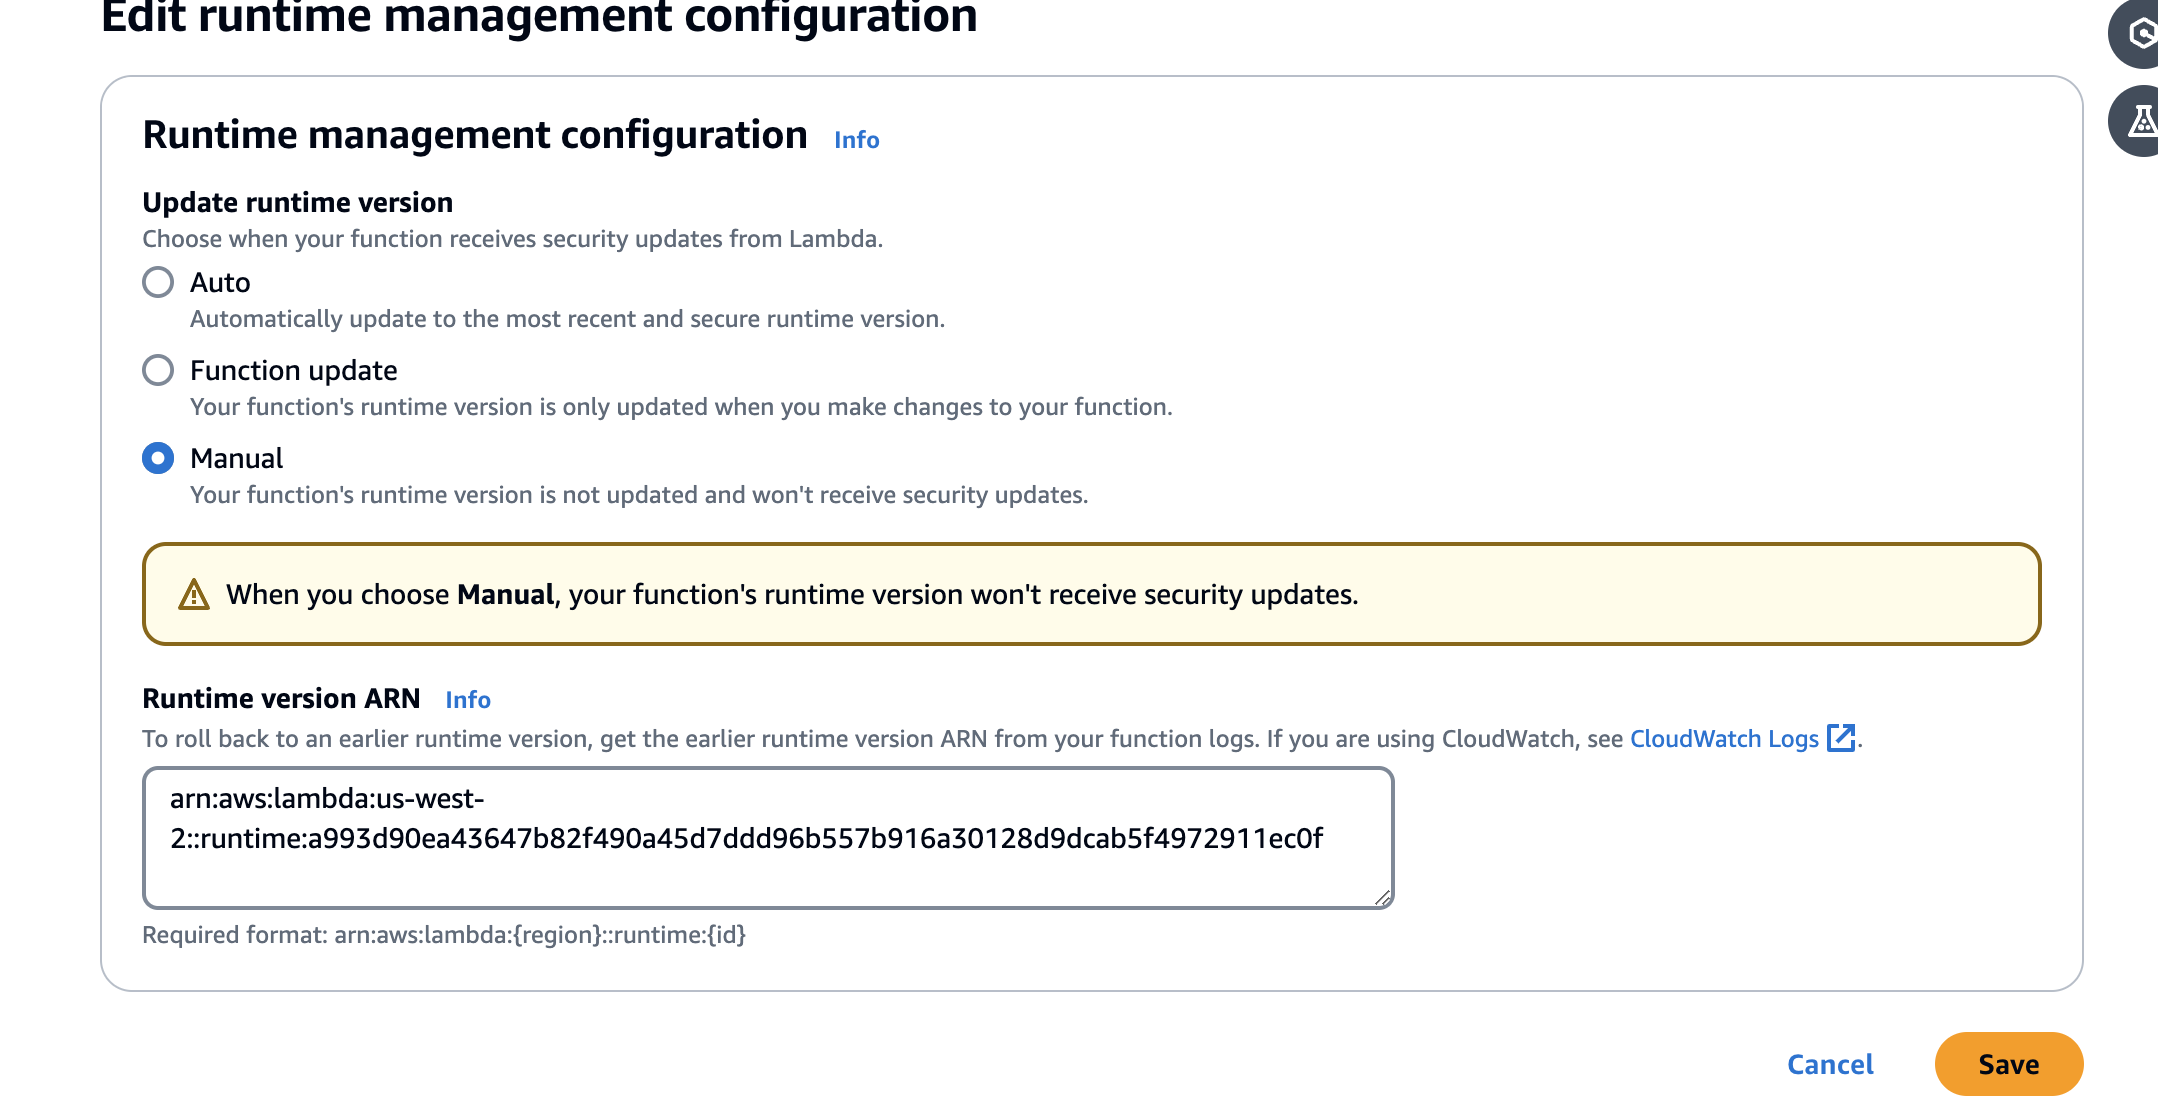
Choose Edit runtime management configuration, choose Manual, paste the runtime version ARN that you copied earlier into the Runtime version ARN field. Then choose Save.
My canary is blocked by Amazon WAF
To allow canary traffic through Amazon WAF,create a Amazon WAF string match condition that allows a custom string that you specify. For more information, see Working with string match conditions in the Amazon WAF documentation.
We strongly recommend that you use your own custom user-agent string instead of using default values. This provides better control over Amazon WAF filtering and improves security.
To set a custom user-agent string, do the following:
-
For Playwright runtimes, you can append your Amazon WAF approved custom user-agent string using the Synthetics configuration file. For more information, see CloudWatch Synthetics configurations.
-
For Puppeteer or Selenium runtimes, you can add your custom user-agent string using supported library functions. For Puppeteer runtimes, see async addUserAgent(page, userAgentString);. For Selenium runtimes, see add_user_agent(user_agent_str).
Waiting for an element to appear
After analyzing your logs and screenshots, if you see that your script is waiting for an
element to appear on screen and times out, check the relevant screenshot to see if the
element appears on the page. Verify your xpath to make sure that it is correct.
For Puppetteer-related issues, check
Puppeteer's GitHub page
Node is either not visible or not an HTMLElement for page.click()
If a node is not visible or is not an HTMLElement for page.click(),
first verify the xpath that you are using to click the element. Also, if your
element is at the bottom of the screen, adjust your viewport. CloudWatch Synthetics by default
uses a viewport of 1920 * 1080. You can set a different viewport when you launch the browser
or by using the Puppeteer function page.setViewport.
Unable to upload artifacts to S3, Exception: Unable to fetch S3 bucket location: Access Denied
If your canary fails because of an Amazon S3 error, CloudWatch Synthetics was unable to upload screenshots, logs, or reports created for the canary because of permission issues. Check the following:
-
Check that the canary's IAM role has the
s3:ListAllMyBucketspermission, thes3:GetBucketLocationpermission for the correct Amazon S3 bucket, and thes3:PutObjectpermission for the bucket where the canary stores its artifacts. If the canary performs visual monitoring, the role also needs thes3:GetObjectpermission for the bucket. These same permissions are also required in the Amazon VPC S3 Gateway Endpoint Policy, if the canary is deployed in a VPC with a VPC endpoint. -
If the canary uses an Amazon KMS customer managed key for encryption instead of the standard Amazon managed key (default), the canary's IAM role might not have the permission to encrypt or decrypt using that key. For more information, see Encrypting canary artifacts.
-
Your bucket policy might not allow the encryption mechanism that the canary uses. For example, if your bucket policy mandates to use a specific encryption mechanism or KMS key, then you must select the same encryption mode for your canary.
If the canary performs visual monitoring, see Updating artifact location and encryption when using visual monitoring for more information.
Error: Protocol error (Runtime.callFunctionOn): Target closed.
This error appears if there are some network requests after the page or browser is
closed. You might have forgotten to wait for an asynchronous operation. After executing your
script, CloudWatch Synthetics closes the browser. The execution of any asynchronous operation
after the browser is closed might cause target closed error.
Canary Failed. Error: No datapoint - Canary Shows timeout error
This means that your canary run exceeded the timeout. The canary execution stopped before CloudWatch Synthetics could publish success percent CloudWatch metrics or update artifacts such as HAR files, logs and screenshots. If your timeout is too low, you can increase it.
By default, a canary timeout value is equal to its frequency. You can manually adjust the timeout value to be less than or equal to the canary frequency. If your canary frequency is low, you must increase the frequency to increase the timeout. You can adjust both the frequency and the timeout value under Schedule when you create or update a canary by using the CloudWatch Synthetics console.
Be sure that your canary timeout value is no shorter than 15 seconds to allow for Lambda cold starts and the time it takes to boot up the canary instrumentation.
Canary artifacts are not available to view in the CloudWatch Synthetics console when this error happens. You can use CloudWatch Logs to see the canary's logs.
To use CloudWatch Logs to see the logs for a canary
Open the CloudWatch console at https://console.amazonaws.cn/cloudwatch/
. -
In the left navigation pane, choose Log groups.
-
Find the log group by typing the canary name in the filter box. Log groups for canaries have the name /aws/lambda/cwsyn-
canaryName-randomId.
Trying to access an internal endpoint
If you want your canary to access an endpoint on your internal network, we recommend that you set up CloudWatch Synthetics to use VPC. For more information, see Running a canary on a VPC.
Canary runtime version upgrade and downgrade issues
If you recently upgraded the canary from runtime version syn-1.0 to a later
version, it may be a cross-origin request sharing (CORS) issue. For more information, see Cross-origin request sharing (CORS) issue.
If you recently downgraded the canary to an older runtime version, check to make sure
that the CloudWatch Synthetics functions that you are using are available in the older runtime
version that you downgraded to. For example, the executeHttpStep function is
available for runtime version syn-nodejs-2.2 and later. To check on the
availability of functions, see Writing a canary script.
Note
When you plan to upgrade or downgrade the runtime version for a canary, we recommend that you first clone the canary and update the runtime version in the cloned canary. Once you have verified that the clone with the new runtime version works, you can update the runtime version of your original canary and delete the clone.
Cross-origin request sharing (CORS) issue
In a UI canary, if some network requests are failing with 403 or
net::ERR_FAILED, check whether the canary has active tracing enabled and also uses
the Puppeteer function page.setExtraHTTPHeaders to add headers. If so, the
failed network requests might be caused by cross-origin request sharing (CORS) restrictions.
You can confirm whether this is the case by disabling active tracing or removing the extra
HTTP headers.
Why does this happen?
When active tracing is used, an extra header is added to all outgoing requests to trace
the call. Modifying the request headers by adding a trace header or adding extra headers
using Puppeteer's page.setExtraHTTPHeaders causes a CORS check for
XMLHttpRequest (XHR) requests.
If you don't want to disable active tracing or remove the extra headers, you can update
your web application to allow cross-origin access or you can disable web security by using
the disable-web-security flag when you launch the Chrome browser in your
script.
You can override launch parameters used by CloudWatch Synthetics and pass additional
disable-web-security flag parameters by using the CloudWatch Synthetics launch function.
For more information, see Library functions available for Node.js canary scripts using Puppeteer.
Note
You can override launch parameters used by CloudWatch Synthetics when you use runtime
version syn-nodejs-2.1 or later.
Canary race condition issues
For the best experience when using CloudWatch Synthetics, ensure that the code written for the canaries is idempotent. Otherwise, in rare cases, canary runs may encounter race conditions when the canary interacts with the same resource across different runs.
Troubleshooting a canary on a VPC
If you have issues after creating or updating a canary on a VPC, one of the following sections might help you troubleshoot the problem.
New canary in error state or canary can't be updated
If you create a canary to run on a VPC and it immediately goes into an error state, or
you can't update a canary to run on a VPC, the canary's role might not have the right
permissions. To run on a VPC, a canary must have the permissions
ec2:CreateNetworkInterface, ec2:DescribeNetworkInterfaces, and
ec2:DeleteNetworkInterface. These permissions are all contained in the
AWSLambdaVPCAccessExecutionRole managed policy. For more information, see Execution Role and User
Permissions.
If this issue happened when you created a canary, you must delete the canary, and create a new one. If you use the CloudWatch console to create the new canary, under Access Permissions, select Create a new role. A new role that includes all permissions required to run the canary is created.
If this issue happens when you update a canary, you can update the canary again and provide a new role that has the required permissions.
"No test result returned" error
If a canary displays a "no test result returned" error, one of the following issues might be the cause:
-
If your VPC does not have internet access, you must use VPC endpoints to give the canary access to CloudWatch and Amazon S3. You must enable the DNS resolution and DNS hostname options in the VPC for these endpoint addresses to resolve correctly. For more information, see Using DNS with Your VPC and Using CloudWatch and CloudWatch Synthetics with interface VPC endpoints .
-
Canaries must run in private subnets within a VPC. To check this, open the Subnets page in the VPC console. Check the subnets that you selected when configuring the canary. If they have a path to an internet gateway (igw-), they are not private subnets.
To help you troubleshoot these issues, see the logs for the canary.
To see the log events from a canary
Open the CloudWatch console at https://console.amazonaws.cn/cloudwatch/
. -
In the navigation pane, choose Log groups.
-
Choose the name of the canary's log group. The log group name starts with
/aws/lambda/cwsyn-.canary-name
Troubleshooting an auto retry canary
To understand why your canary is failing or to analyze specific failed attempts, follow these troubleshooting steps.
Open the CloudWatch console at https://console.amazonaws.cn/cloudwatch/
. -
In the navigation pane, choose Application Signals, Synthetics Canaries.
-
Choose the Canary.
-
Under the Availability tab, you can examine the run details by either:
-
Selecting a specific point on the Canary Runs graph
-
Under Issues, selecting a record. Note that retry attempts are tagged and share timestamps with their scheduled runs
You can view additional information under Steps, Screenshot, Logs, HAR file, or Traces (if active tracing is enabled).
-
-
Under Canary artifacts and Amazon S3 location, you can access the artifact and navigate to the Amazon S3 folders or buckets through the available links.
-
The Canary runs graph uses different colored points to indicate various status:
-
Blue Points – Indicates successful scheduled runs with a consistent value of 100%
-
Red Points – Displays failure of both scheduled runs and all retries, marked at 0%
-
Orange Points – Displays either 0% or 100%. 0% indicates ongoing retry following previous attempt failures and 100% means success was achieved after retrying
-