Create a CloudWatch alarm based on anomaly detection
You can create an alarm based on CloudWatch anomaly detection, which analyzes past metric data and creates a model of expected values. The expected values take into account the typical hourly, daily, and weekly patterns in the metric.
You set a value for the anomaly detection threshold, and CloudWatch uses this threshold with the model to determine the "normal" range of values for the metric. A higher value for the threshold produces a thicker band of "normal" values.
You can choose whether the alarm is triggered when the metric value is above the band of expected values, below the band, or either above or below the band.
You also can create anomaly detection alarms on single metrics and the outputs of metric math expressions. You can use these expressions to create graphs that visualize anomaly detection bands.
In an account set up as a monitoring account for CloudWatch cross-account observability, you can create anomaly detectors on metrics in source accounts in addition to metrics in the monitoring account.
For more information, see Using CloudWatch anomaly detection.
Note
If you're already using anomaly detection for visualization purposes on a metric in the Metrics console and you create an anomaly detection alarm on that same metric, then the threshold that you set for the alarm doesn't change the threshold that you already set for visualization. For more information, see Creating a graph.
To create an alarm that's based on anomaly detection
-
Open the CloudWatch console at https://console.amazonaws.cn/cloudwatch/
. -
In the navigation pane, choose Alarms, All alarms.
-
Choose Create alarm.
-
Choose Select Metric.
-
Do one of the following:
-
Choose the service namespace that contains your metric, and then continue choosing options as they appear to narrow down your options. When a list of metrics appears, select the check box that's next to your metric.
-
In the search box, enter the name of a metric, dimension, or resource ID. Select one of the results, and then continue choosing options as they appear until a list of metrics appears. Select the check box that's next to your metric.
-
-
Choose Graphed metric.
-
(Optional) For Statistic, choose the dropdown, and then select one of the predefined statistics or percentiles. You can use the search box in the dropdown to specify a custom percentile, such as
p95.45. -
(Optional) For Period, choose the dropdown, and then select one of the predefined evaluation periods.
Note
When CloudWatch evaluates your alarm, it aggragates the period into a single datapoint. For an anomaly detection alarm, the evaluation period must be one minute or longer.
-
-
Choose Next.
-
Under Conditions, specify the following:
-
Choose Anomaly detection.
If the model for this metric and statistic already exists, CloudWatch displays a preview of the anomaly detection band in the graph at the top of the screen. After you create your alarm, it can take up to 15 minutes for the actual anomaly detection band to appear in the graph. Before that, the band that you see is an approximation of the anomaly detection band.
Tip
To see the graph at the top of the screen in a longer time frame, choose Edit at the top-right of the screen.
If the model for this metric and statistic doesn't already exist, CloudWatch generates the anomaly detection band after you finish creating your alarm. For new models, it can take up to 3 hours for the actual anomaly detection band to appear in your graph. It can take up to two weeks for the new model to train, so the anomaly detection band shows more accurate expected values.
-
For Whenever
metricis, specify when to trigger the alarm. For example, when the metric is greater than, lower than, or outside the band (in either direction). -
For Anomaly detection threshold, choose the number to use for the anomaly detection threshold. A higher number creates a thicker band of "normal" values that is more tolerant of metric changes. A lower number creates a thinner band that will go to
ALARMstate with smaller metric deviations. The number does not have to be a whole number. -
Choose Additional configuration. For Datapoints to alarm, specify how many evaluation periods (data points) must be in the
ALARMstate to trigger the alarm. If the two values here match, you create an alarm that goes toALARMstate if that many consecutive periods are breaching.To create an M out of N alarm, specify a number for the first value that is lower than the number for the second value. For more information, see Alarm evaluation.
-
For Missing data treatment, choose how the alarm behaves when some data points are missing. For more information, see Configuring how CloudWatch alarms treat missing data.
-
If the alarm uses a percentile as the monitored statistic, a Percentiles with low samples box appears. Use it to choose whether to evaluate or ignore cases with low sample rates. If you choose Ignore (maintain alarm state), the current alarm state is always maintained when the sample size is too low. For more information, see Percentile-based alarms and low data samples.
-
-
Choose Next.
-
Under Notification, select an SNS topic to notify when the alarm is in
ALARMstate,OKstate, orINSUFFICIENT_DATAstate.To send multiple notifications for the same alarm state or for different alarm states, choose Add notification.
Choose Remove if you don't want the alarm to send notifications.
-
You can set up the alarm to perform EC2 actions or invoke a Lambda function when it changes state, or to create a Systems Manager OpsItem or incident when it goes into ALARM state. To do this, choose the appropriate button and then choose the alarm state and action to perform.
If you choose a Lambda function as an alarm action, you specify the function name or ARN, and you can optionally choose a specific version of the function.
For more information about Systems Manager actions, see Configuring CloudWatch to create OpsItems from alarms and Incident creation.
Note
To create an alarm that performs an Amazon Systems Manager Incident Manager action, you must have certain permissions. For more information, see Identity-based policy examples for Amazon Systems Manager Incident Manager.
-
Choose Next.
-
Under Name and description, enter a name and description for your alarm, and choose Next. The name must contain only UTF-8 characters, and can't contain ASCII control characters. The description can include markdown formatting, which is displayed only in the alarm Details tab in the CloudWatch console. The markdown can be useful to add links to runbooks or other internal resources.
Tip
The alarm name must contain only UTF-8 characters, and can't contain ASCII control characters
-
Under Preview and create, confirm that your alarm's information and conditions are correct, and choose Create alarm.
Editing an anomaly detection model
After you create an alarm, you can adjust the anomaly detection model. You can exclude certain time periods from being used in the model creation. It is critical that you exclude unusual events such as system outages, deployments, and holidays from the training data. You can also specify whether to adjust the model for Daylight Savings Time changes.
To edit the anomaly detection model for an alarm
Open the CloudWatch console at https://console.amazonaws.cn/cloudwatch/
. -
In the navigation pane, choose Alarms, All alarms.
-
Choose the name of the alarm. If necessary, use the search box to find the alarm.
-
Choose View, In metrics.
-
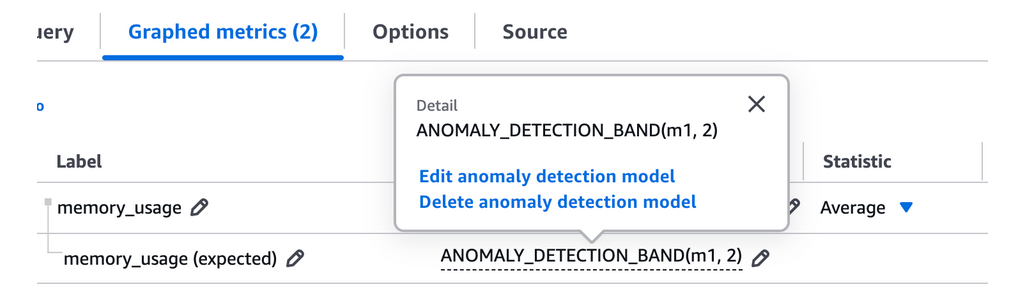
In the Details column, choose the ANOMALY_DETECTION_BAND keyword, and then choose Edit anomaly detection model in the popup.
-
To exclude a time period from being used to produce the model, choose the calendar icon by End date. Then, select or enter the days and times to exclude from training and choose Apply.
-
If the metric is sensitive to Daylight Savings Time changes, select the appropriate time zone in the Metric timezone box.
-
Choose Update.
Deleting an anomaly detection model
Using anomaly detection for an alarm accrues charges. As a best practice, if your alarm no longer needs an anomaly detection model, delete the alarm first and the model second. When anomaly detection alarms are evaluated, any missing anomaly detectors are created on your behalf. If you delete the model without deleting the alarm, the alarm automatically recreates the model.
To delete an alarm
Open the CloudWatch console at https://console.amazonaws.cn/cloudwatch/
. -
In the navigation pane, choose Alarms, All Alarms.
-
Choose the name of the alarm.
-
Choose Actions, Delete.
-
In the confirmation box, choose Delete.
To delete an anomaly detection model that was used for an alarm
Open the CloudWatch console at https://console.amazonaws.cn/cloudwatch/
. -
In the navigation pane, choose Metrics, and then choose All metrics.
-
Choose Browse, and then select the metric that includes the anomaly detection model. You can search for your metric in the search box or select your metric by choosing through the options.
-
(Optional) If you're using the original interface, choose All metrics, and then choose the metric that includes the anomaly detection model. You can search for your metric in the search box or select your metric by choosing through the options.
-
-
Choose Graphed metrics.
-
In the Graphed metrics tab, in the Details column, choose the ANOMALY_DETECTION_BAND keyword, and then choose Delete anomaly detection model in the popup.
-
(Optional) If you're using the original interface, choose Edit model. You're directed to a new screen. On the new screen, choose Delete model, and then choose Delete.
-