Analyzing execution plans with CloudWatch Database Insights
You can analyze execution plans for the Amazon Aurora PostgreSQL, RDS for Microsoft SQL Server and RDS for Oracle databases by using the following methods.
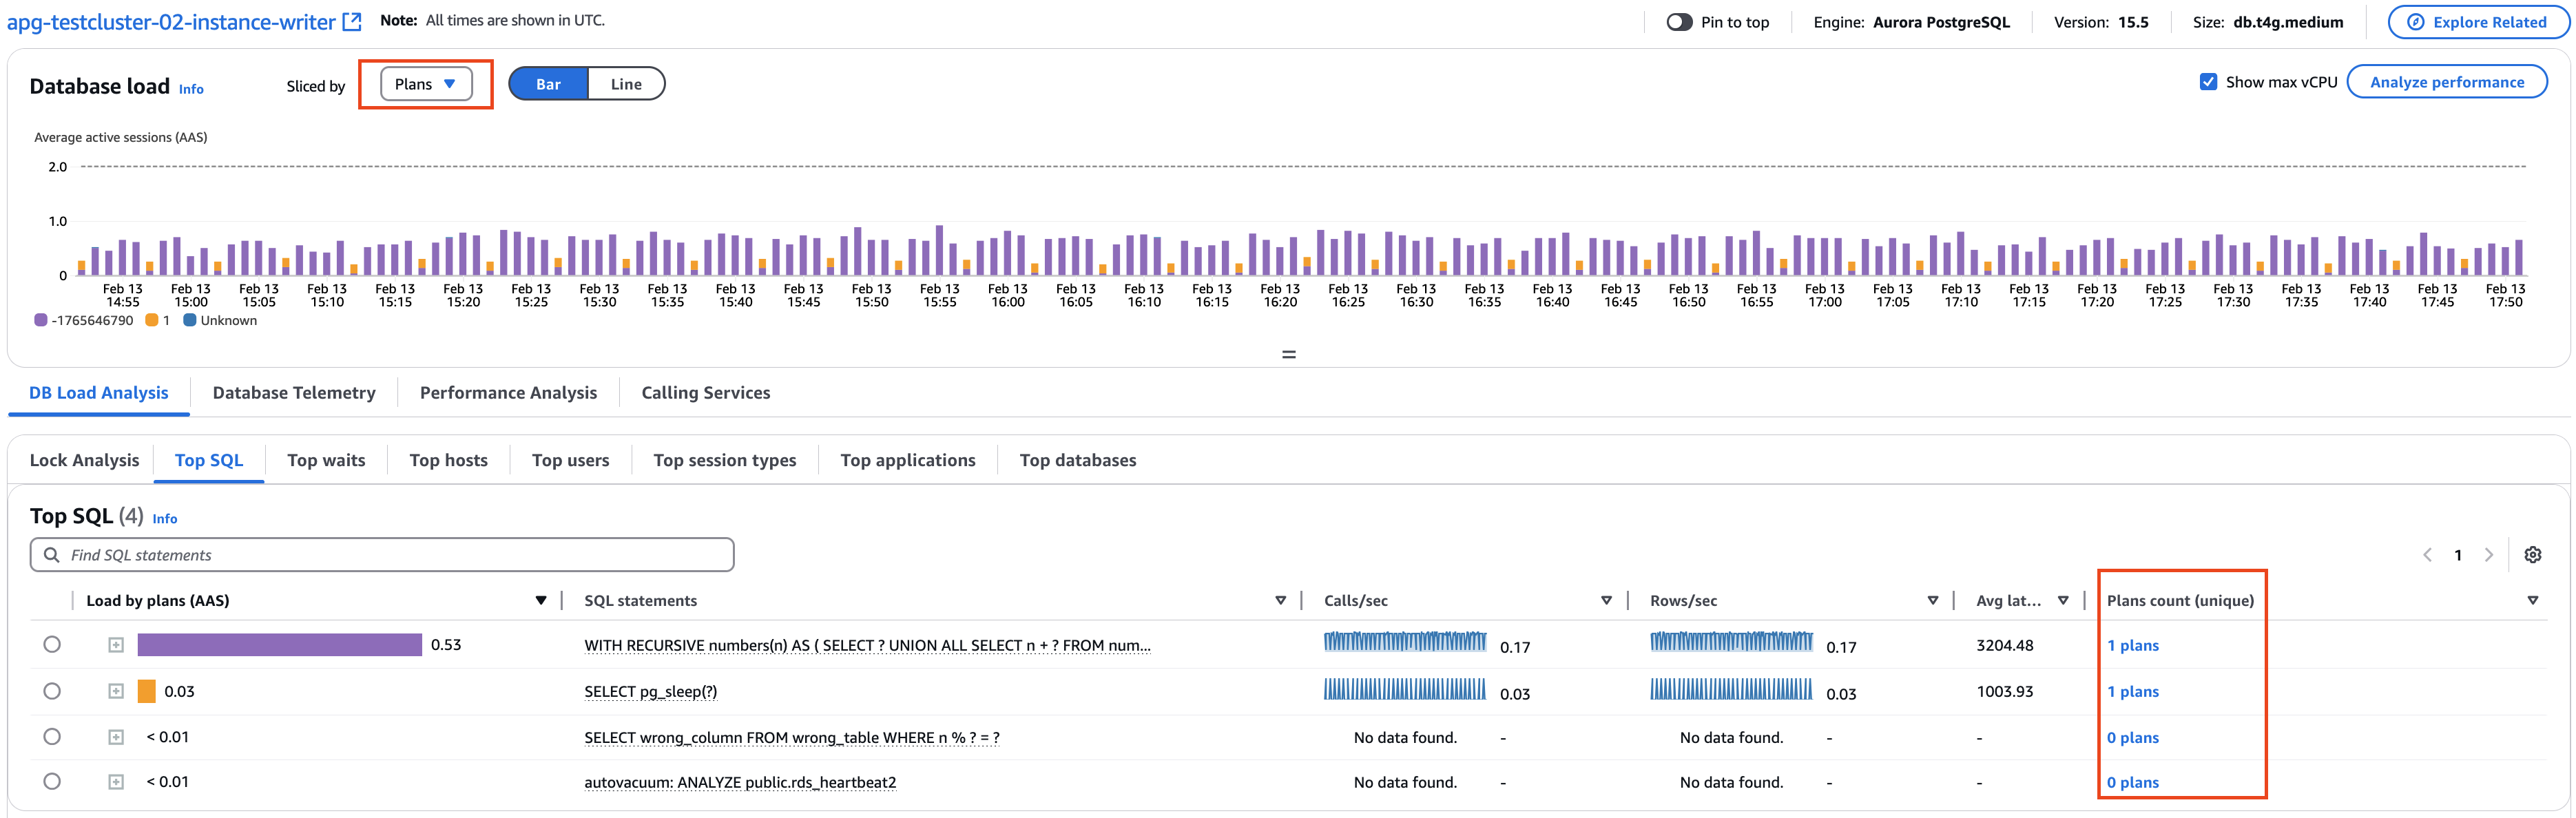
Sliced by dropdown – Choose the Plans dimension in the Database load chart to view how different plans contribute to DB Load over time.
Top SQL tab – Choose DB Load Analysis, then choose the Top SQL tab to view the number of plans for each digest query.
To analyze execution plans for a digest query, choose the query and then choose the Plans tab. For more information, see the following procedure.
Prerequisites
To analyze execution plans, you must be using the Advanced mode of Database Insights. For information on how to turn on Advanced mode, see Turning on the Advanced mode of Database Insights for Amazon Aurora and Turning on the Advanced mode of Database Insights for Amazon Relational Database Service.
If you are using Aurora PostgreSQL, you also have the following prerequisites:
Your DB instance must use Aurora PostgreSQL version 14.10, 15.5, or later. For information about upgrading your Aurora PostgreSQL DB cluster, see Upgrading Amazon Aurora PostgreSQL DB clusters in the Amazon Aurora User Guide.
You must configure your DB cluster to analyze execution plans by setting the parameter
aurora_compute_plan_idtoonwith one of the following options.Creating a DB cluster parameter group in Amazon Aurora in the Amazon Aurora User Guide
Modifying parameters in a DB cluster parameter group in Amazon Aurora in the Amazon Aurora User Guide
Analyze execution plans
To analyze execution plans, use the following procedure.
To analyze execution plans
Sign in to the Amazon Web Services Management Console and open the CloudWatch console at https://console.amazonaws.cn/cloudwatch/
. Choose Insights.
Choose Database Insights.
Choose the Database Instance view.
Choose a DB instance.
Choose the Top SQL tab. The Plans Count column shows the number of plans collected for each digest query.
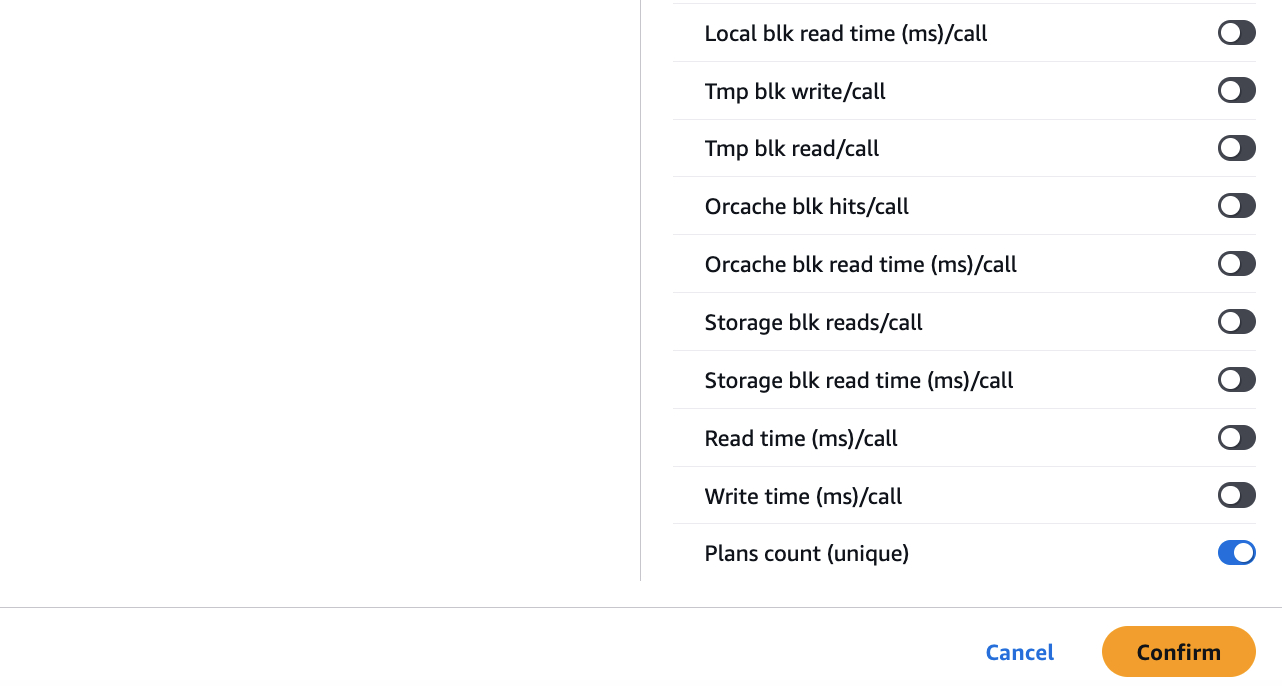
(Optional) If the Plans Count column doesn't appear, choose the Settings icon on the Top SQL table to customize the visibility and order of columns.
Choose a digest query to expand it into its component statements.
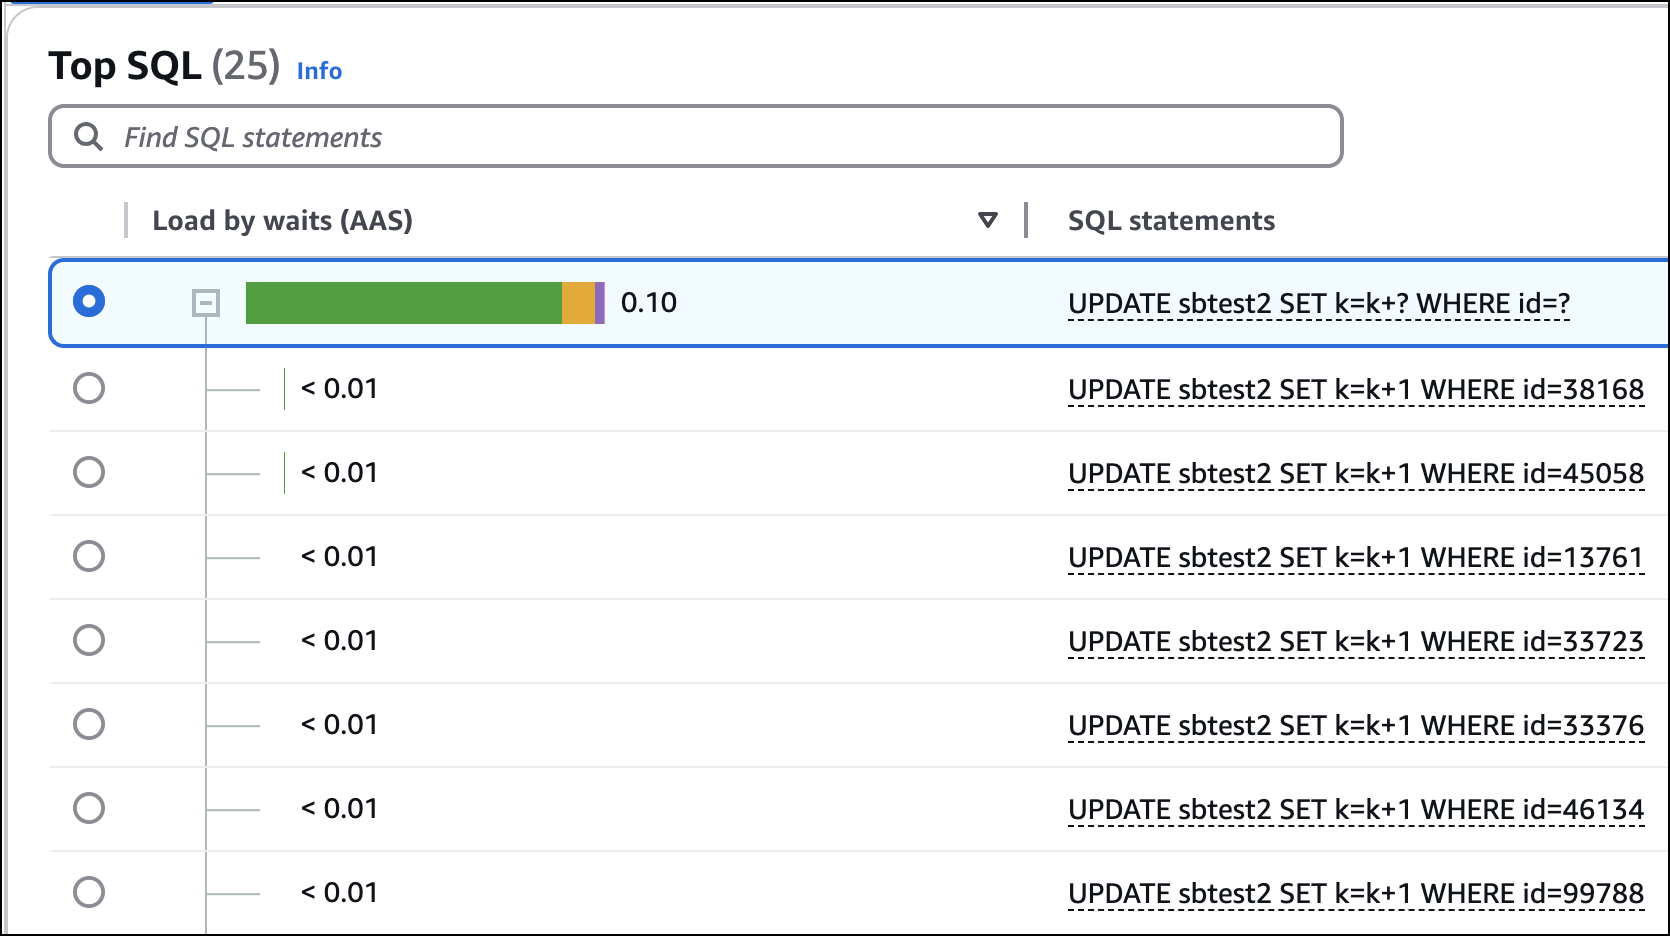
Scroll down and view the SQL text. Then, choose the Plans tab.
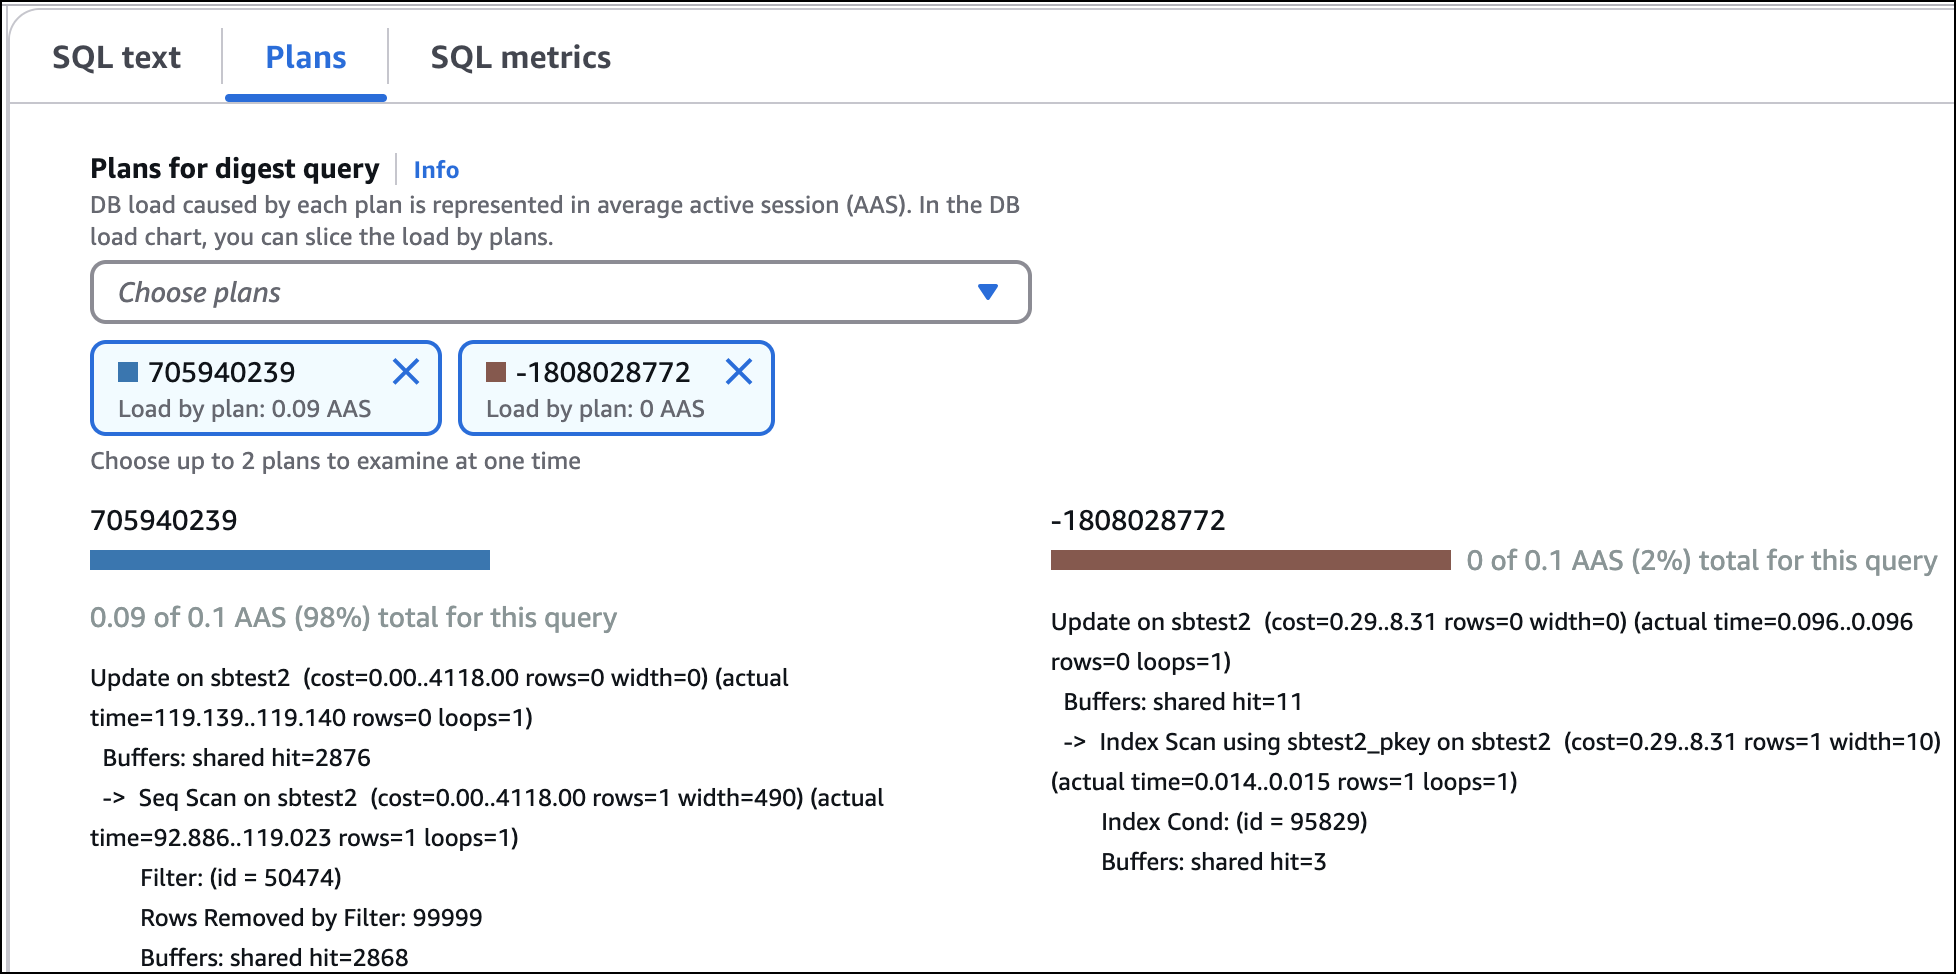
By default, CloudWatch displays the estimated execution plan. For Aurora PostgreSQL, to view actual execution plans, enable the
aurora_stat_plans.with_analyzeparameter for your DB instance. For more information about the parameteraurora_stat_plans.with_analyze, see Monitoring query execution plans and peak memory for Aurora PostgreSQL in the Amazon Aurora User Guide.To compare plans from the same digest query, choose two Plans from the Plans for digest query list.
You can view either one or two plans for a query at a time. In the following example screenshot, both plans are for Aurora PostgreSQL.
You can also view how each plan contributes to DBLoad over time by choosing Plans in the Slice by drop-down in the DBLoad chart.