Analyzing lock trees for Amazon Aurora PostgreSQL and Amazon RDS for PostgreSQL with CloudWatch Database Insights
To troubleshoot performance issues caused by locks, you can analyze lock trees for Amazon Aurora PostgreSQL and Amazon RDS for PostgreSQL databases with CloudWatch Database Insights using the following.
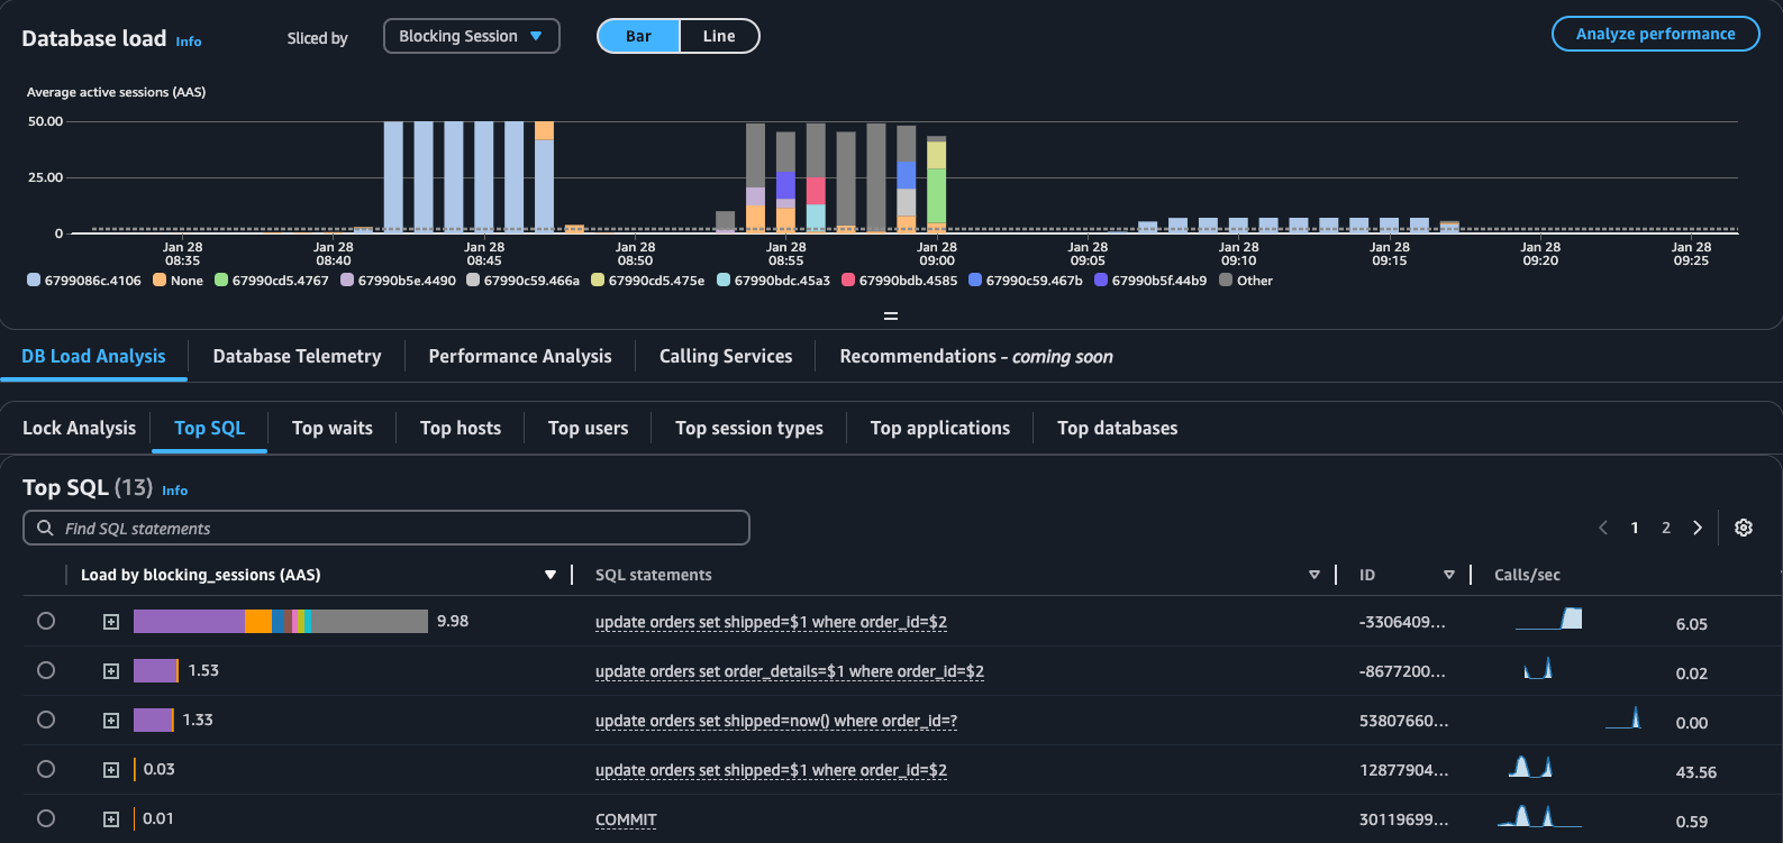
Sliced by dropdown – Choose the Blocking object, Blocking session, or Blocking SQL dimensions in the Database load chart to view how distinct top blockers contribute to DB Load over time. With the DB load chart, you can analyze if top blockers are constant or change often. Then, you can troubleshoot the blockers.
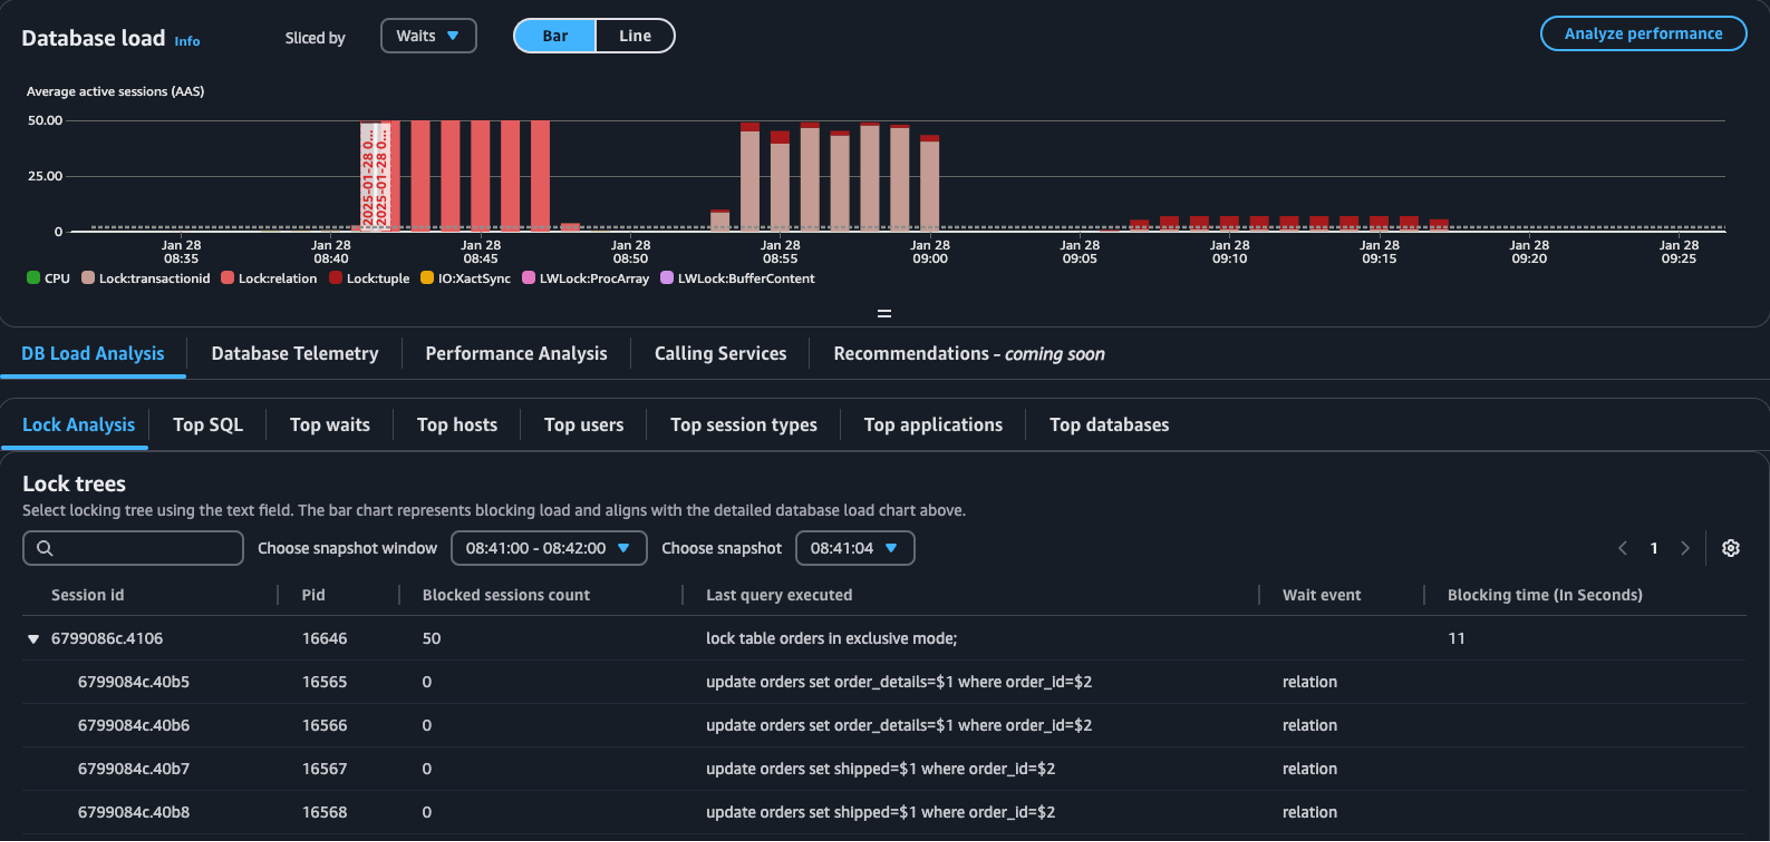
Lock analysis tab – Choose DB Load Analysis, then choose the Lock analysis tab to view information about lock contention in your database.
Note
CloudWatch Database Insights supports lock analysis for all Aurora PostgreSQL versions. To analyze lock trees, you must have Database Insights Advance Mode enabled. For information on how to turn on Advanced mode, see Turning on the Advanced mode of Database Insights for Amazon Aurora and Turning on the Advanced mode of Database Insights for Amazon Relational Database Service
The lock analysis tab provides information about lock contention for your database. The lock tree visualization shows the relationships and dependencies between lock requests from different sessions.
Database Insights captures snapshots every 15 seconds. Snapshots show the lock data for your database at a point in time.
Note
When CloudWatch detects high locking, CloudWatch displays the High locking detected banner for the Lock analysis tab. CloudWatch detects high locking if CloudWatch takes a lock snapshot for each 15 second interval for 15 consecutive minutes.
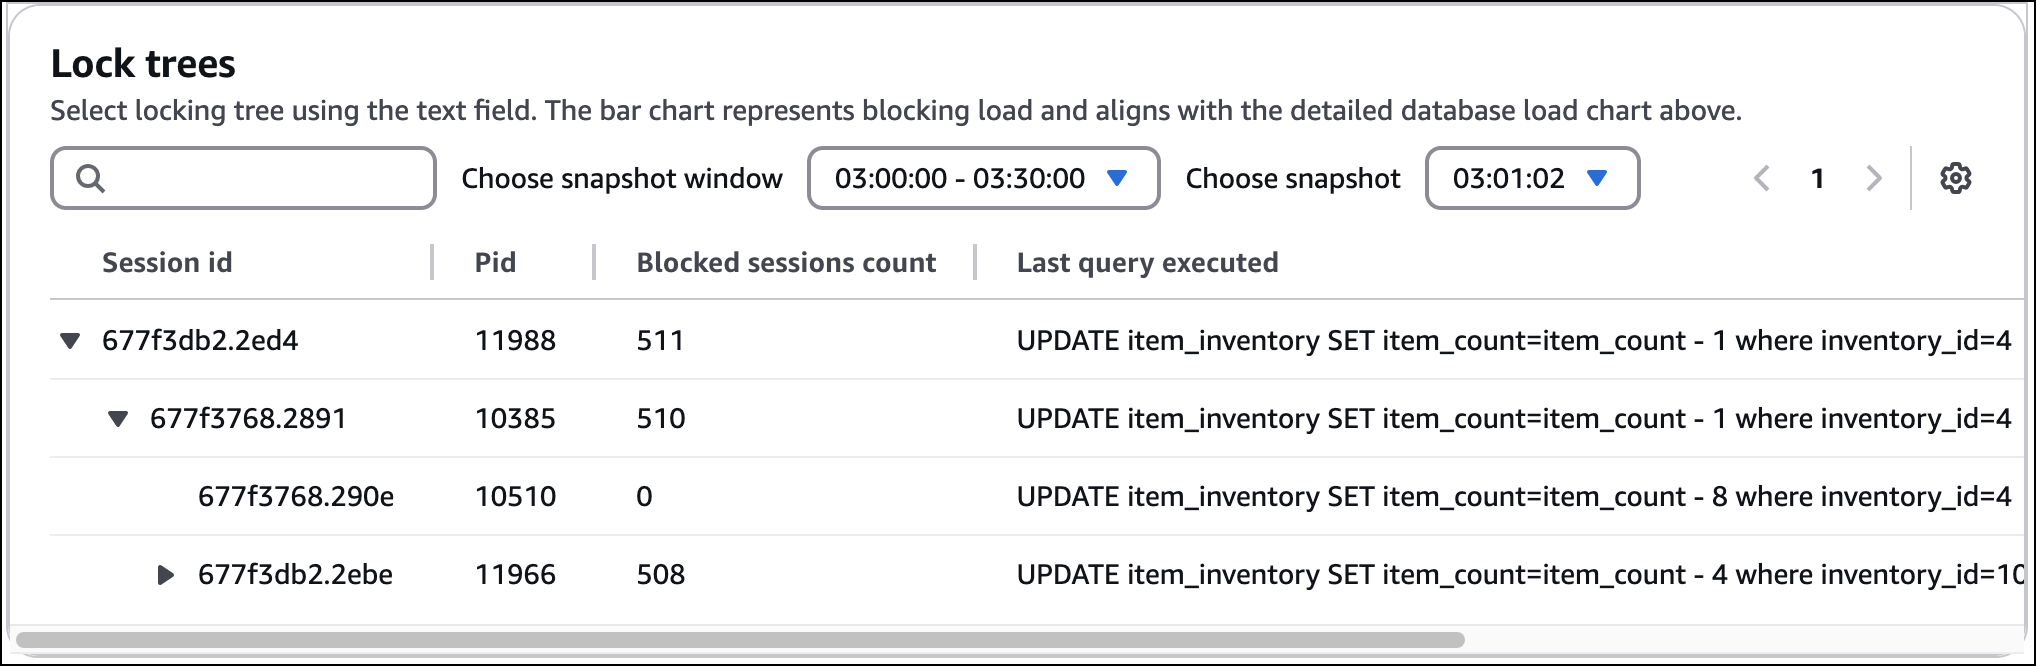
Each node in the tree represents a specific session. The parent node is a session that is blocking its child nodes.
To analyze lock trees, use the following procedure.
To analyze lock trees
Sign in to the Amazon Web Services Management Console and open the CloudWatch console at https://console.amazonaws.cn/cloudwatch/
. Choose Insights.
Choose Database Insights.
Choose the Database Instance view.
Choose a DB instance.
Choose the DB load analysis tab.
Choose the Lock analysis tab.
To view lock data for a DB instance, choose a period of 1 day or less.
Choose a snapshot window. By default, Database Insights chooses the snapshot window with the most blocked sessions.
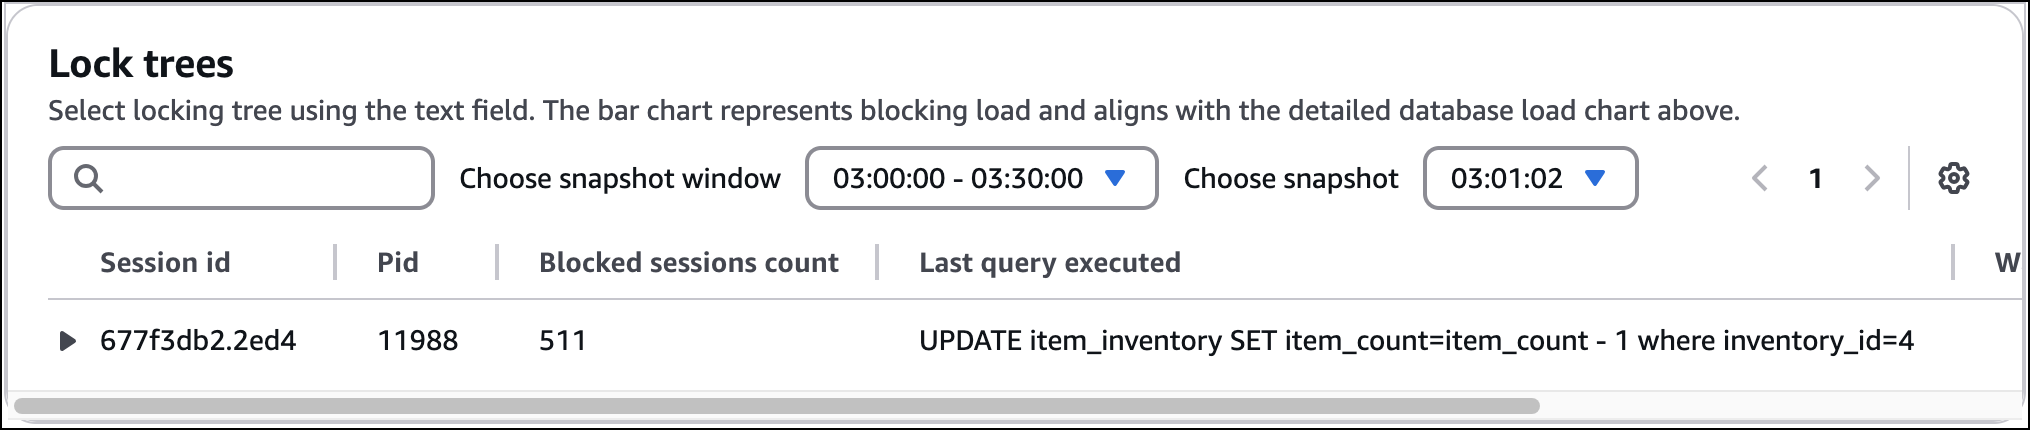
To view lock data for a snapshot, choose the time Database Insights took the snapshot.
To expand a lock tree, choose the arrow next to the session ID.
Lock snapshot data
Database Insights provides the following information for each lock request. To view columns that aren't enabled by default, choose the Settings icon for the Lock trees table and enable other columns.
| Column name | Definition | Default column | Notes |
|---|---|---|---|
|
|
The unique session identifier. |
Yes |
The |
|
|
The PID of this backend. |
Yes |
|
|
|
The number of sessions blocked by this lock. |
Yes |
The |
|
|
The last query executed by this session. For blockers, it may not be the query that holds the blocking lock. |
Yes |
|
|
|
The wait event name if the backend is currently waiting, otherwise the value is NULL. |
Yes |
|
|
|
The time (in seconds) since the start of this lock. |
Yes |
The |
|
|
The lock mode held by the blocking session. |
No |
|
|
|
The lock mode requested by the waiting session. |
No |
|
|
|
The name of the application that is connected to this backend. |
No |
|
|
|
The start time of the blocking transaction or null if no transaction is active. |
No |
|
|
|
The time when a waiting user session started waiting for this lock, or null if the lock is held. |
No |
|
|
|
The time when a user session was started. |
No |
|
|
|
The state of a backend. |
No |
|
|
|
The type of wait event for which this session is waiting. |
No |
|
|
|
The time when the last query was started. |
No |
|
|
|
The name of the user logged into this backend. |
No |
|
|
|
The host name of the connected client, as reported by a reverse DNS lookup of
|
No |
|
|
|
The TCP port number that the client is using for communication with this backend, or |
No |
|
|
|
The IP address of the client connected to this backend. If this field is null, it indicates either that the client is connected via a Unix socket on the server machine or that this is an internal process such as autovacuum. |
No |
|
|
|
The value is true if lock is held and false if lock is awaited. |
No |
|
|
|
The tuple number targeted by the lock within the page, or null if the target is not a tuple. |
No |
|
|
|
The page number targeted by the lock within the relation, or null if the target is not a relation page or tuple. |
No |
|
|
|
The ID of the transaction targeted by the lock, or null if the target is not a transaction ID. |
No |
|
|
|
The OID of the relation targeted by the lock, or null if the target is not a relation or part of a relation. |
No |
|
|
|
The OID of the lock target within its system catalog, or null if the target is not a general database object. |
No |
|
|
|
The OID of the database in which the lock target exists, or zero if the target is a shared object, or null if the target is a transaction ID. |
No |
|
|
|
The name of the database in which the lock target exists. |
No |
|
|
|
The type of the lockable object: relation, extend, frozenid, page, tuple, transactionid, virtualxid, spectoken, object, userlock, advisory, or applytransaction. |
No |
|
|
|
The value is true if the lock was taken with the fast path and false if taken from the main lock table. |
No |
|
For more information about the values in the pg_stat_activity and pg_locks views, see the following topics in the PostgreSQL documentation.