# SageMaker AI Insights dashboard
The SageMaker AI Insights dashboard is organized into three tabs: **Performance**, **Capacity**, and **Reliability**. Each tab provides a focused view of your inference endpoint health.
## Dashboard layout
### Summary bar
The summary bar at the top of the dashboard shows fleet‐wide totals.
| Metric | Description |
| --- | --- |
| Invocations | Total invocations across all endpoints in the selected time range |
| Instances | Total number of instances currently serving traffic |
| Inference Components | Total number of inference components across all endpoints |
| Avg AZ Skew | Average availability zone distribution imbalance (0% = perfectly balanced) |
### Filters panel
| Filter | Description |
| --- | --- |
| Endpoint | Select a specific endpoint or All endpoints for the fleet view |
| Instance | Select a specific instance (requires an endpoint selected first) |
| Inference component | Select a specific IC for granular filtering |
### Drill-down
SageMaker AI Insights supports progressive drill‐down.
1. **Fleet level** (default)—all endpoints visible, summary metrics aggregated
1. **Endpoint level**—select an endpoint from the filter panel or choose an endpoint link in any table
1. **IC level**—select an inference component from the filter panel
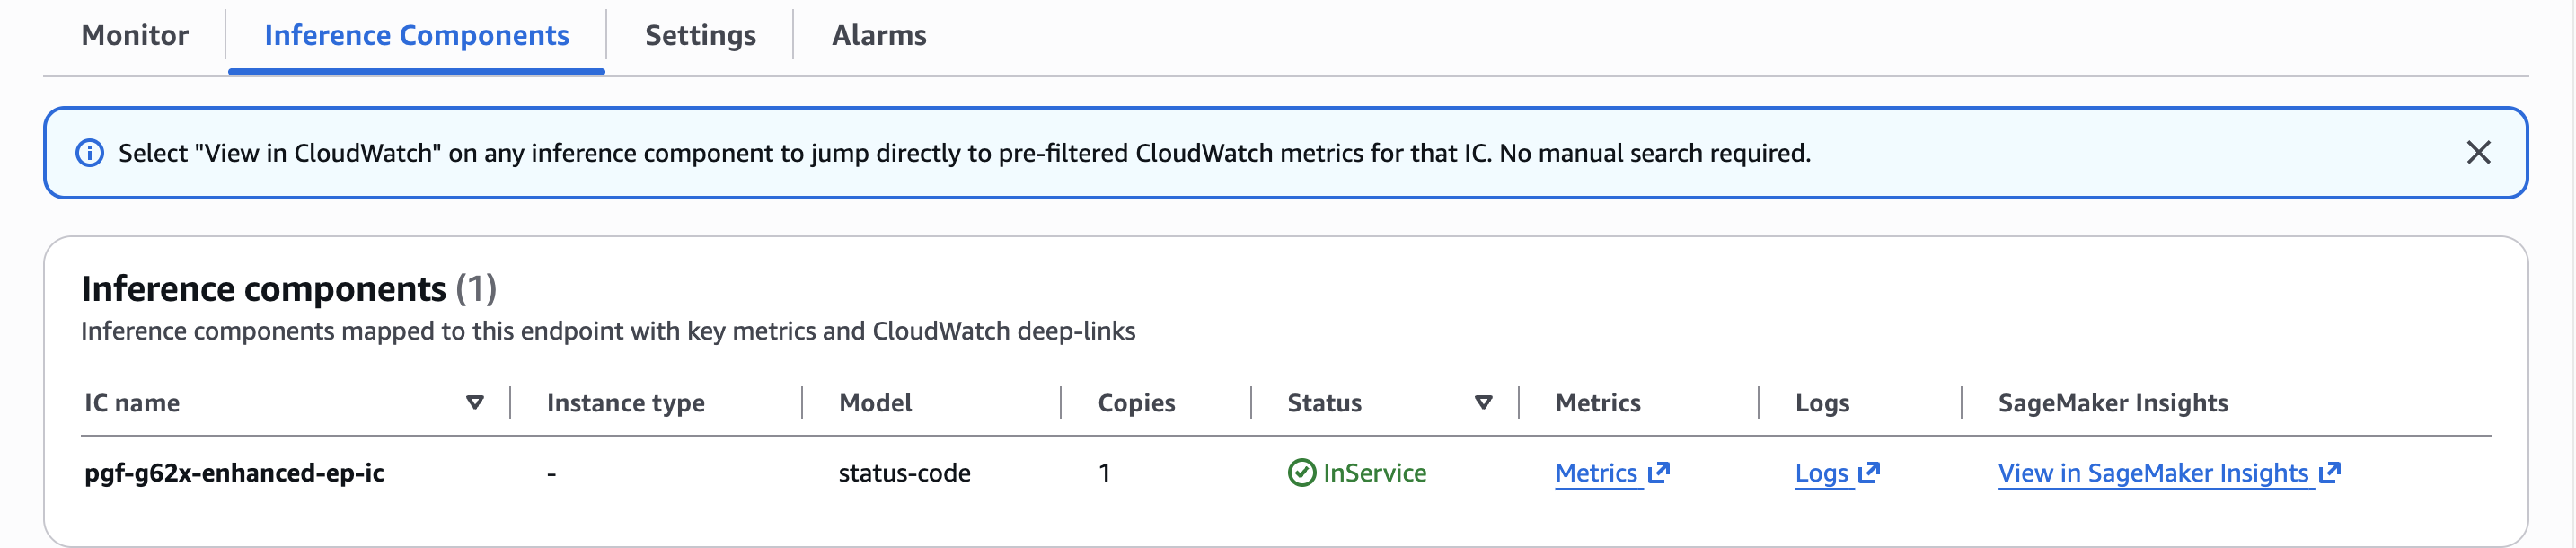
### Cross-linking with the SageMaker AI console
+ Choose an endpoint name to open the endpoint detail page in the SageMaker AI console.
+ Choose **View logs** to open CloudWatch Logs filtered to that endpoint or IC.
+ From the SageMaker AI console, choose **View in SageMaker AI Insights** or **Metrics** for a per‐IC row.
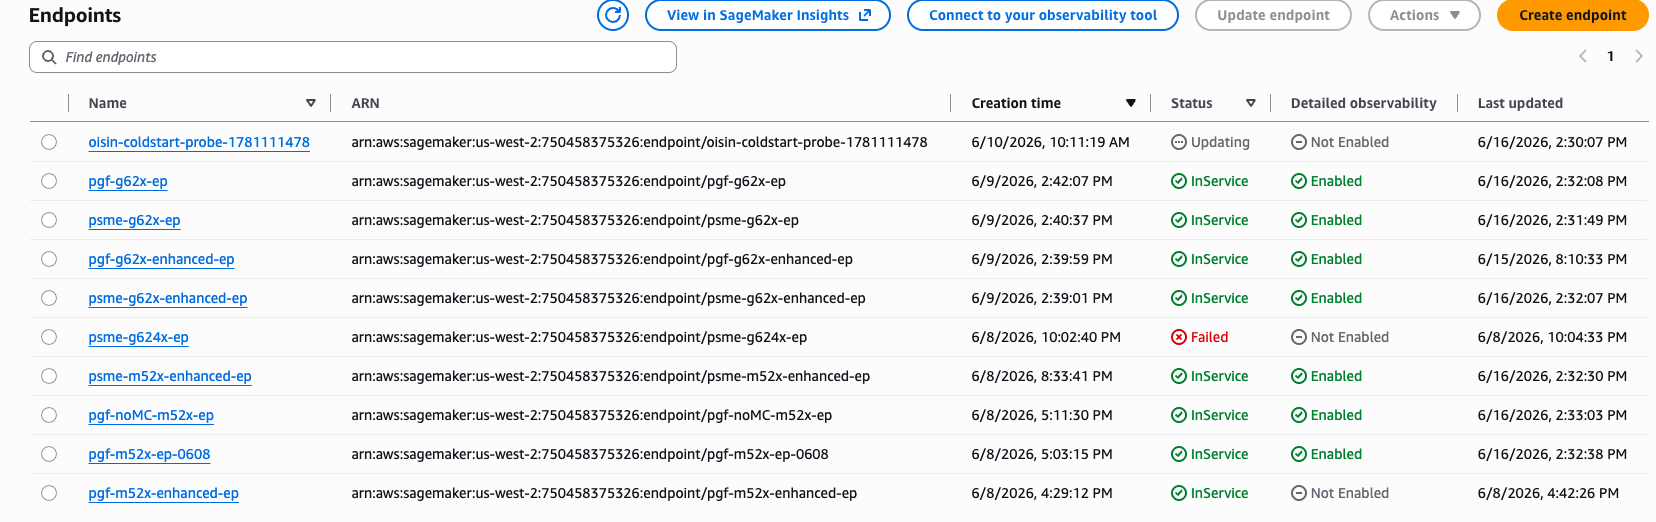
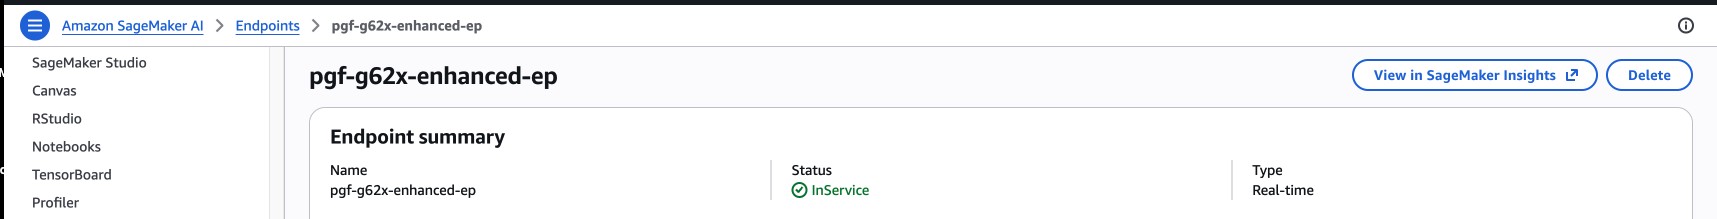
## Accessing the dashboard
You can access the SageMaker AI Insights dashboard from multiple locations in the console.
+ **From the Endpoints list page:** Choose **View in SageMaker AI Insights** to open the dashboard at the fleet level with no filters applied.
+ **From the endpoint detail page:** Choose **View in SageMaker AI Insights** to open the dashboard filtered to that endpoint.
+ **From the inference component detail page:** Choose **View in SageMaker AI Insights** to open the dashboard filtered to that endpoint and inference component.
+ **Direct navigation:** CloudWatch console → **Infrastructure monitoring** → **SageMaker AI Insights**.
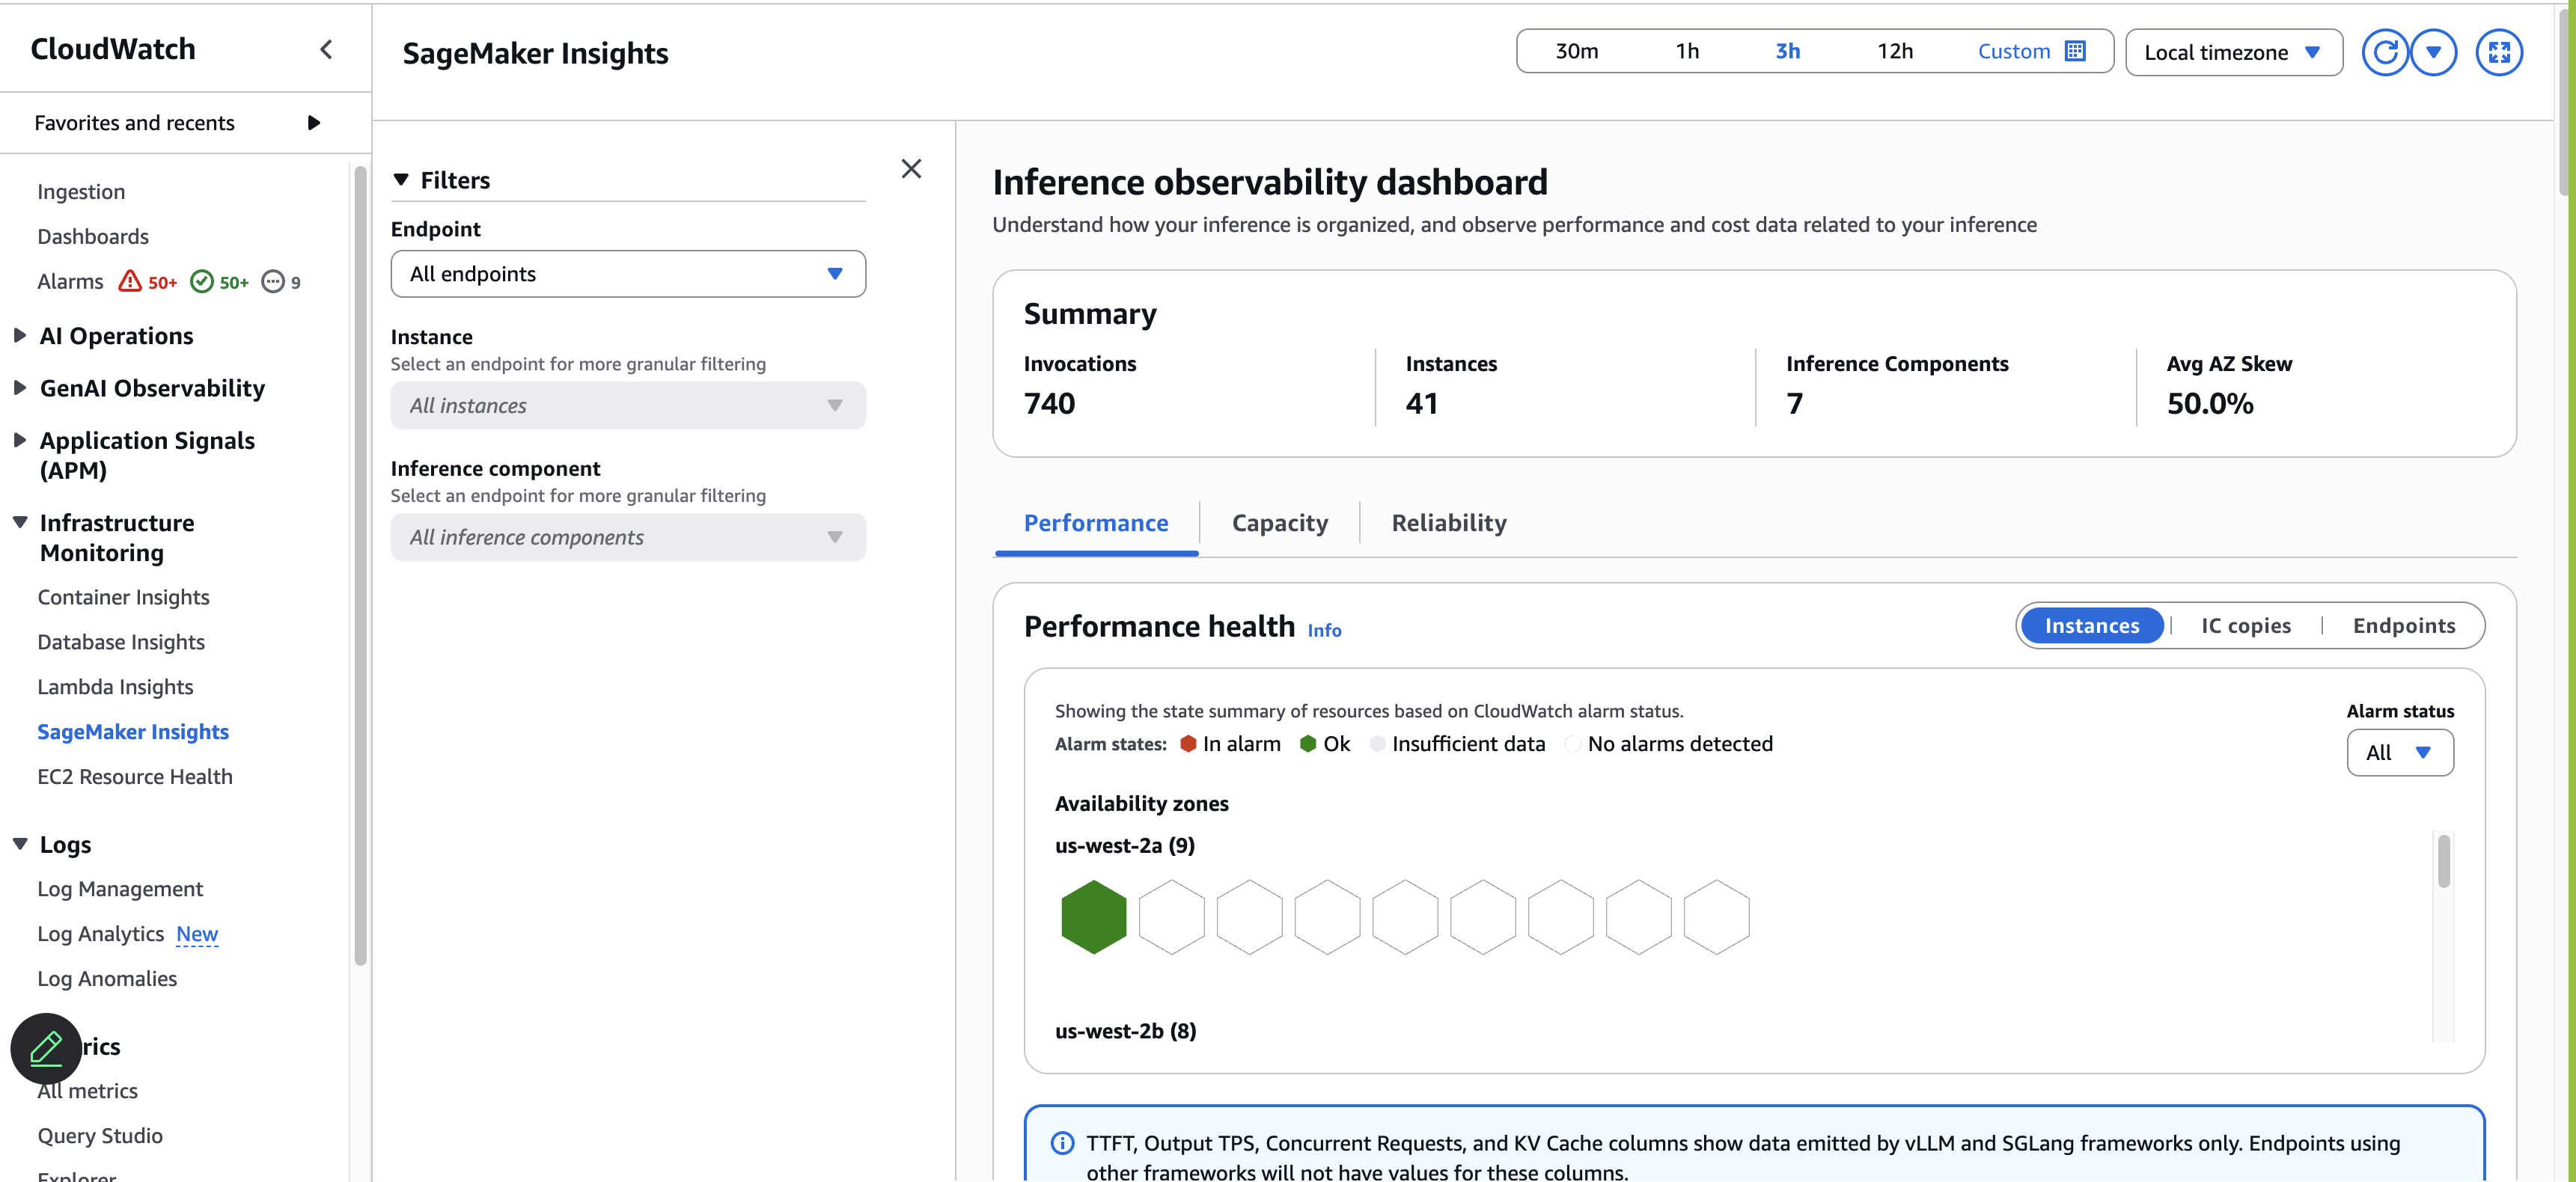
## Performance tab
The **Performance** tab answers "is it healthy?" and "why is it slow?"—flowing from fleet‐wide health at the top to per‐IC diagnostics at the bottom.
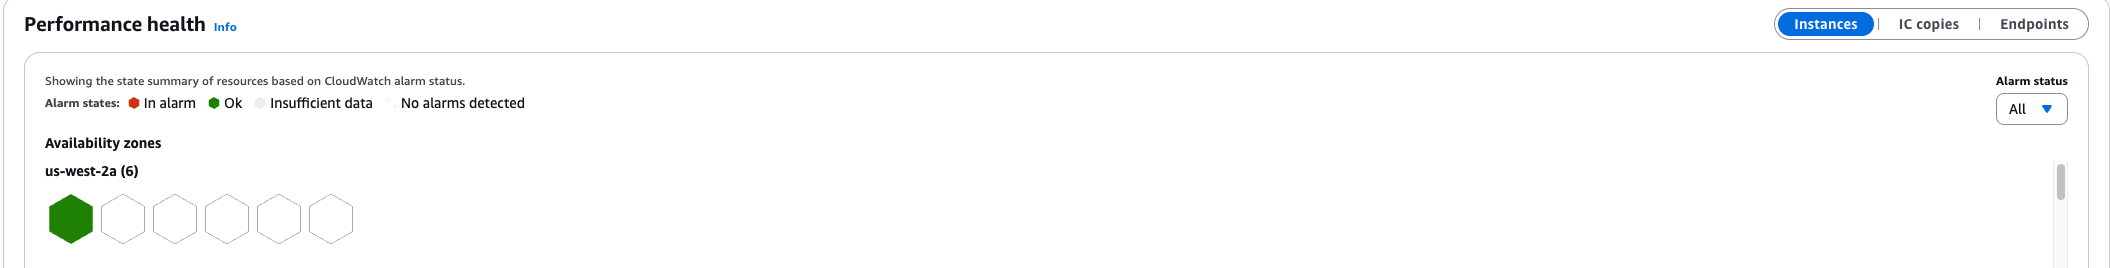
Performance health
Honeycombs grouped by AZ showing alarm state for instances, IC copies, and endpoints at a glance.
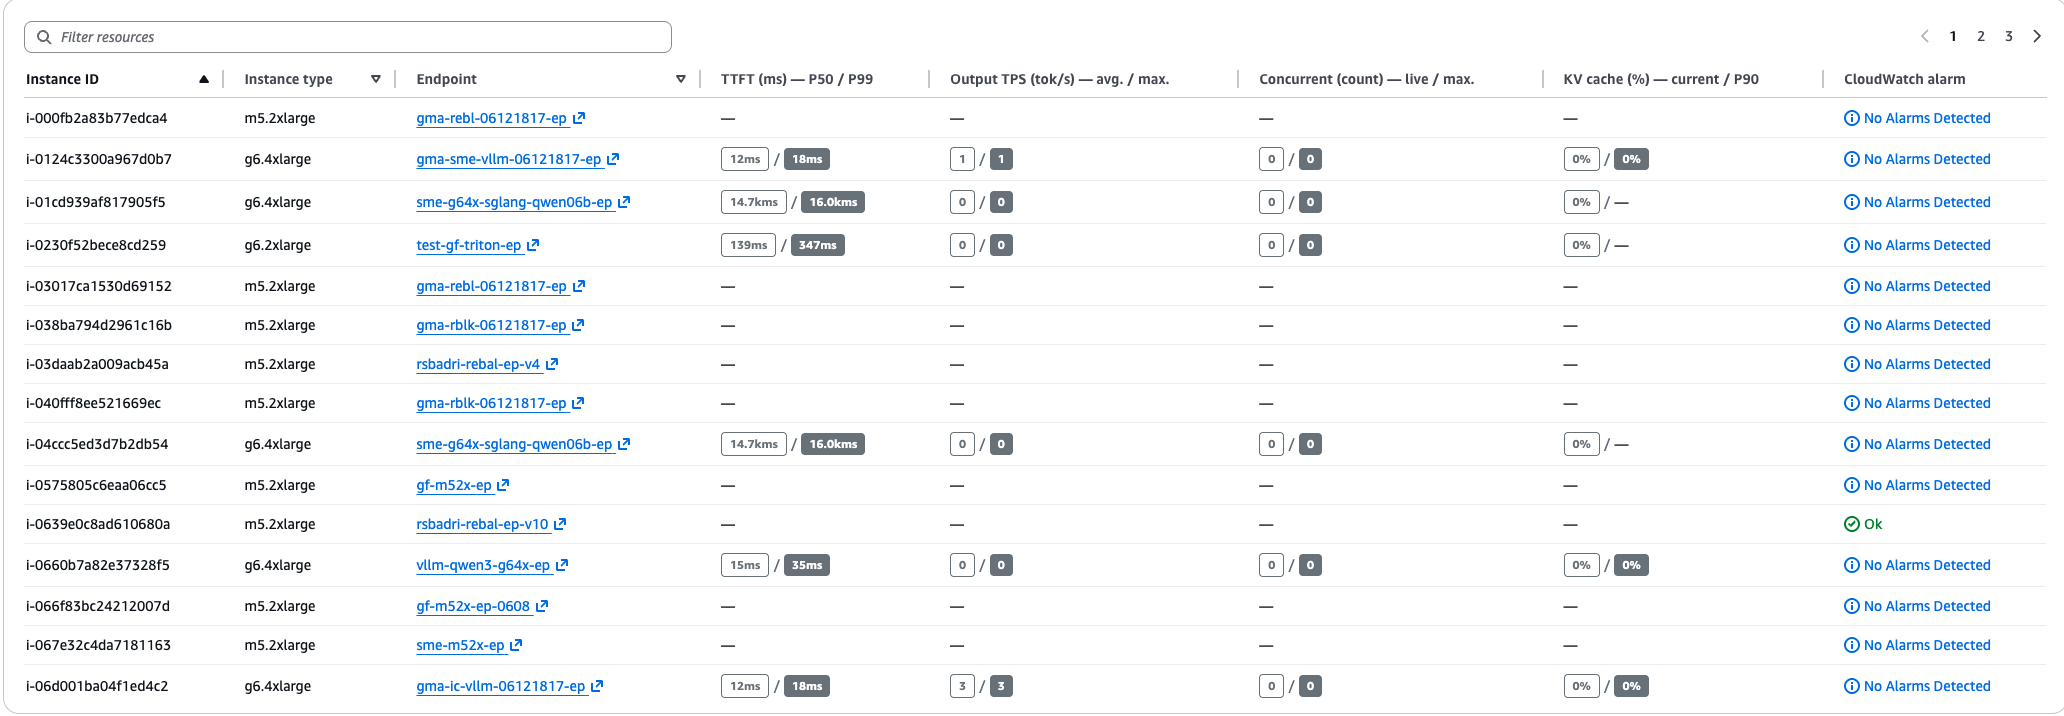
Instance performance table
Per‐instance breakdown showing TTFT (P50/P99), output TPS (avg/max), concurrent requests (live/max), and KV cache utilization.
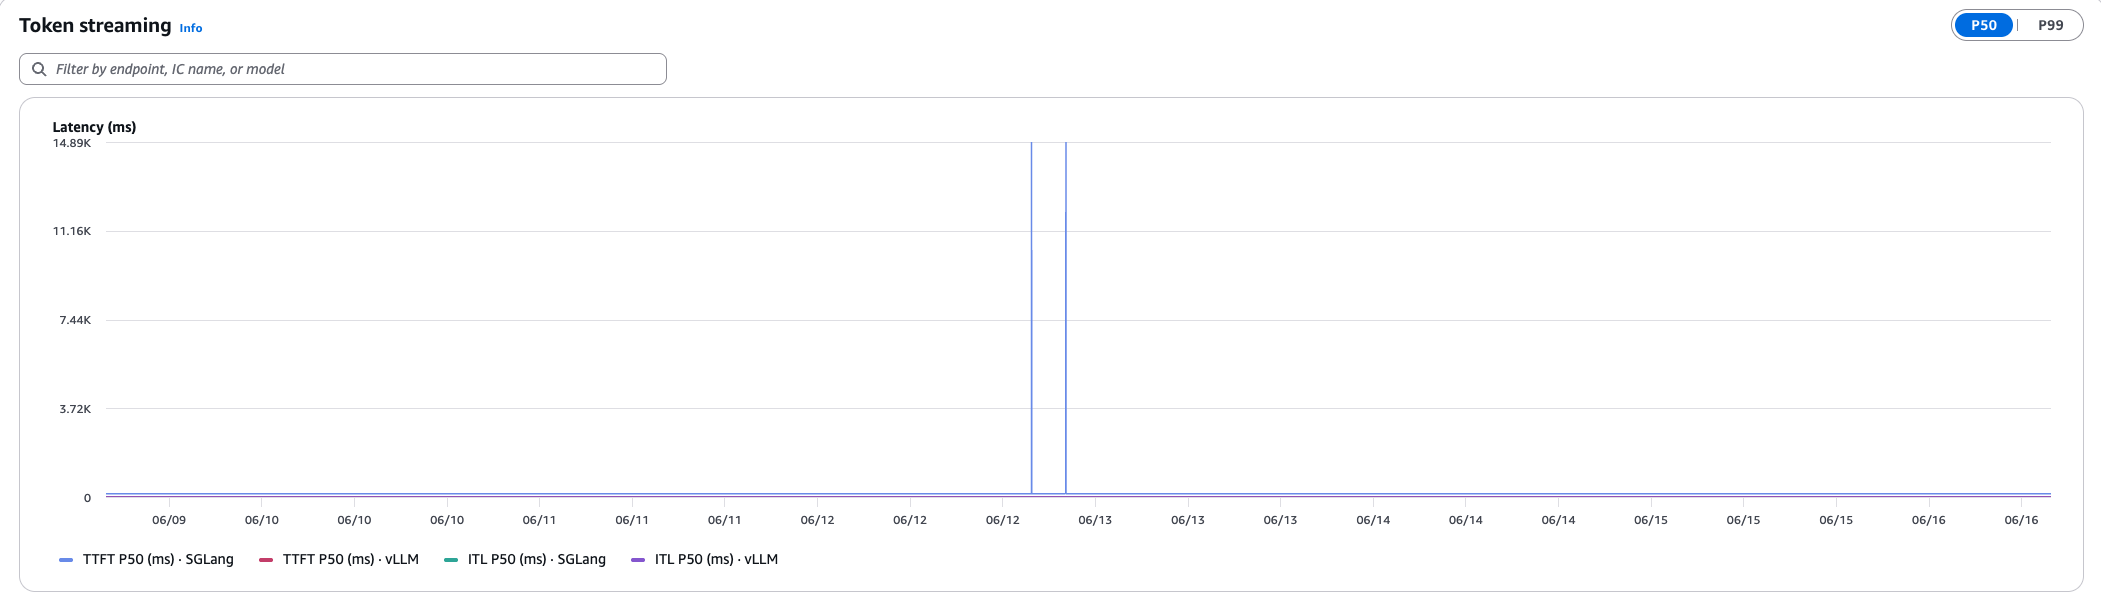
Token streaming
Time‐series chart showing TTFT and inter‐token latency (ITL) with a P50/P99 toggle, broken down by framework.
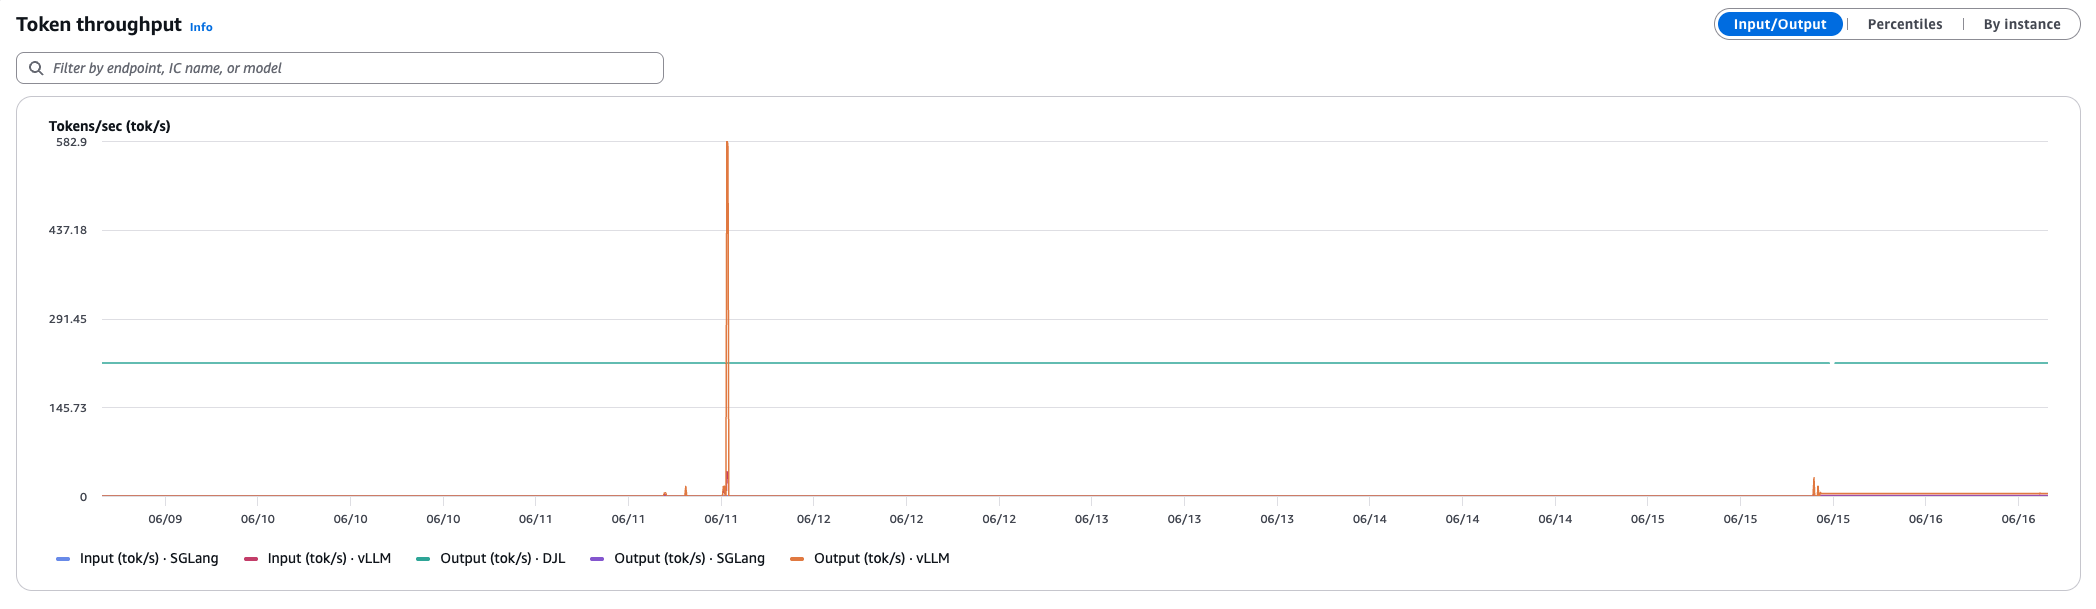
Token throughput
Input and output tokens per second by framework, with toggles for Input/Output, Percentiles, and By instance views.
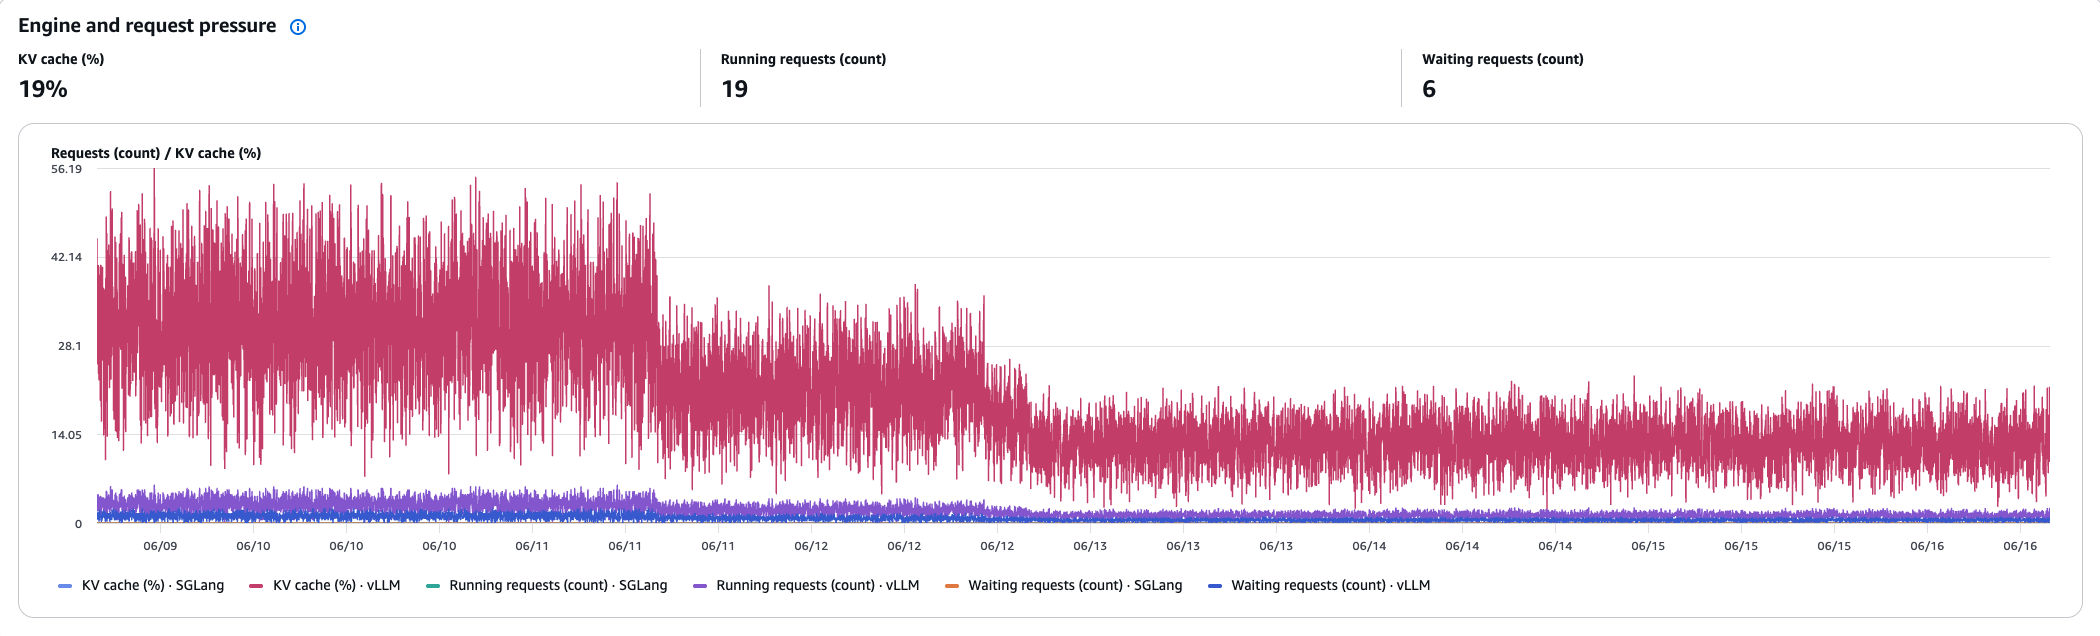
Engine and request pressure
KV cache utilization (%), running requests, and waiting requests over time—key saturation signals for the inference engine.
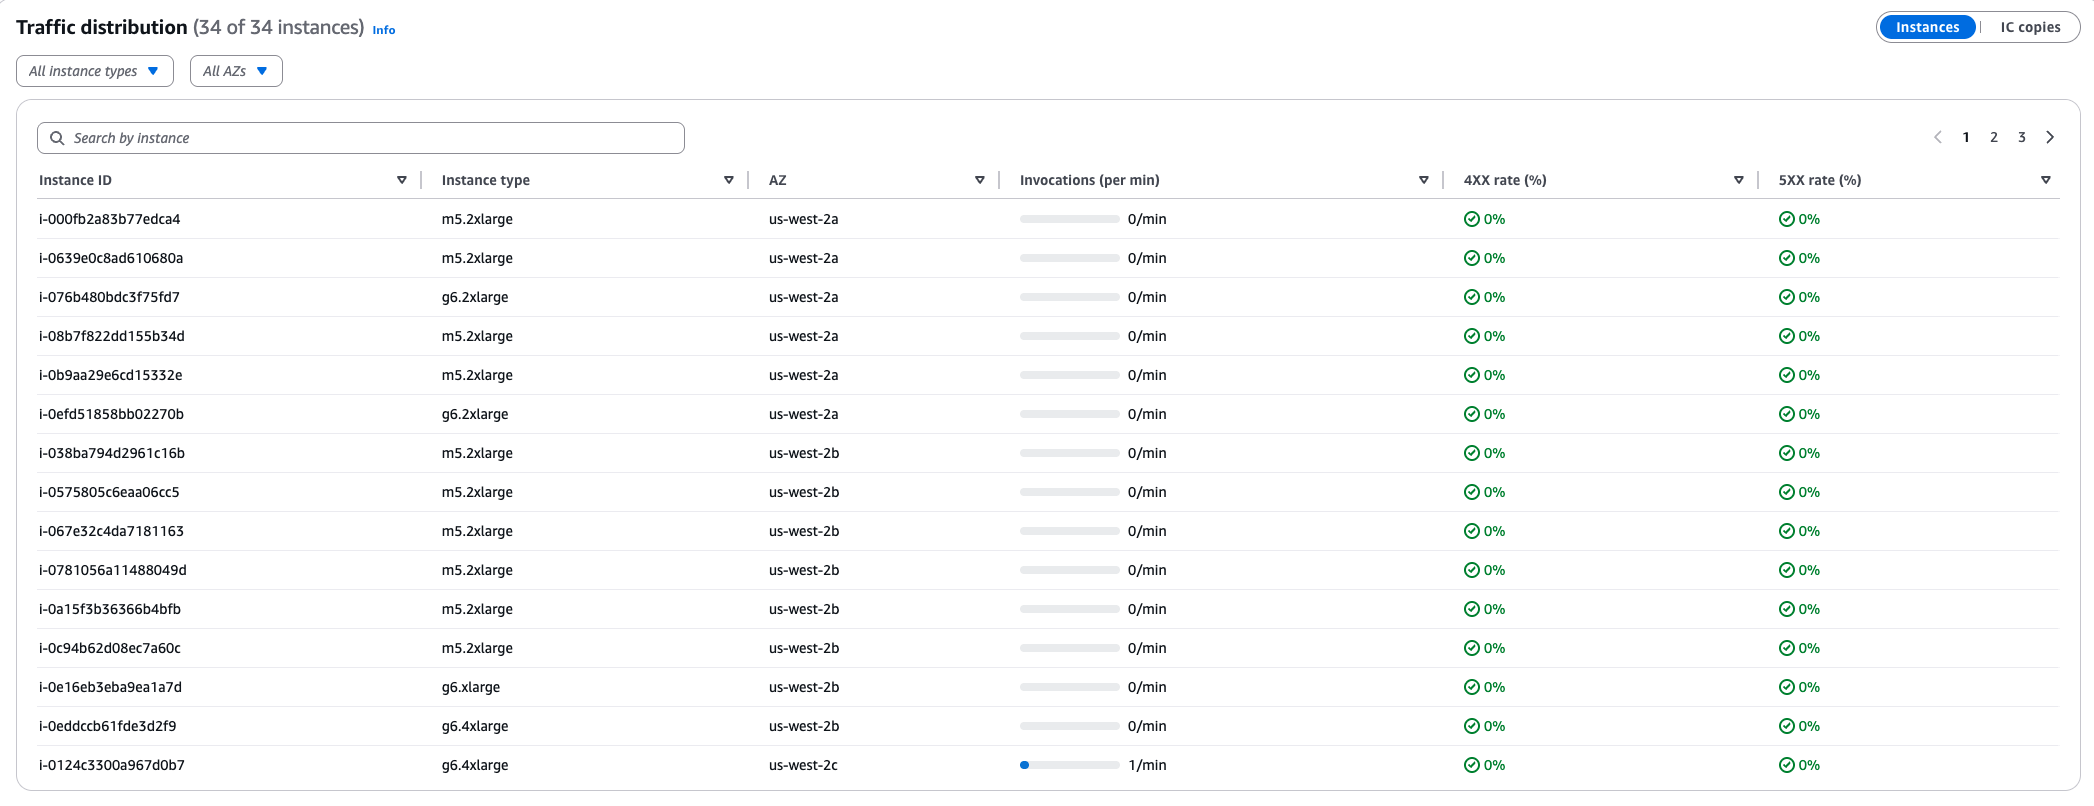
Traffic distribution
Per‐instance or per‐IC‐copy table showing invocations per minute, 4XX rate, and 5XX rate to identify routing imbalances.
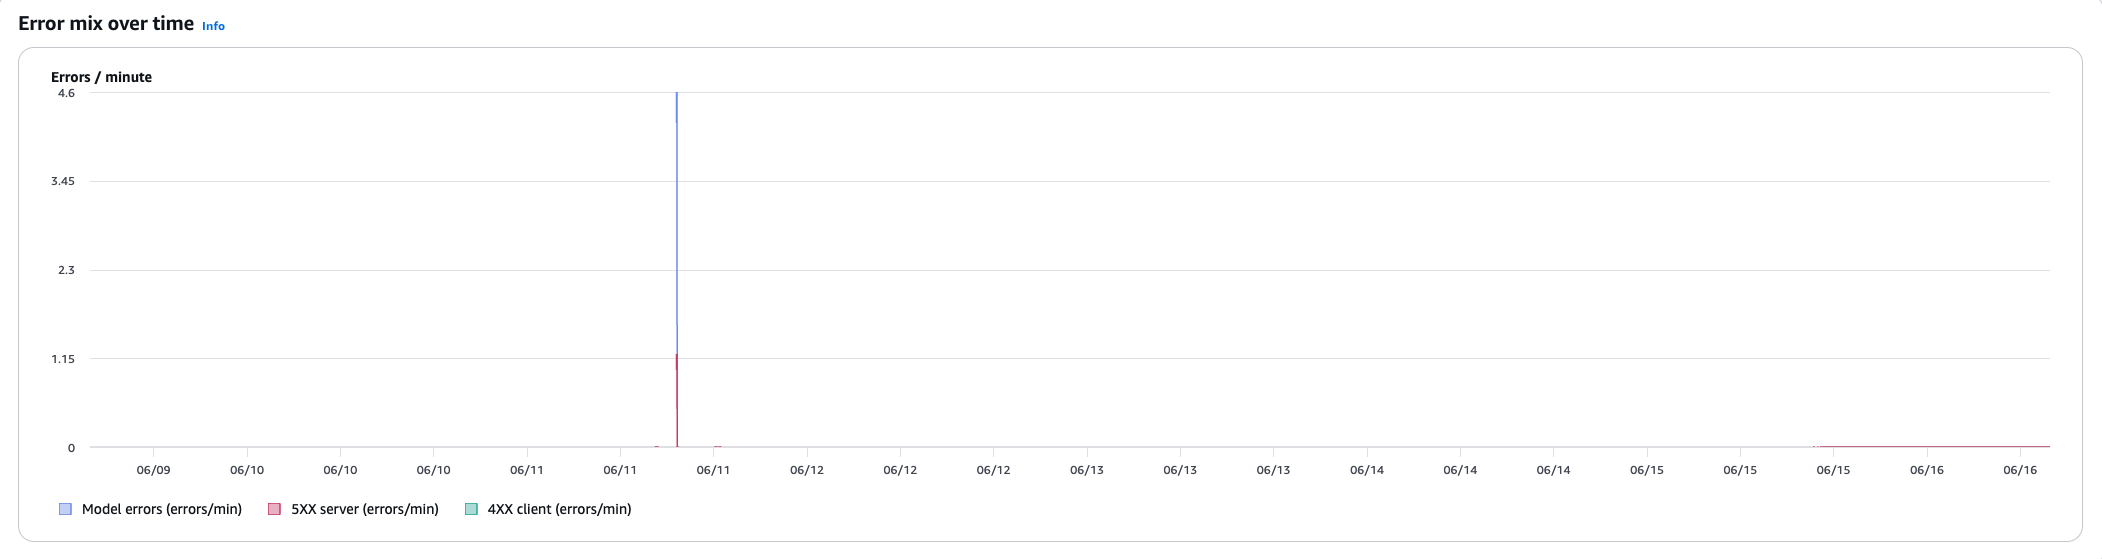
Error mix over time
Line chart showing 4XX, 5XX, and mid‐stream error rates over time per IC.
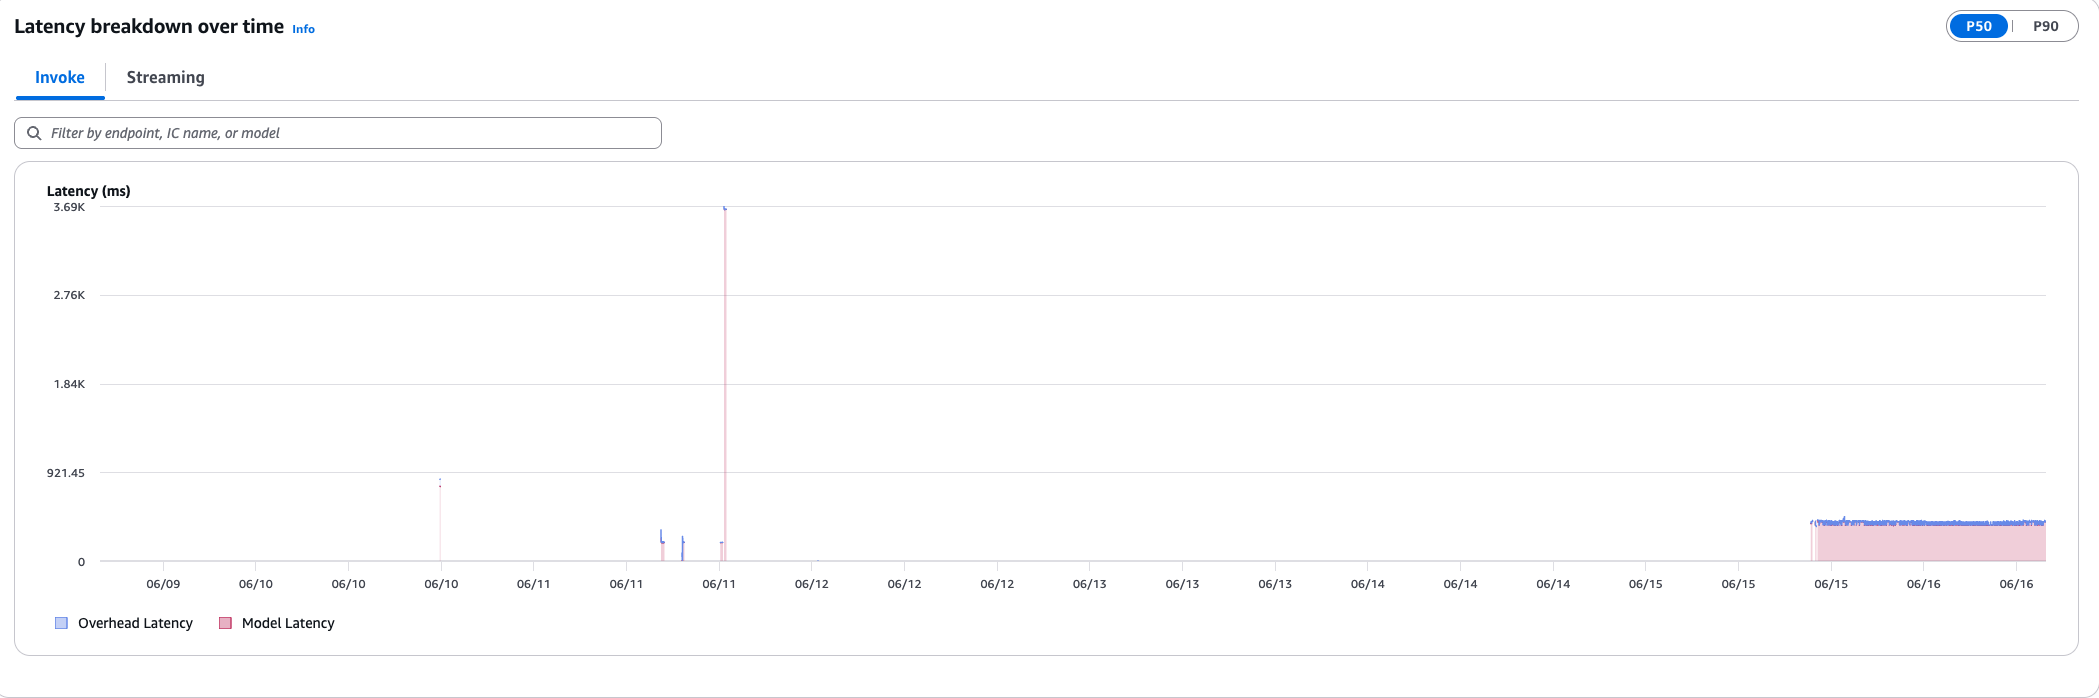
Latency breakdown over time
Stacked area chart with tabs for Invoke (model latency \+ overhead latency) and Streaming (first chunk model \+ first chunk overhead), with a P50/P90 toggle.
## Capacity tab
The **Capacity** tab answers "do I have headroom?" and "is my hardware healthy?"—showing actual utilization compared to reserved capacity.
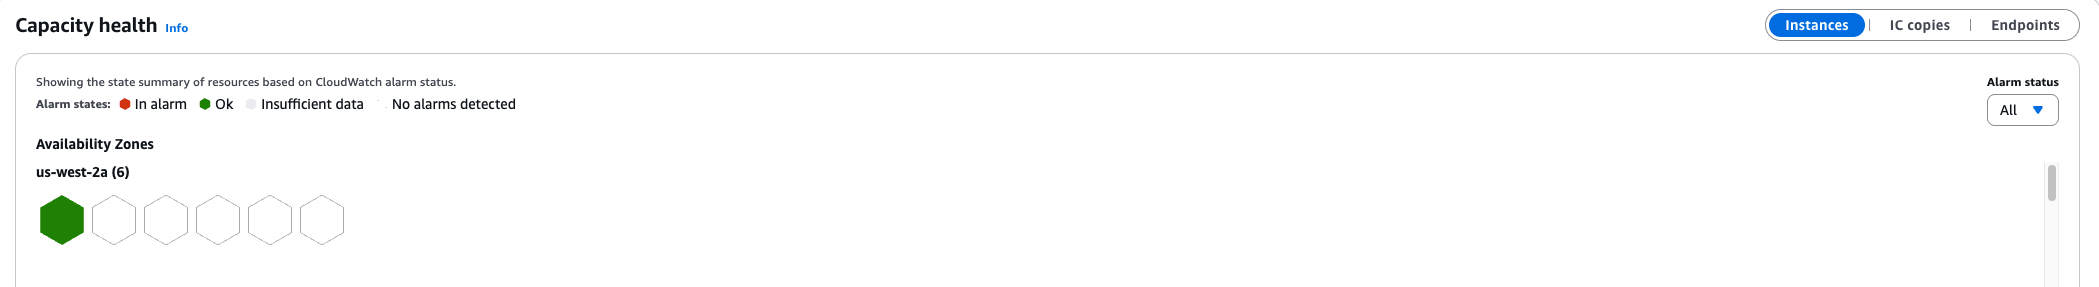
Capacity health
The same honeycomb visualization as the **Performance** tab, showing alarm state for instances, IC copies, and endpoints.
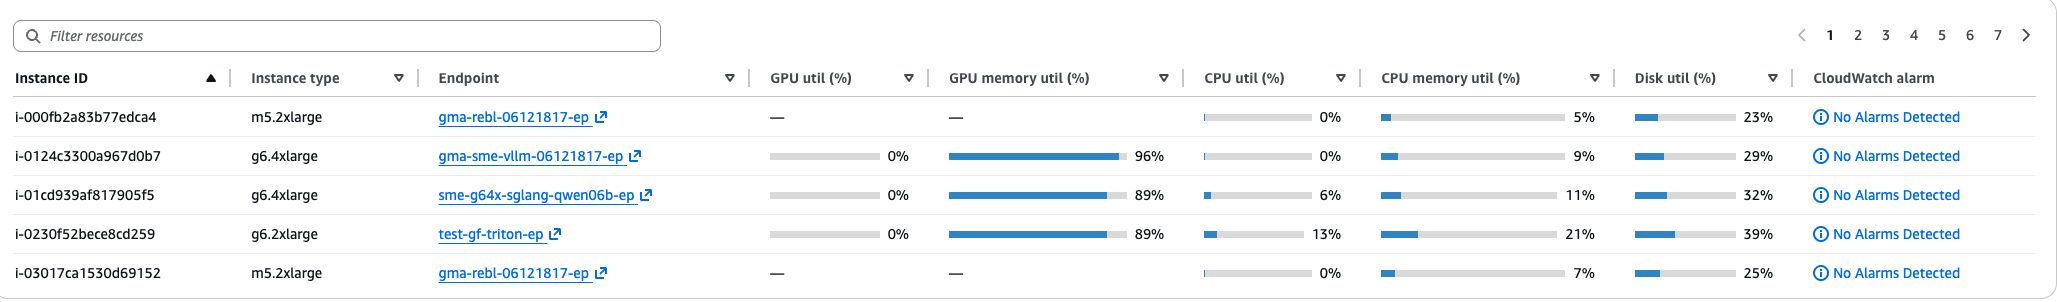
Instance capacity table
Per‐instance utilization bars for GPU, GPU memory, CPU, memory, and disk.
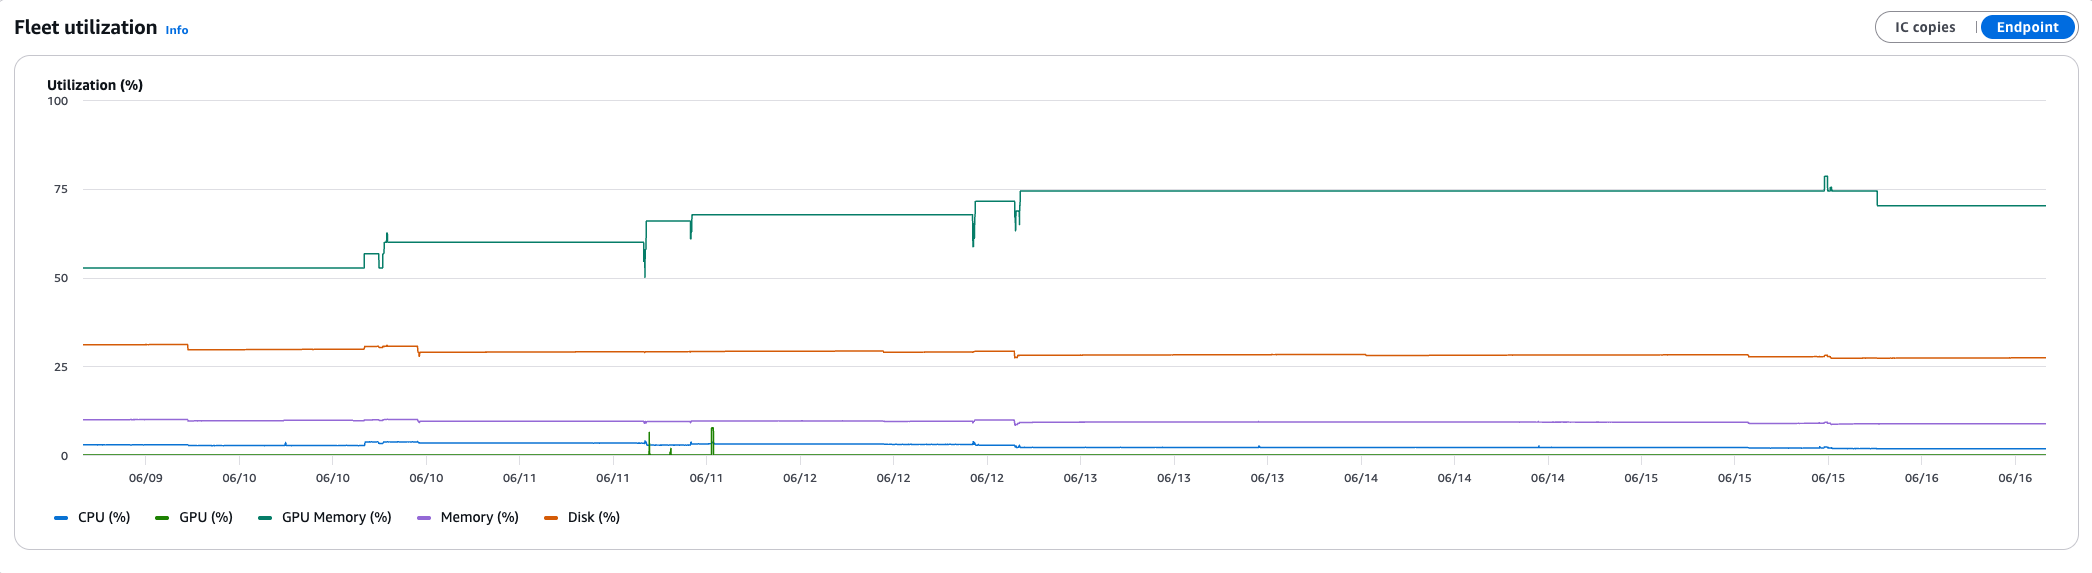
Fleet utilization
Time‐series showing CPU, GPU, GPU memory, memory, and disk utilization per instance, with toggles for Instance, IC copies, and Endpoint views.
## Reliability tab
The **Reliability** tab answers "is it resilient?" and "why did scaling fail?"—covering AZ distribution, scaling behavior, and provisioning events.
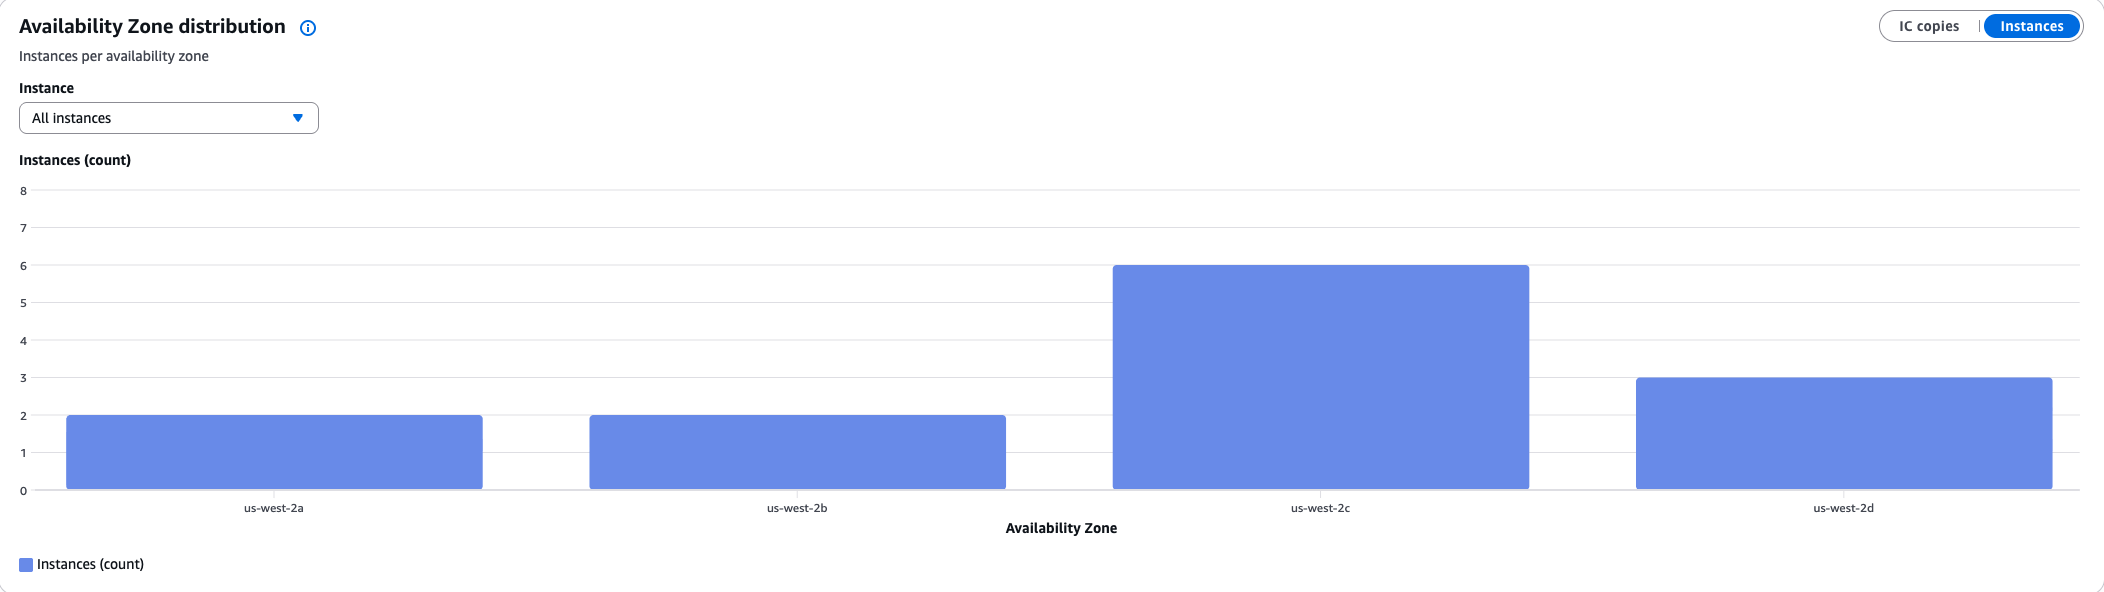
Availability Zone distribution
Bar chart showing instance or IC copy count per AZ to validate high availability (HA) compliance.
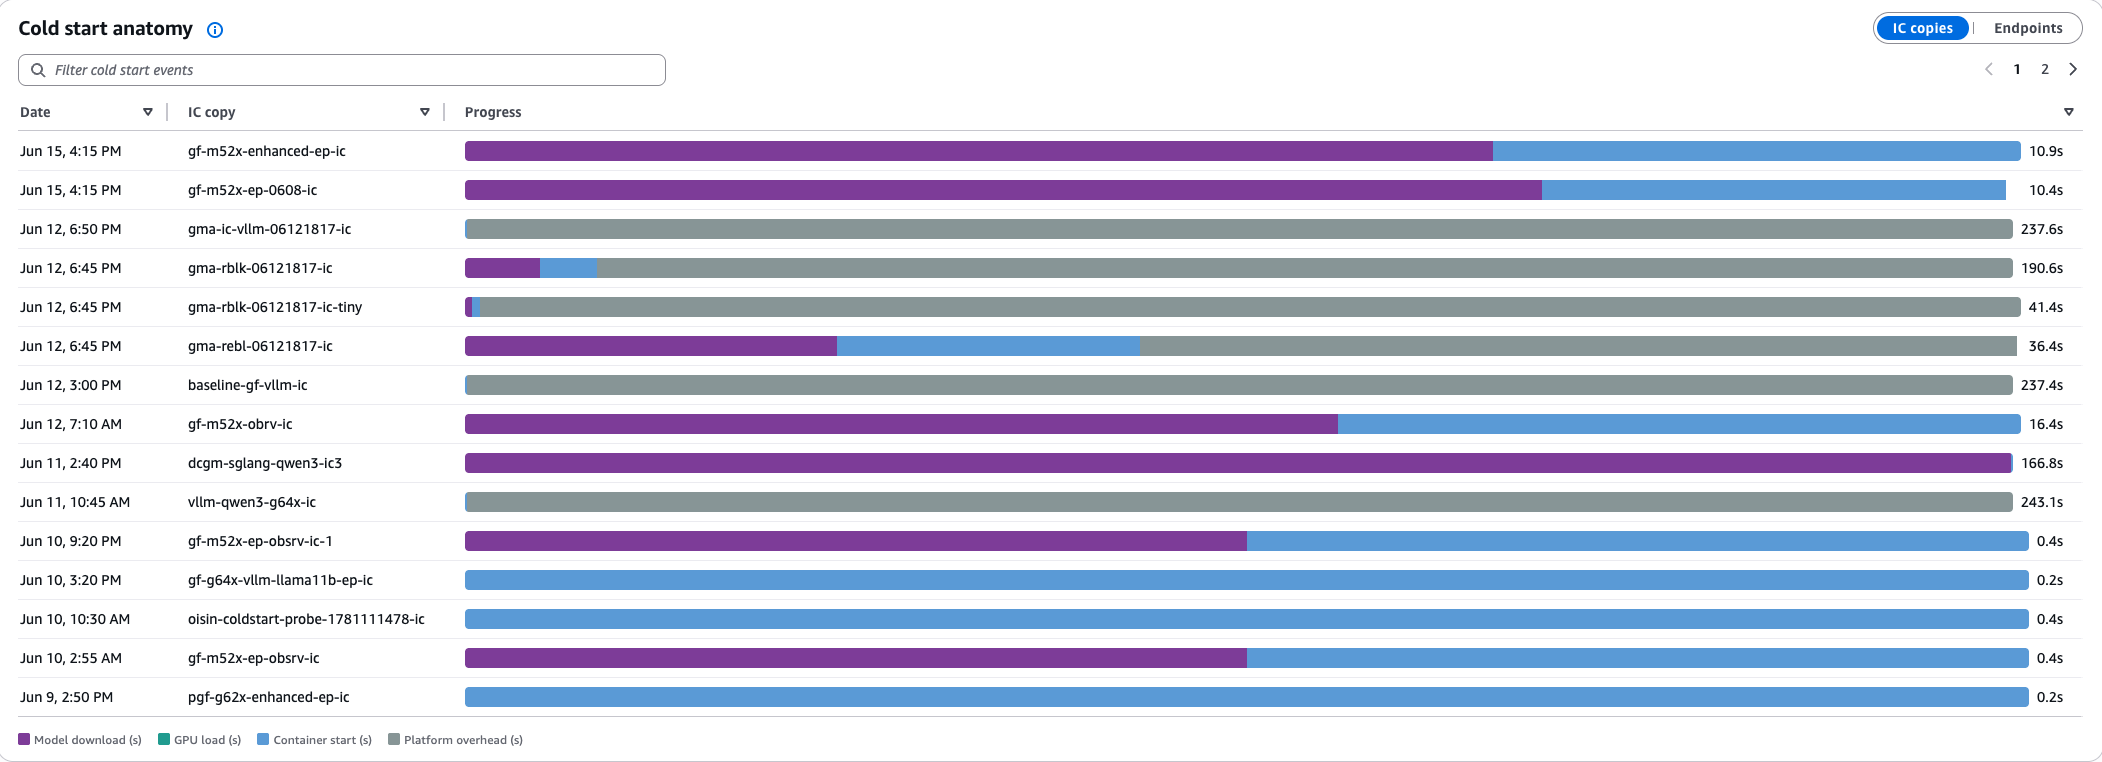
Cold start anatomy
Horizontal stacked bar showing the breakdown of provisioning time into model download, GPU load, container start, and platform overhead (IC endpoints only).
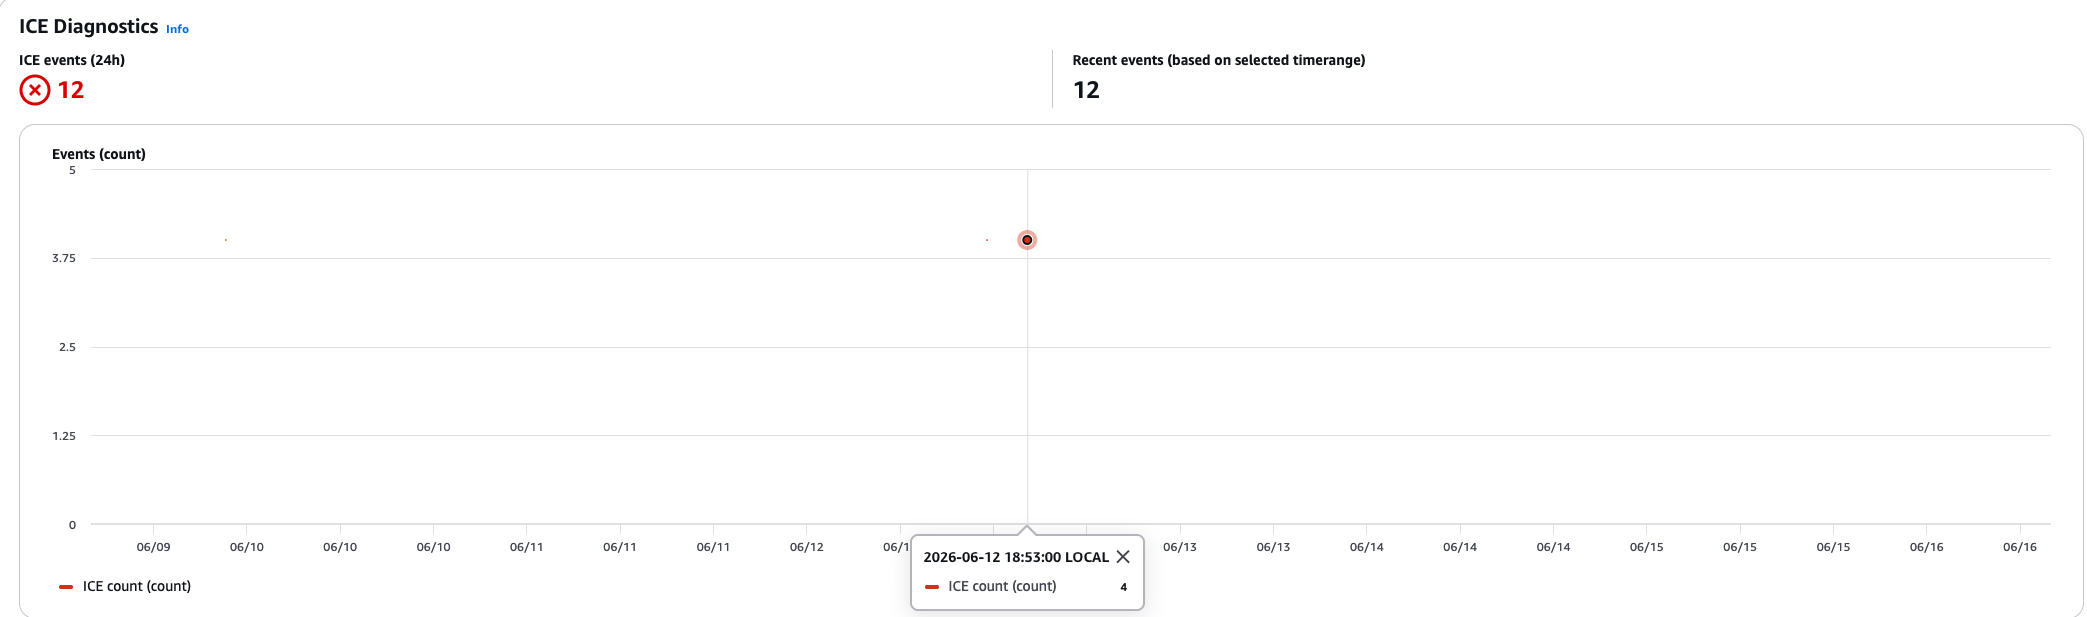
ICE diagnostics
Insufficient Capacity Error (ICE) count over time with an event table showing time, endpoint, failed instance type, and failed AZ. Non‐zero values indicate capacity constraints.