Example: Use Application Signals to resolve an operational health issue
The following scenario provides an example of how Application Signals can be used to monitor your services and identify service quality issues. Drill down to identify potential root causes and take action to resolve the issue. This example is focused on a pet clinic application composed of several microservices that call Amazon Web Services services such as DynamoDB.
Jane is part of a DevOps team that oversees the operational health of a pet clinic application. Jane's team is committed to ensuring that the application is highly available and responsive. They use service level objectives (SLOs) to measure application performance against these business commitments. She receives an alert about several unhealthy service level indicators (SLIs). She opens the CloudWatch console and navigates to the Services page, where she sees several services in an unhealthy state.
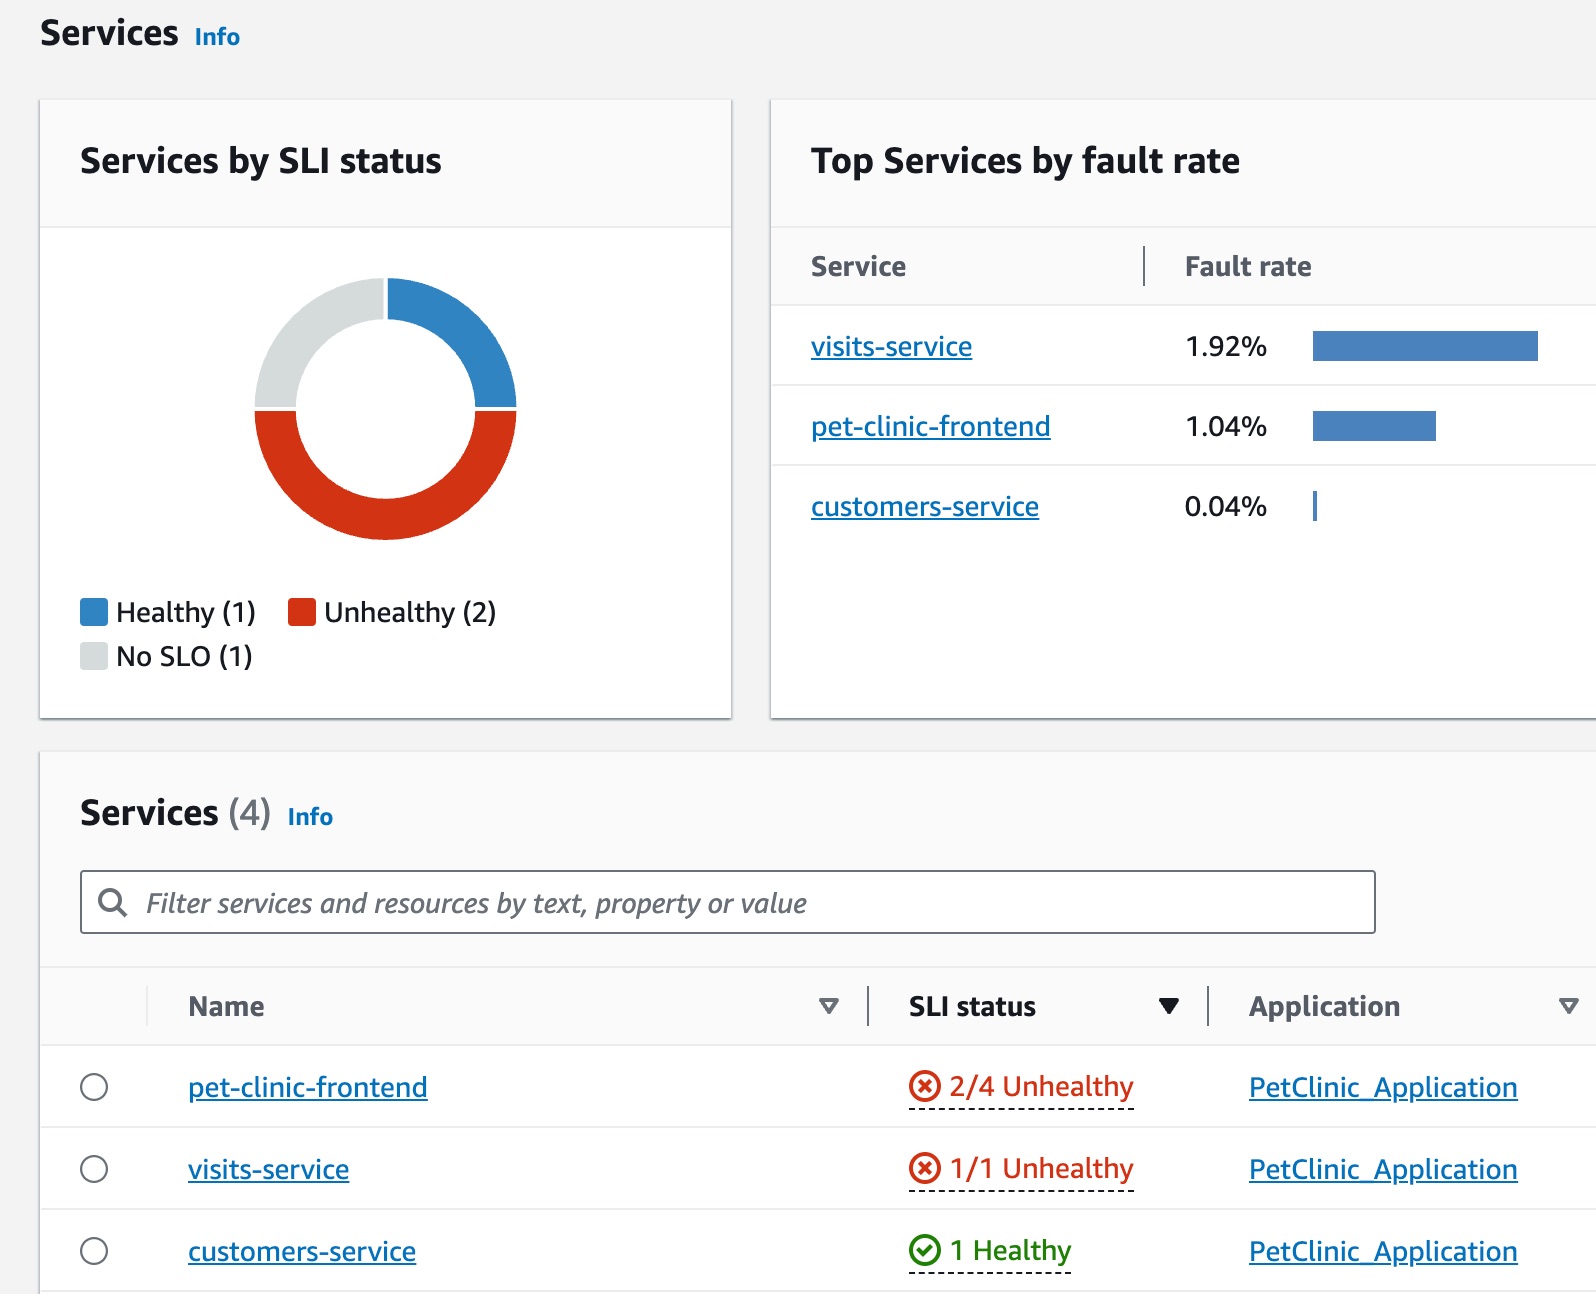
At the top of the page, Jane sees that the visits-service is the top service by fault rate. She
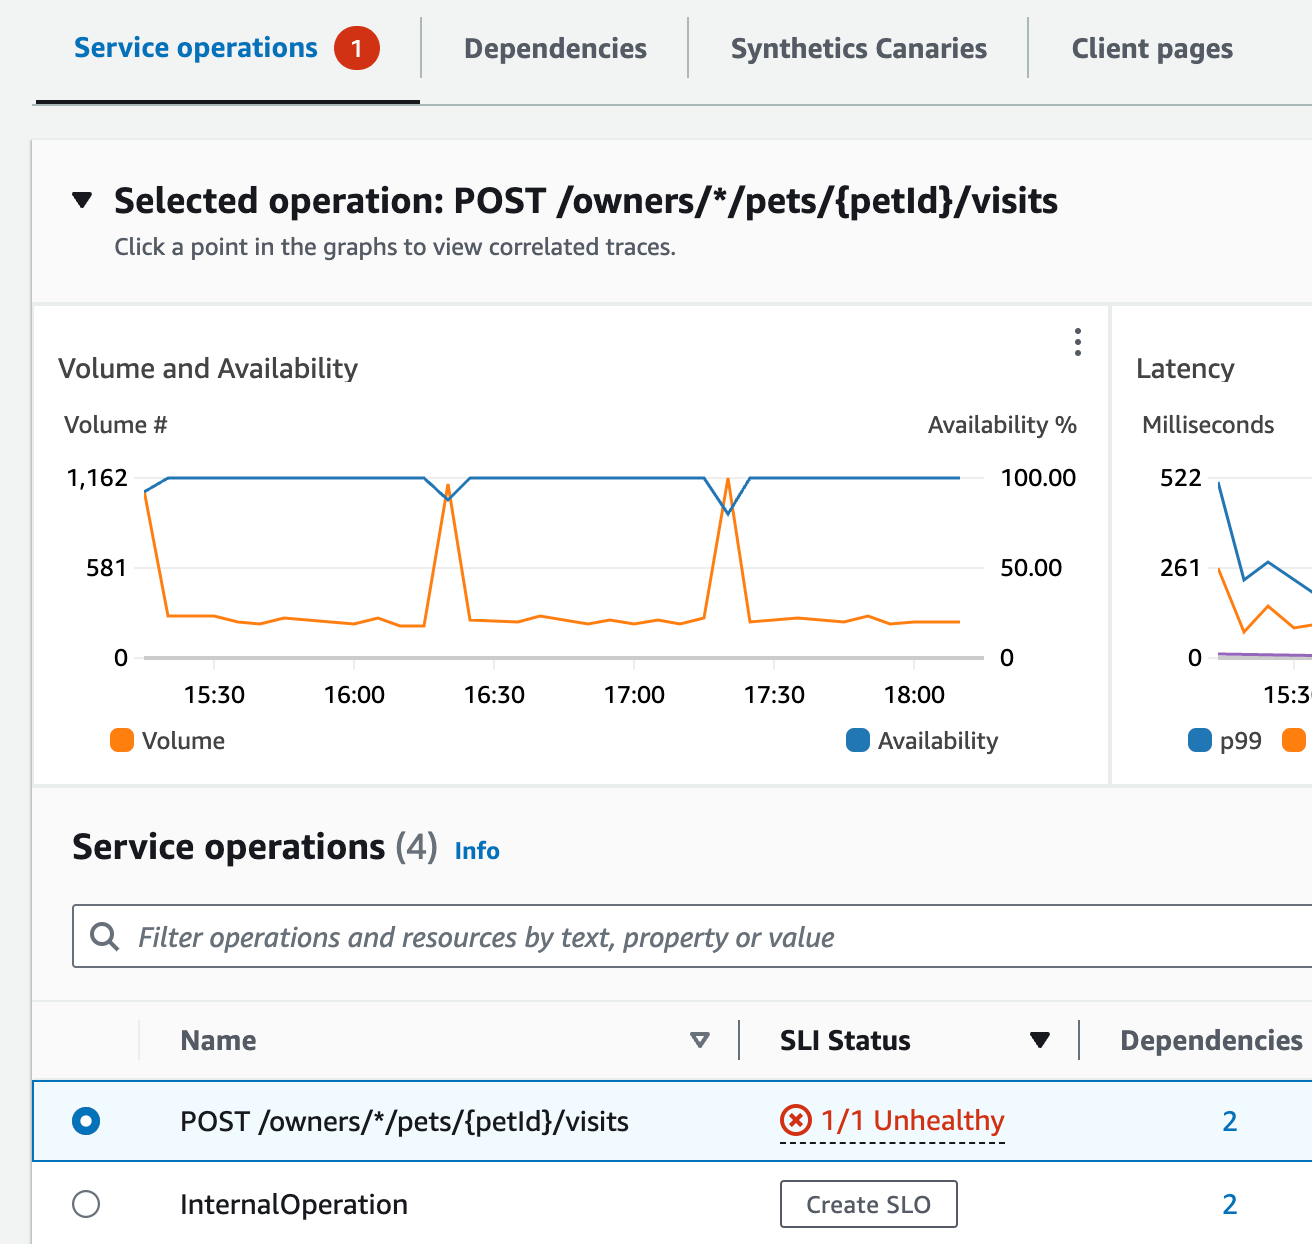
selects the link in the graph, which opens the Service detail page for the service. She sees that there is an
unhealthy operation in the Service operations table. She selects this operation and sees in the Volume and
Availability graph that there are periodic call volume spikes that seem to correlate to dips in availability.
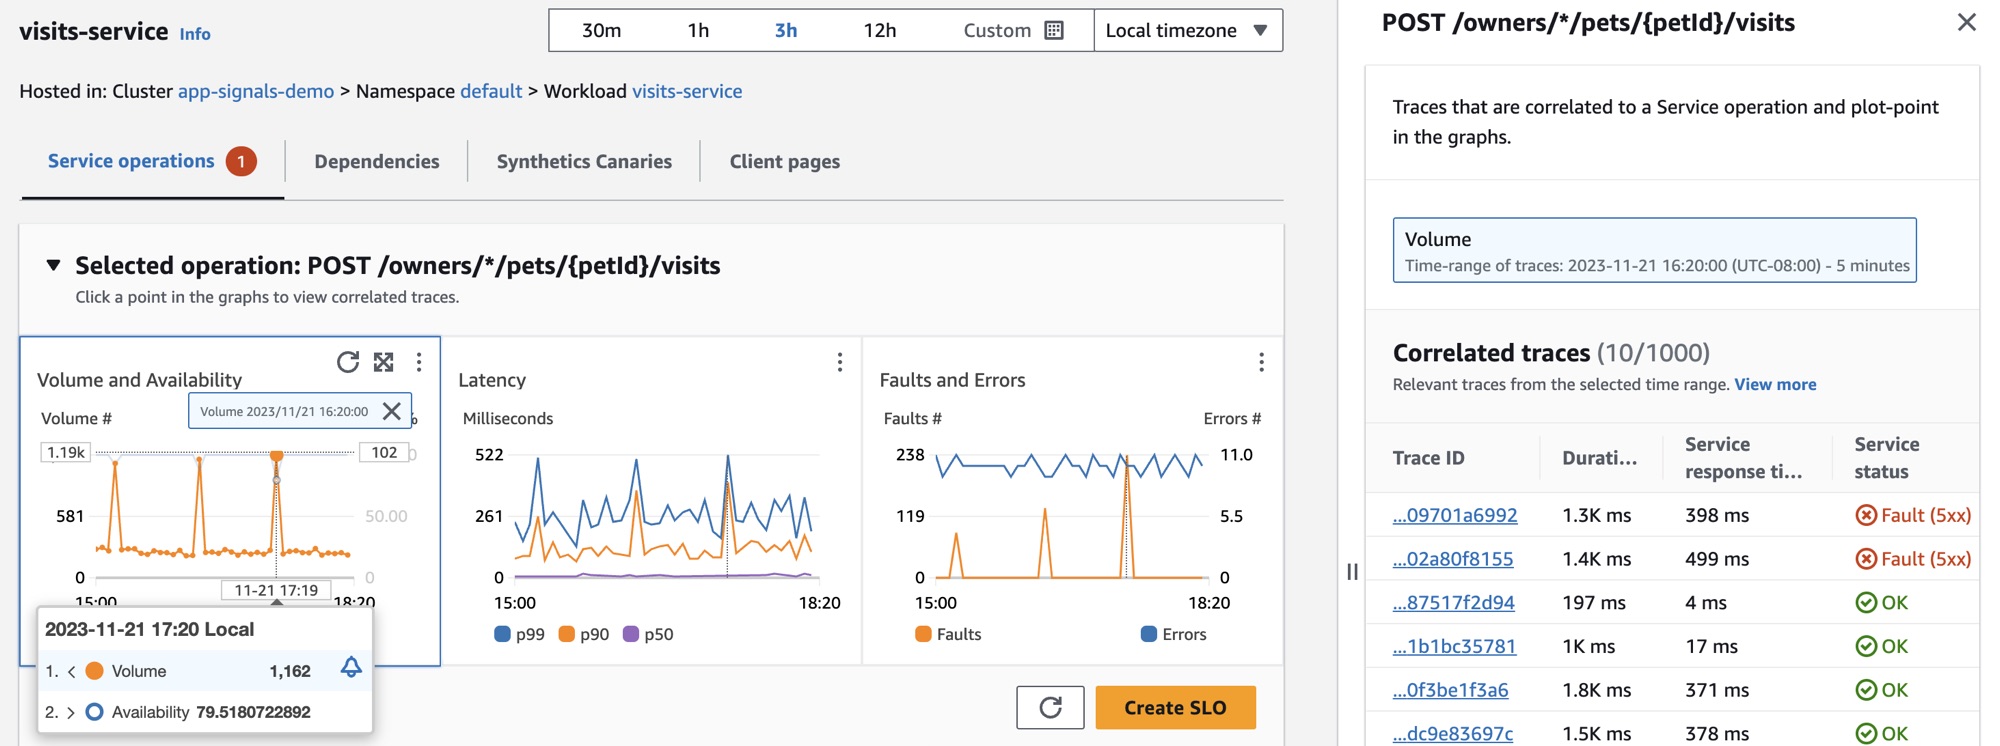
In order to look closer at the dips in service availability, Jane selects one of the availability data points in the graph. A drawer opens showing X-Ray traces that are correlated to the selected data point. She sees that there are multiple traces containing faults.
Jane selects one of the correlated traces with a fault status, which opens the X-Ray Trace detail page for the selected trace. Jane scrolls down to the Segments Timeline section and follows the call path until she sees that calls to a DynamoDB table are returning errors. She selects the DynamoDB segment and navigates to the Exceptions tab of the right-side drawer.
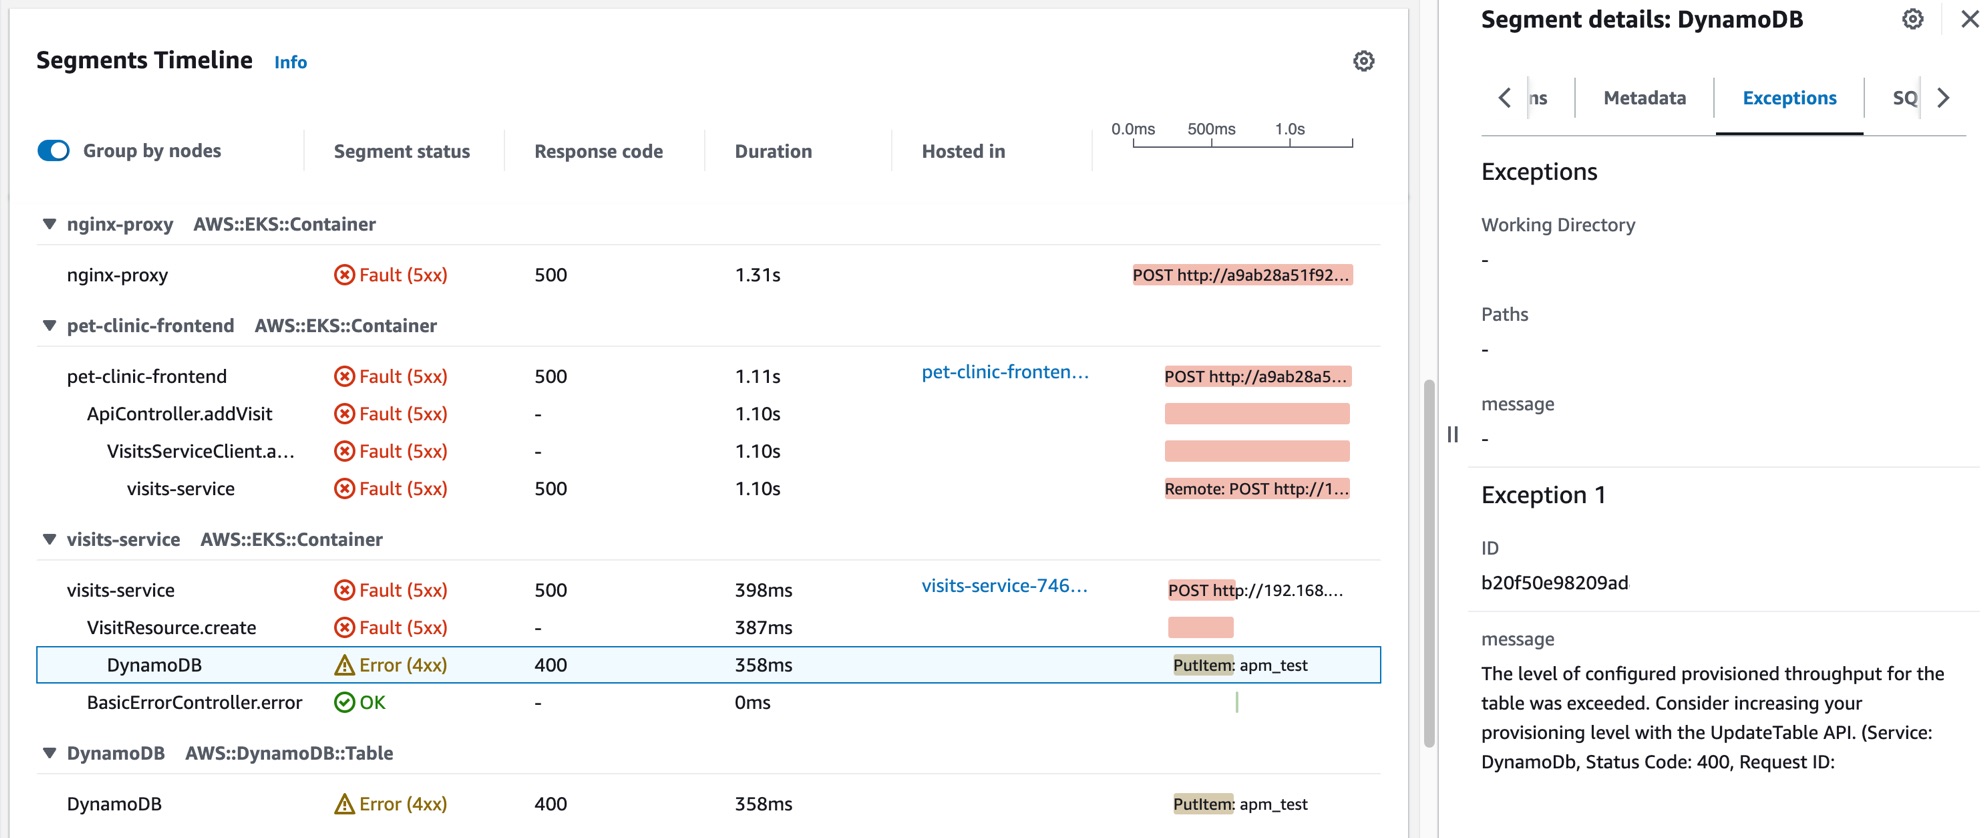
Jane sees that a DynamoDB resource is misconfigured, resulting in errors during spikes in customer requests. The DynamoDB table's level of provisioned throughput is periodically exceeded, resulting in service availability issues and unhealthy SLIs. Based on this information, her team is able to configure a higher level of provisioned throughput and ensure high availability of the application.