CloudWatch solution: Amazon EC2 health
This solution helps you configure out-of-the-box metric collection using CloudWatch agents for workloads running on EC2 instances. Additionally, it helps you set up a pre-configured CloudWatch dashboard.
Topics
Requirements
This solution is relevant for the following conditions:
Compute: Amazon EC2
Platform: Linux and macOS
Supports up to 500 EC2 instances in a given Amazon Web Services Region
Latest version of CloudWatch agent
-
SSM agent installed on EC2 instance
Note
Amazon Systems Manager (SSM agent) is pre-installed on some Amazon Machine Images (AMIs) provided by Amazon and trusted third-parties. If the agent isn't installed, you can install it manually using the procedure for your operating system type.
Benefits
The solution delivers EC2 server monitoring using the CloudWatch Agent, providing additional system-level metrics on top of the standard EC2 namespace metrics for the following use cases:
Detect CPU performance issues and resource constraints.
Monitor disk utilization and storage capacity across different disks throughout your EC2 instances.
Track memory usage patterns and potential memory leaks.
Analyze I/O operations and their impact on overall performance.
Observe network traffic patterns and potential anomalies.
Below are the key advantages of the solution:
-
Automates metric collection for EC2 instances eliminating manual instrumentation.
-
Provides a pre-configured, consolidated CloudWatch dashboard for EC2 instance metrics. The dashboard will automatically handle metrics from new EC2 instances configured using the solution, even if those metrics don't exist when you first create the dashboard. It also allows you to observe EC2 instances managed via Auto Scaling groups.
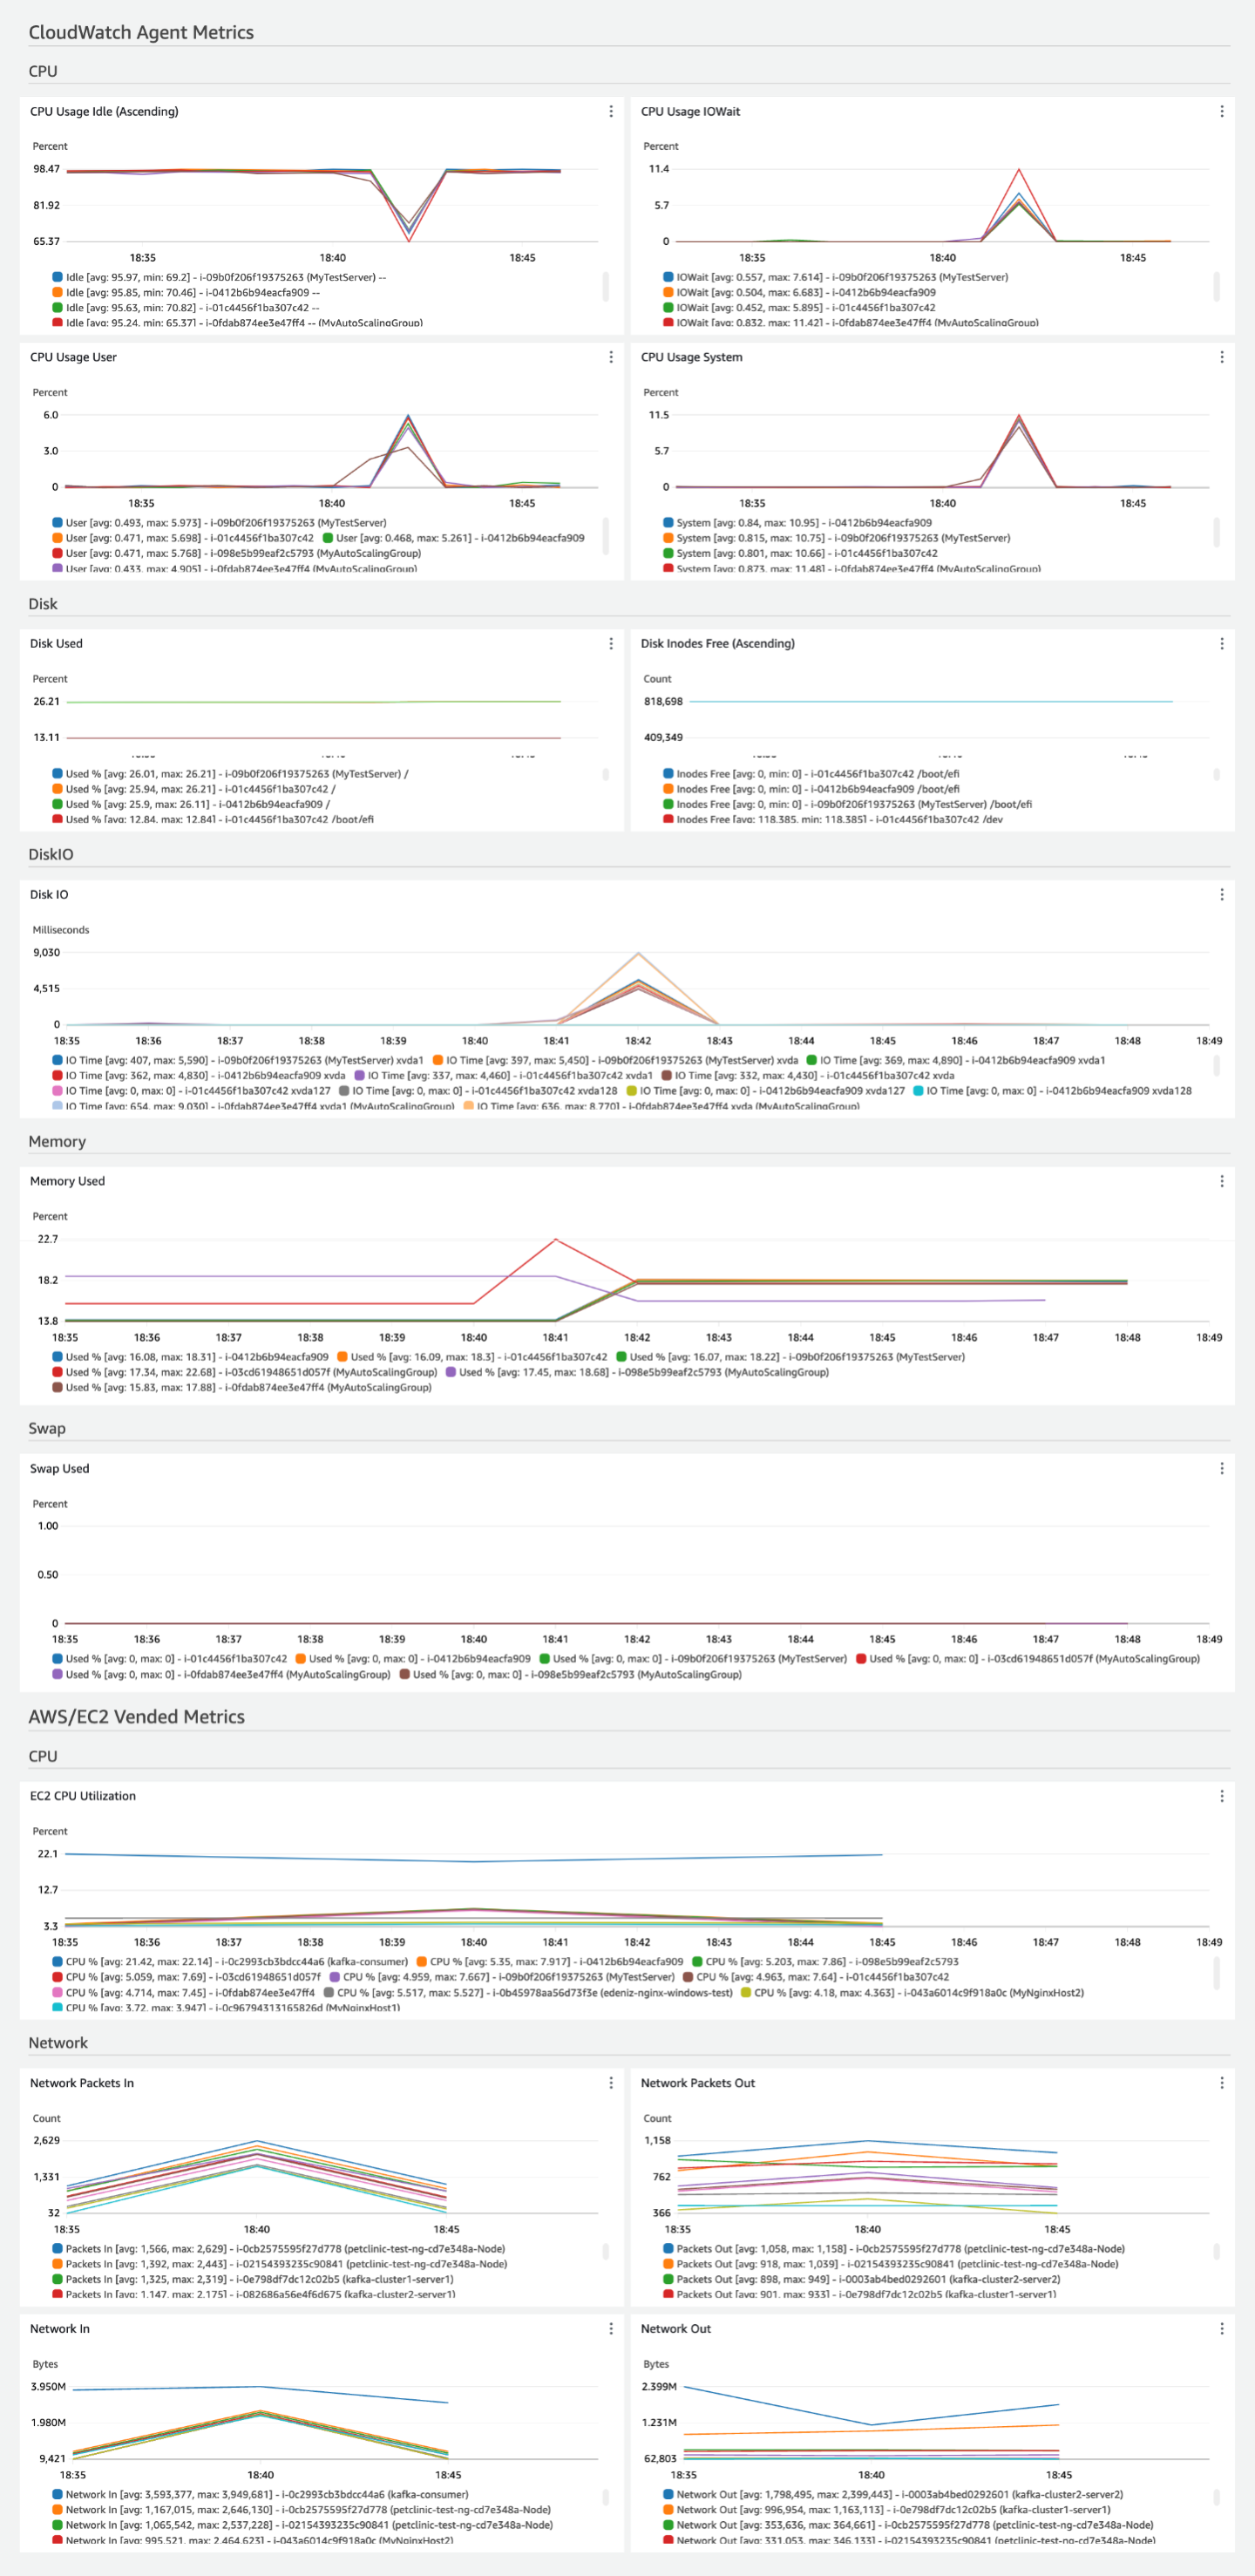
The following image is an example of the dashboard for this solution.
Costs
This solution creates and uses resources in your account. You are charged for standard usage, including the following:
-
All metrics collected by the CloudWatch agent are charged as custom metrics. The number of metrics used by this solution depends on the number of EC2 hosts.
The total number of CloudWatch agent metrics depends on the configuration of disks. Excluding disk and diskio metrics, the solution publishes six metrics. The number of disk metrics (
disk_used_percent,disk_inodes_free) depend on the count ofdevice/fstype/pathdimensions. The diskio metric (diskio_io_time) depends on the count ofnamedimensions. For example, a single t2.micro with default settings as per EC2 console experience, produces a total of 22 CloudWatch agent metrics (4 CPU, 12 disk, 4 diskio, 1 memory, and 1 swap). Vended metrics likeAWS/EC2are provided free of charge. One custom dashboard.
-
API operations requested by the CloudWatch agent to publish the metrics. With the default configuration for this solution, the CloudWatch agent calls the PutMetricData once every minute. This means the PutMetricData API will be called
30*24*60=43,200in a 30-day month for each EC2 host.
For more information about CloudWatch pricing, see Amazon CloudWatch Pricing
The pricing calculator can help you estimate approximate monthly costs for using this solution.
To use the pricing calculator to estimate your monthly solution costs
-
Open the Amazon CloudWatch pricing calculator
. -
In the Metrics section, for Number of metrics, enter
(6 + total count of disk and diskio metrics per EC2 host as described above) * number of EC2 instances
          configured for this solution
. -
In the APIs section, for Number of API requests, enter
43200 * number of EC2 instances configured for this solution. -
By default, the solution performs one PutMetricData operation each minute for each EC2 host.
-
In the Dashboards and Alarms section, for Number of Dashboards, enter
1. -
You can see your monthly estimated costs at the bottom of the pricing calculator.
CloudWatch agent configuration for this solution
The CloudWatch agent is software that runs continuously and autonomously on your servers and in containerized environments. It collects metrics, logs, and traces from your infrastructure and applications and sends them to CloudWatch and X-Ray.
For more information about the CloudWatch agent, see Collect metrics, logs, and traces with the CloudWatch agent
The agent configuration in this solution collects a set of metrics to help you get started monitoring and observing
your EC2 instances. The CloudWatch agent can be configured to collect more EC2 metrics than the dashboard displays by default.
For a list of Amazon EC2 metrics, see Metrics collected by the CloudWatch agent on Linux and macOS instances
Agent configuration for EC2 Health solution
The metrics collected by the agent are defined in the agent configuration. The solution provides agent configurations to collect the recommended metrics with suitable dimensions for the solution's dashboard.
The steps for deploying the solution are described later in Deploy the agent for your solution. The following information is intended to help you understand how to customize the agent configuration for your environment.
Note
If an EC2 instance is not part of an Auto Scaling group, the CloudWatch agent drops the AutoScalingGroupName
dimension entirely. This behavior helps to prevent dimension names with null/empty values. Each metric widget included in
the solution dashboard searches for metrics which include and exclude the AutoScalingGroup dimension. This helps to ensure
that all EC2 instances where the solution is applied are supported by the same dashboard.
If you wish to make any modifications to the agent configuration, you must apply the same changes to the solution's accompanying dashboard. For example, if you decide to omit the ImageId dimension, the same dimension must be removed from the metric search expression used in the dashboard widgets.
Agent configuration for EC2 Instances
Use the following CloudWatch agent configuration on Amazon EC2 instances where your workloads are deployed.
{
    "agent": {
      "metrics_collection_interval": 60,
      "run_as_user": "cwagent"
    },
    "metrics": {
      "append_dimensions": {
        "InstanceId": "${aws:InstanceId}",
        "InstanceType": "${aws:InstanceType}",
        "ImageId": "${aws:ImageId}",
        "AutoScalingGroupName": "${aws:AutoScalingGroupName}"
      },
      "metrics_collected": {
        "cpu": {
          "measurement": [
            "cpu_usage_idle",
             "cpu_usage_iowait",
             "cpu_usage_user",
             "cpu_usage_system"
          ],
          "totalcpu": true
        },
        "disk": {
          "measurement": [
            "used_percent",
            "inodes_free"
          ],
          "resources": [
            "*"
          ],
          "dimensions": [
            ["device", "fstype", "path"]
          ]
        },
        "diskio": {
           "measurement": [
             "io_time"
           ],
           "resources": [
             "*"
           ]
          },
        "mem": {
          "measurement": [
            "used_percent"
          ]
        },
        "swap": {
          "measurement": [
            "used_percent"
          ]
        }
      }
    }
  }
Deploy the agent for your solution
There are several approaches for installing the CloudWatch agent, depending on the use case. We recommend using Systems Manager
for this solution. It provides a console experience and makes it simpler to manage a fleet of managed servers within
a single Amazon account. The instructions in this section use Systems Manager and are intended for when you don't have the CloudWatch
agent running with existing configurations. You can check whether the CloudWatch agent is running by following the steps in
Verify that the CloudWatch agent is running
If you are already running the CloudWatch agent on the EC2 hosts and managing the agent configurations, you can skip
the instructions in this section and follow your existing deployment mechanism to update the configuration. Be sure to
merge the EC2 Health agent configuration with your existing agent configuration, and then deploy the merged configuration.
If you are using Systems Manager to store and manage the configuration for the CloudWatch agent, you can merge the configuration to the
existing parameter value. For more information, see Managing CloudWatch agent configuration files
Note
Using Systems Manager to deploy the following CloudWatch agent configurations will replace or overwrite any existing CloudWatch agent configuration on your EC2 instances. You can modify this configuration to suit your unique environment or use case. The metrics defined in configuration are the minimum required for the dashboard provided the solution.
The deployment process includes the following steps:
Step 1: Ensure that the target EC2 instances have the required IAM permissions.
Step 2: Store the recommended agent configuration file in the Systems Manager Parameter Store.
Step 3: Install the CloudWatch agent on one or more EC2 instances using an Amazon CloudFormation stack.
Step 4: Verify the agent setup is configured properly.
Step 1: Ensure the target EC2 instances have the required IAM permissions
You must grant permission for Systems Manager to install and configure the CloudWatch agent. You must also grant permission for the CloudWatch agent to publish telemetry from your EC2 instance to CloudWatch. Make sure that the IAM role attached to the instance has the CloudWatchAgentServerPolicy and AmazonSSMManagedInstanceCore IAM policies attached.
-
After the role is created, attach the role to your EC2 instances. To attach a role to an EC2 instance, follow the steps in Attach an IAM role to an instance
.
Step 2: Store the recommended CloudWatch agent configuration file in Systems Manager Parameter Store
Parameter Store simplifies the installation of the CloudWatch agent on an EC2 instance by securely storing and managing configuration parameters, eliminating the need for hard-coded values. This ensures a more secure and flexible deployment process, enabling centralized management and easier updates to configurations across multiple instances.
Use the following steps to store the recommended CloudWatch agent configuration file as a parameter in Parameter Store.
To create the CloudWatch agent configuration file as a parameter
-
Open the Amazon Systems Manager console at https://console.aws.amazon.com/systems-manager/
. -
Verify that the selected Region on the console is the Region where the EC2 instances are running.
-
From the navigation pane, choose Application Management, Parameter Store.
-
Follow these steps to create a new parameter for the configuration.
Choose Create parameter.
-
In the Name box, enter a name that you'll use to reference the CloudWatch agent configuration file in later steps. For example,
AmazonCloudWatch-EC2Health-Configuration. (Optional) In the Description box, type a description for the parameter.
For Parameter tier, choose Standard.
For Type, choose String.
For Data type, choose text.
-
In the Value box, paste the agent configuration JSON provided earlier in this document.
Choose Create parameter.
Step 3: Install the CloudWatch agent and apply the configuration using an Amazon CloudFormation template
You can use Amazon CloudFormation to install the agent and configure it to use the CloudWatch agent configuration that you created in the previous steps.
To install and configure the CloudWatch agent for this solution
-
Open the Amazon CloudFormation Quick create stack wizard using this link: https://console.aws.amazon.com/cloudformation/home?#/stacks/quickcreate?templateURL=https://aws-observability-solutions-prod-us-east-1.s3.us-east-1.amazonaws.com/CloudWatchAgent/CFN/v1.0.0/cw-agent-installation-template-1.0.0.json
. -
Verify that the selected Region on the console is the Region where the EC2 instances are running.
-
For Stack name, enter a name to identity this stack, such as
CWAgentInstallationStack. -
In the Parameters section, specify the following:
-
For CloudWatchAgentConfigSSM, enter the name of the Systems Manager parameter for the agent configuration that you created earlier, such as
AmazonCloudWatch-EC2Health-Configuration. -
To select the target instances, you have two options.
-
For InstanceIds, specify a comma-delimited list of instance IDs list of instance IDs where you want to install the CloudWatch agent with this configuration. You can list a single instance or several instances.
-
If you are deploying at scale, you can specify the TagKey and the corresponding TagValue to target all EC2 instances with this tag and value. If you specify a TagKey, you must specify a corresponding TagValue. (For an Auto Scaling group, specify
aws:autoscaling:groupNamefor the TagKey and specify the Auto Scaling group name for the TagValue to deploy to all instances within the Auto Scaling group.)
If you specify both the InstanceIds and the TagKeys parameters, the InstanceIds will take precedence and the tags will be ignored.
-
-
-
Review the settings, then choose Create stack.
If you want to edit the template file first to customize it, choose the Upload a template file option
under Create Stack Wizard to upload the edited template. For more information, see
Creating a stack on Amazon CloudFormation console
Note
After this step is completed, this Systems Manager parameter will be associated with the CloudWatch agents running in the targeted instances. This means that:
-
If the Systems Manager parameter is deleted, the agent will stop.
-
If the Systems Manager parameter is edited, the configuration changes will automatically apply to the agent at the scheduled frequency which is 30 days by default.
-
If you want to immediately apply changes to this Systems Manager parameter, you must run this step again. For more information about associations, see Working with associations in Amazon Systems Manager
.
Step 4: Verify the agent setup is configured properly
You can verify whether the CloudWatch agent is installed by following the steps in
Verify that the CloudWatch agent is running
-
Be sure you have attached a role with correct permissions for the EC2 instance as described in Step 1: Ensure the target EC2 instances have the required IAM permissions.
-
Be sure you have correctly configured the JSON for the Systems Manager parameter. Follow the steps in Troubleshooting installation of the CloudWatch agent with Amazon CloudFormation
.
To verify that EC2 health metrics are being published to CloudWatch
-
Open the CloudWatch console at https://console.aws.amazon.com/cloudwatch/
. -
Choose Metrics, All metrics.
-
Make sure you've selected the Region where you deployed the solution, and choose Custom namespaces, CWAgent.
-
Search for the metrics mentioned in the agent configuration section of this document, such as
mem_used_percent. If you see results for these metrics, then the metrics are being published to CloudWatch.
Create the EC2 Health solution dashboard
This dashboard displays the newly emitted metrics, showing the EC2 Health metrics. This dashboard provides a top contributor view for the health of your EC2 instances in a single region. The top contributor view displays the top 10 per metric widget. This allows you to identify outliers at a glance.
To create the dashboard, you can use the following options:
Use CloudWatch console to create the dashboard.
Use Amazon CloudFormation console to deploy the dashboard.
Download the Amazon CloudFormation infrastructure as code and integrate it as part of your continuous integration (CI) automation.
By using the CloudWatch console to create a dashboard, you can preview the dashboard before actually creating and being charged.
Note
The dashboard created with Amazon CloudFormation in this solution displays metrics from the Region where the solution is deployed. Be sure to create the Amazon CloudFormation stack in the Region where your EC2 metrics are published.
If you've specified a custom namespace other than CWAgent in the CloudWatch agent configuration, you'll have to change
the Amazon CloudFormation template for the dashboard to replace CWAgent with the customized namespace you are using.
To create the dashboard via CloudWatch Console
-
Open the CloudWatch Console Create Dashboard using this link: https://console.aws.amazon.com/cloudwatch/home?#dashboards?dashboardTemplate=Ec2LinuxMacOsHealth&referrer=os-catalog
. -
Verify that the selected Region on the console is the Region where the EC2 instances are running.
-
Enter the name of the dashboard, then choose Create Dashboard.
To easily differentiate this dashboard from similar dashboards in other Regions, we recommend including the Region name in the dashboard name, such as
EC2HealthDashboard-us-east-1. -
Preview the dashboard and choose Save to create the dashboard.
To create the dashboard via Amazon CloudFormation
-
Open the Amazon CloudFormation Quick create stack wizard using this link: https://console.aws.amazon.com/cloudformation/home?#/stacks/quickcreate?templateURL=https://aws-observability-solutions-prod-us-east-1.s3.us-east-1.amazonaws.com/EC2_Health/CloudWatch/CFN/v1.0.0/dashboard-template-linux-macos-1.0.0.json
. -
Verify that the selected Region on the console is the Region where the EC2 instances are running.
-
For Stack name, enter a name to identity this stack, such as
EC2HealthDashboardStack. -
In the Parameters section, specify the name of the dashboard under the DashboardName parameter.
To easily differentiate this dashboard from similar dashboards in other Regions, we recommend including the Region name in the dashboard name, such as
EC2HealthDashboard-us-east-1. -
Acknowledge access capabilities for transforms under Capabilities and transforms. Note that Amazon CloudFormation doesn't add any IAM resources.
-
Review the settings, then choose Create stack.
-
After the stack status is CREATE_COMPLETE, choose the Resources tab under the created stack and then choose the link under Physical ID to go to the dashboard. You can also access the dashboard in the CloudWatch console by choosing Dashboards in the left navigation pane of the console, and finding the dashboard name under Custom Dashboards.
If you want to edit the template file to customize it for any purpose, you can use the Upload a template file option
under Create Stack Wizard to upload the edited template. For more information, see
Creating a stack on Amazon CloudFormation console
Get started with the EC2 Health solution dashboard
Here are a few tasks that you can try out with the new EC2 monitoring dashboard. These tasks allow you to validate that the dashboard is working correctly and provide you some hands-on experience using it to monitor EC2 instances. As you try these out, you'll get familiar with navigating the dashboard and interpreting the visualized metrics.
- Monitor the various CPU utilization metrics
-
In the CPU section, examine the array of CPU usage metrics. These provide insight into how CPU resources are being utilized across different activities like user processes, system tasks, and I/O operations. Look for instances with consistently high utilization or unusual patterns, which might indicate the need for scaling or optimization.
- Analyze disk utilization across different devices
-
Navigate to the Disk section to find the storage usage and inode availability metrics. These help you identify instances that are running low on storage space or file system resources. Pay attention to any instances approaching high disk usage levels, as this could lead to performance issues or service disruptions.
- Investigate memory utilization patterns
-
In the Memory section, observe the graph which plots memory utilization over time. This shows how much of the available memory is being used by each instance. Look for patterns or spikes in memory usage that might correlate with specific times or events. High memory utilization could indicate the need for instance resizing or application optimization.
- Correlate patterns across core utilization metrics
-
Compare and watch out for related utilization patterns. For example, a workload running a log rotation process could present regular increases in CPU and memory utilization, followed by a decrease in disk utilization.
- Inspect network activity
-
In the Network section, examine the inbound and outbound network traffic metrics, both in terms of data volume and packet count. These give you insight into the network activity for your EC2 instances. Look out for both regular or anomalous spikes in network traffic, or imbalances between inbound and outbound data.