Services or capabilities described in Amazon Web Services documentation might vary by Region. To see the differences applicable to the China Regions,
see Getting Started with Amazon Web Services in China
(PDF).
Set up, configure, and manage your application for monitoring from the CloudWatch console
This section provides steps to set up, configure, and manage your application
for monitoring from the CloudWatch console.
Add and configure an application from the CloudWatch console
To get started with CloudWatch Application Insights from the CloudWatch console, perform the following
steps.
-
Start. Open the CloudWatch console
landing page. From the left navigation pane, under
Insights, choose Application
Insights. The page that opens shows the list of
applications that are monitored with CloudWatch Application Insights, along with their
monitoring status.
-
Add an application. To set up
monitoring for your application, choose Add an
application. When you choose Add an
application, you are prompted to Choose
Application Type.
-
Resource group-based
application. When you select this option, you
can choose which resource groups in this account to monitor. To use multiple applications on a component,
you must use resource group-based monitoring.
-
Account-based
application. When you select this option, you can
monitor all of the resources in this account. If you want to
monitor all of the resources in an account, we recommend
this option over the resource group-based option because the
application onboarding process is faster.
You can't combine resource group-based monitoring with
account-based monitoring using Application Insights. In order to change
the application type, you must delete all of the applications
that are being monitored, and Choose Application
Type.
When you add your first application for monitoring, CloudWatch Application Insights creates a
service-linked role in your account, which gives Application Insights
permissions to call other Amazon services on your behalf. For more
information about the service-linked role created in your account by
Application Insights, see Using service-linked roles for CloudWatch Application Insights.
-
- Resource-based application monitoring
-
-
Select an application or
resource group. On the
Specify application details
page, select the Amazon resource group that contains
your application resources from the dropdown list.
These resources include front-end servers, load
balancers, auto scaling groups, and database
servers.
If you have not created a resource group for
your application, you can create one by choosing
Create new resource group.
For more information about creating resource
groups, see the Amazon Resource Groups User
Guide.
-
Notifications for problem insights. To view and get notified when problems are detected for selected applications, choose Amazon SNS notifications or Systems Manager OpsCenter Opsitems.
-
Set up Amazon SNS notification (Recommended). Choose Select existing topic or Create new topic.
-
Integrate with Amazon
Systems Manager OpsCenter. Under Advanced Settings,
select the Generate Systems Manager OpsCenter OpsItems for remedial actions check box. To track the operations that are taken to
resolve operational work items (OpsItems) that are related to your Amazon resources, provide the Amazon SNS topic ARN.
-
Monitor CloudWatch
Events. Select the check box to
integrate Application Insights monitoring with CloudWatch Events
to get insights from Amazon EBS, Amazon EC2,
Amazon CodeDeploy, Amazon ECS,
Amazon Health APIs And Notifications, Amazon RDS, Amazon S3, and
Amazon Step Functions.
-
Tags —
optional. CloudWatch Application Insights supports both tag-based
and CloudFormation-based resource groups (with the
exception of Auto Scaling groups). For more
information, see Working with Tag Editor.
-
Choose Next.
An ARN is generated for the application in
the following format.
arn:partition:applicationinsights:region:account-id:application/resource-group/resource-group-name
Example
arn-cn:aws:applicationinsights:cn-north-1:123456789012:application/resource-group/my-resource-group
-
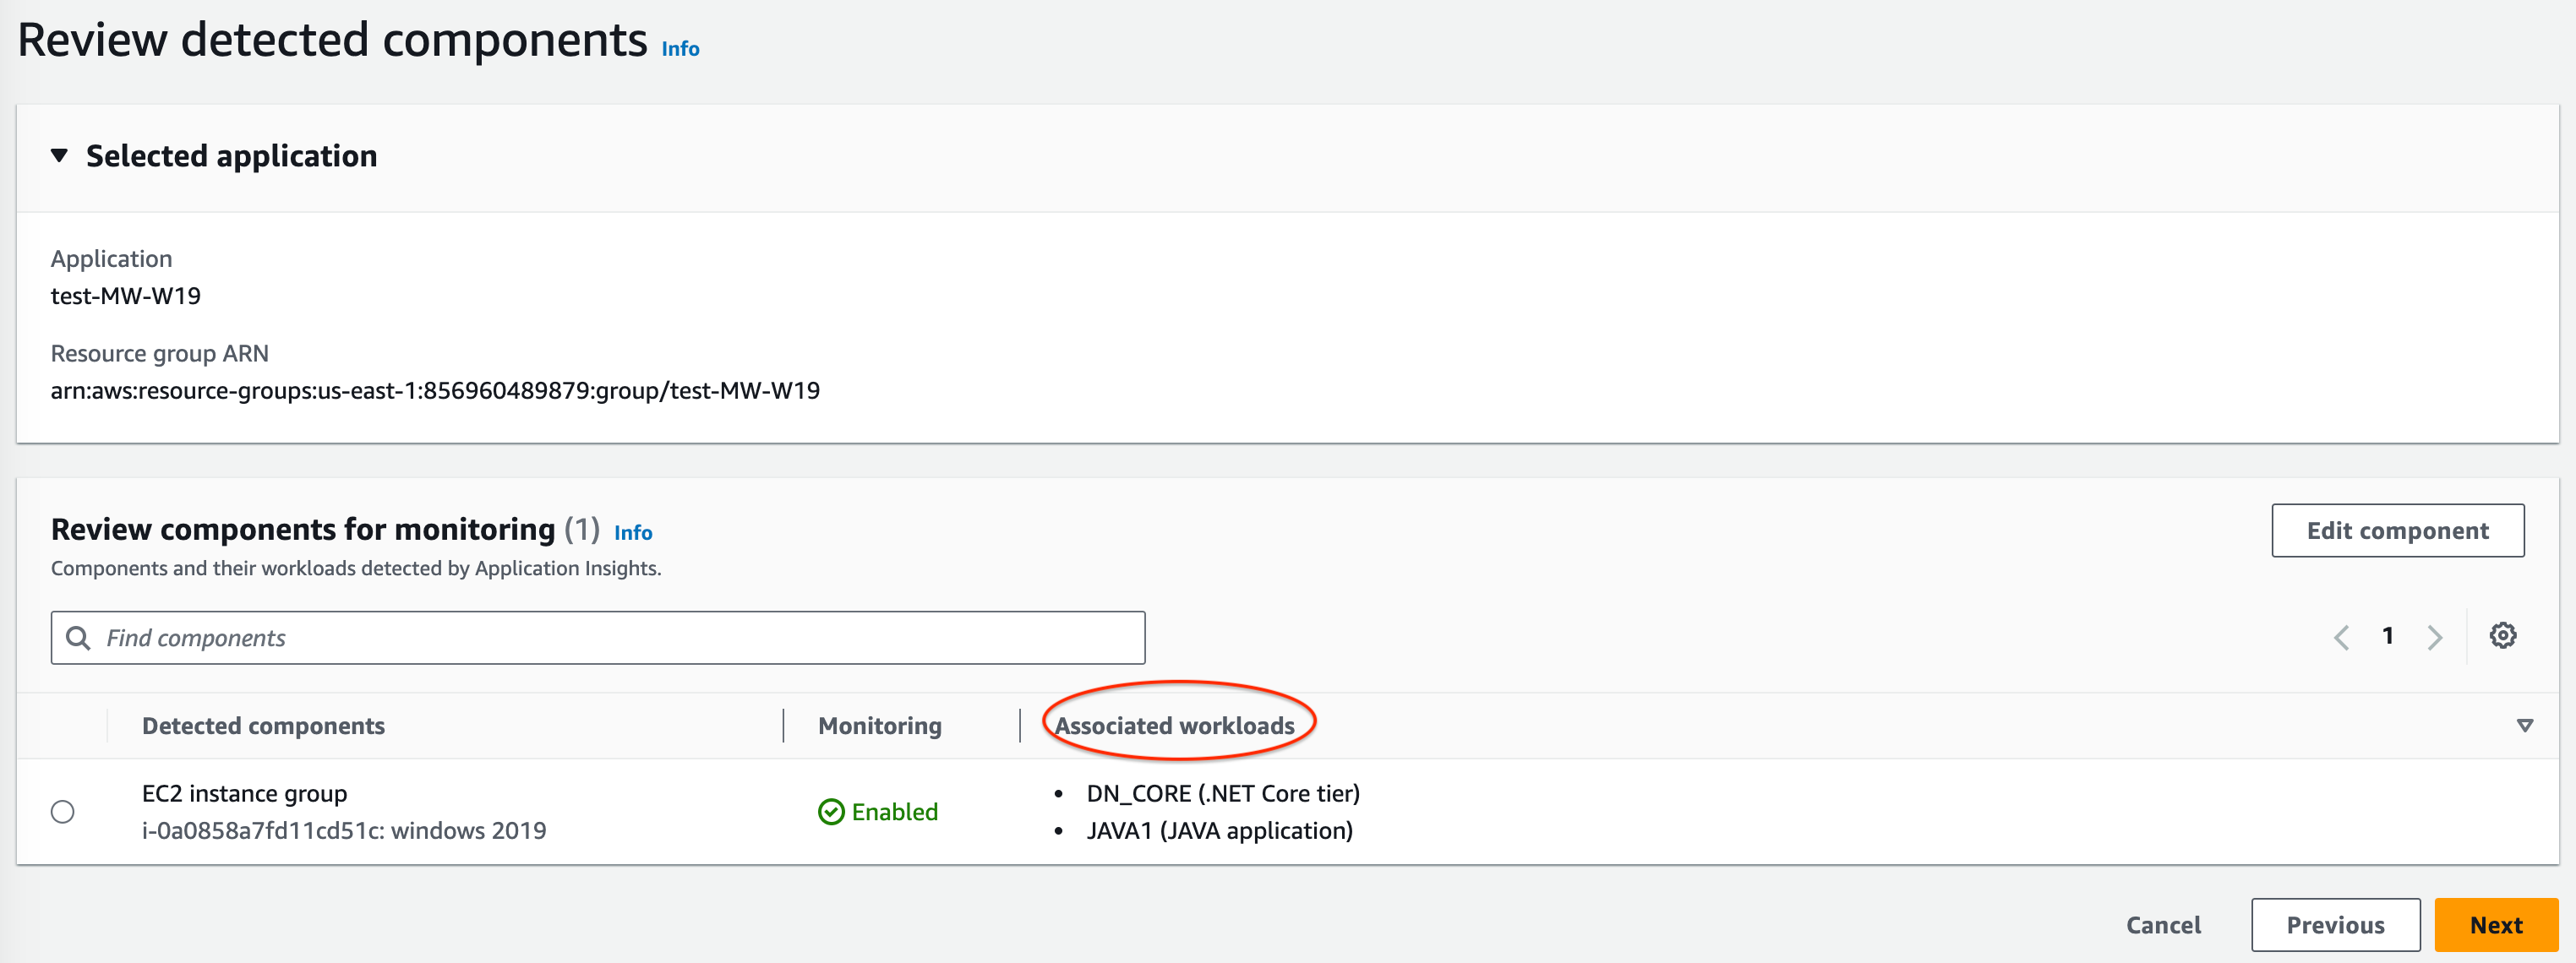
On the Review detected components page, under Review components for monitoring, the table lists the detected components
and their associated detected workloads.
For components that support multiple
customized workloads, you can monitor up to five
workloads for each component. These workloads will
be monitored separately from the component.
Under Associated
workloads, there are several possible
messages that appear if a workload is not
listed.
-
Couldn't detect
workloads – An issue occurred
when trying to detect workloads. Make sure that
you have completed the Prerequisites to configure an application for monitoring. If you need to add
workloads, choose Edit
component.
-
No workloads detected – We didn't detect any workloads. You may need to add workloads. To do so, choose Edit component.
-
Not applicable – The component doesn't support customized workloads and will be monitored with default metrics, alarms, and logs.
You can't add workloads to these components.
-
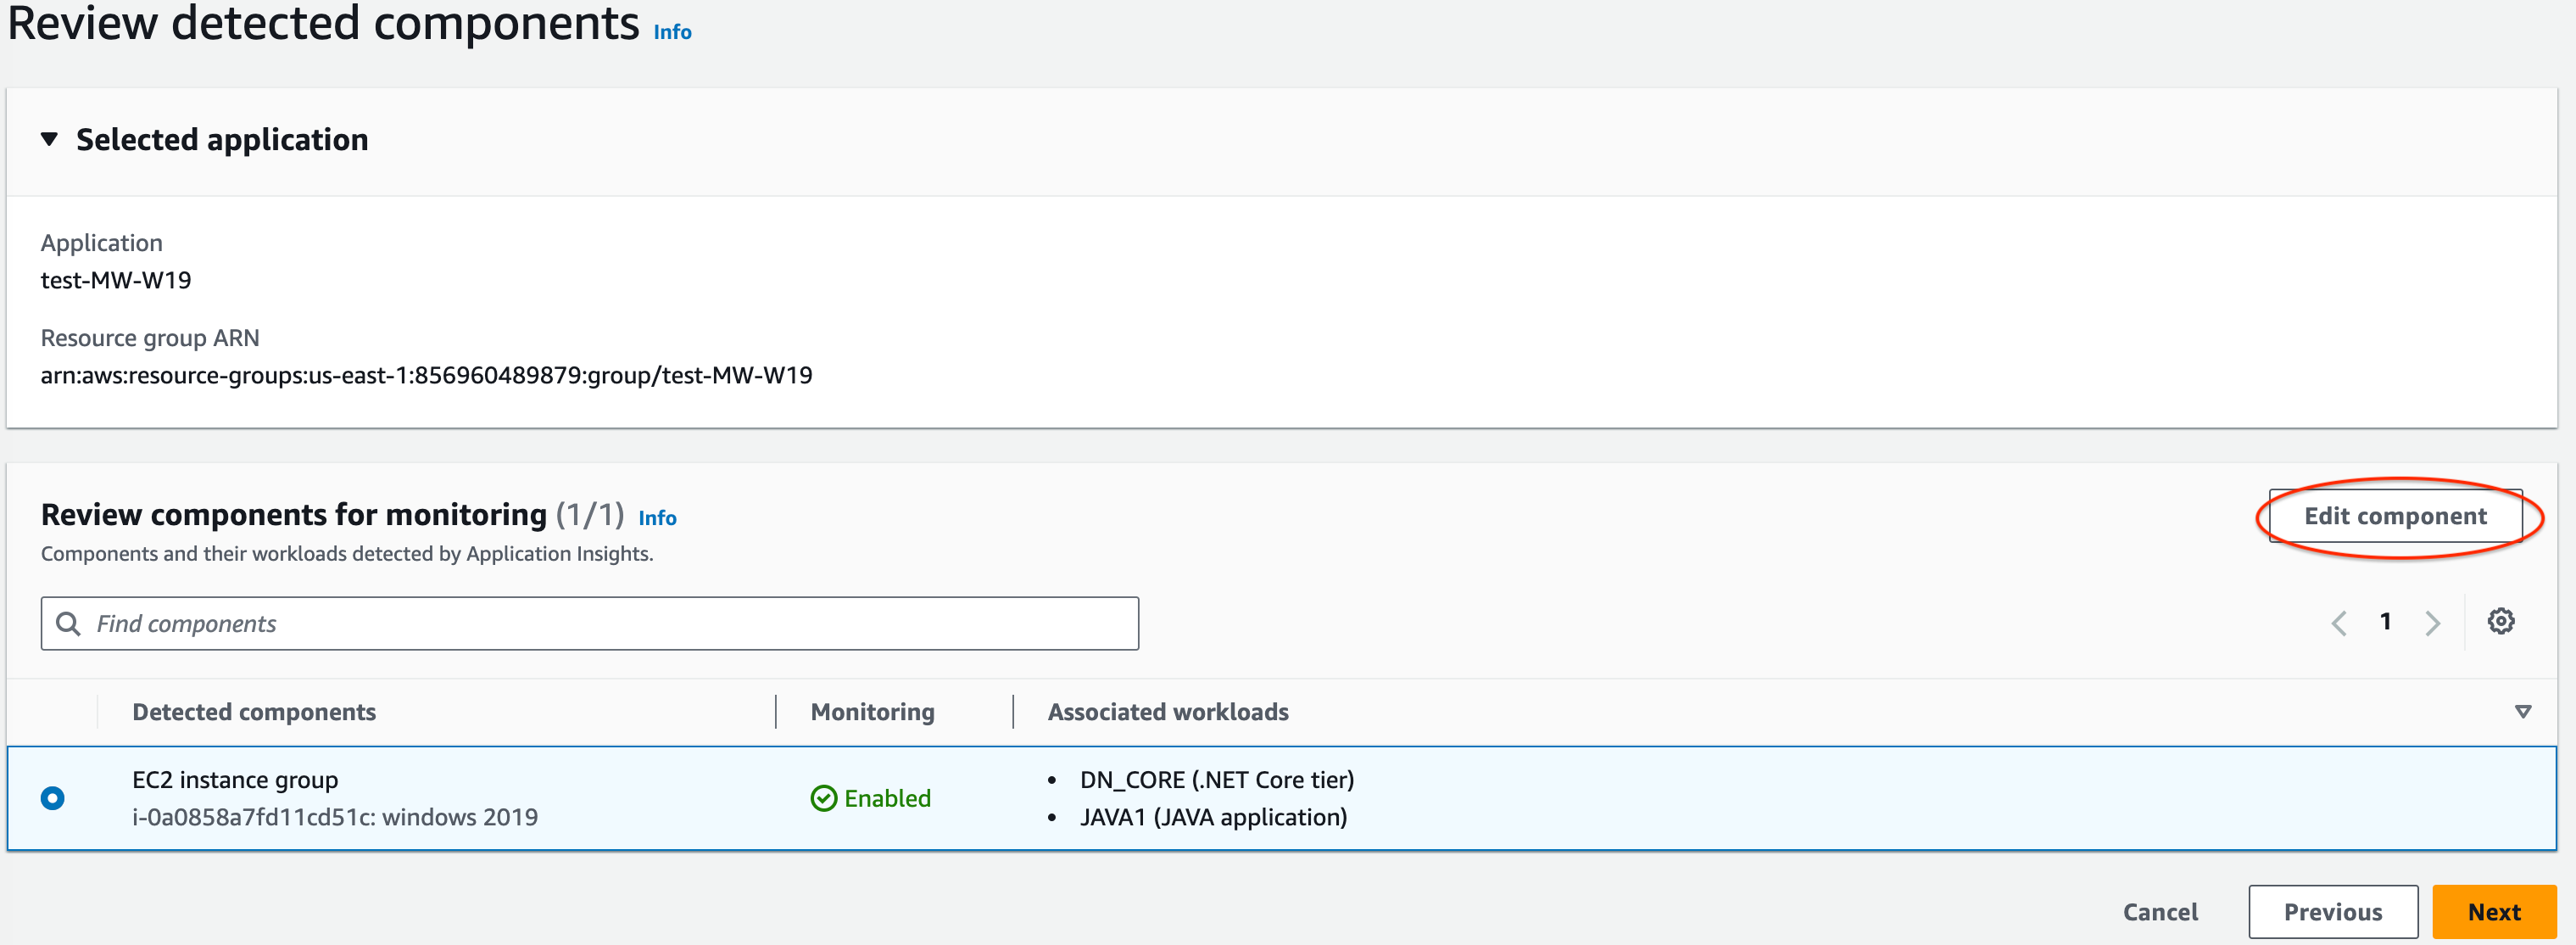
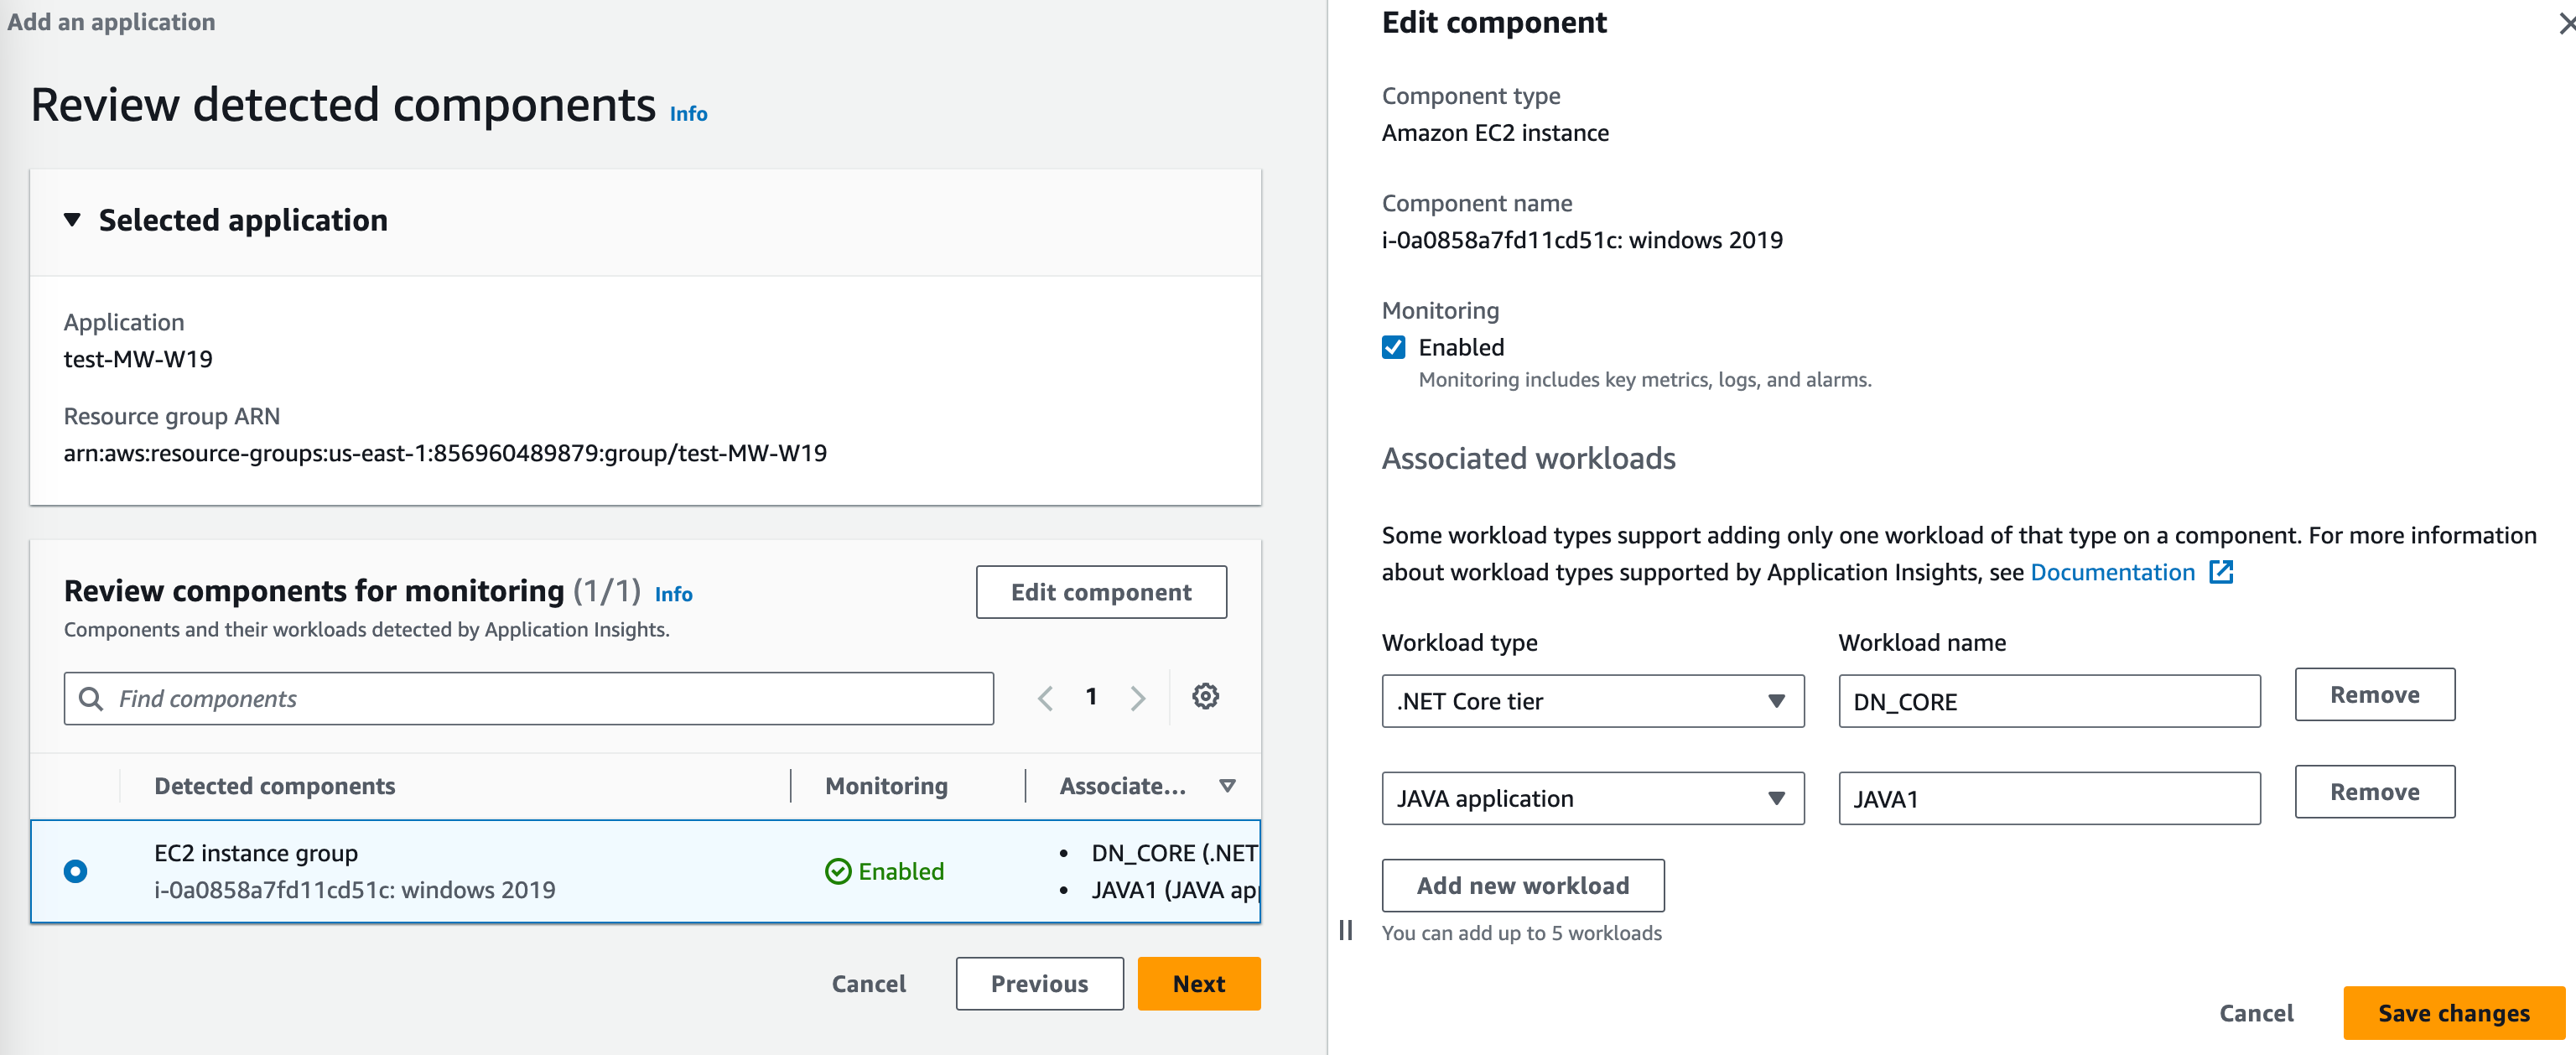
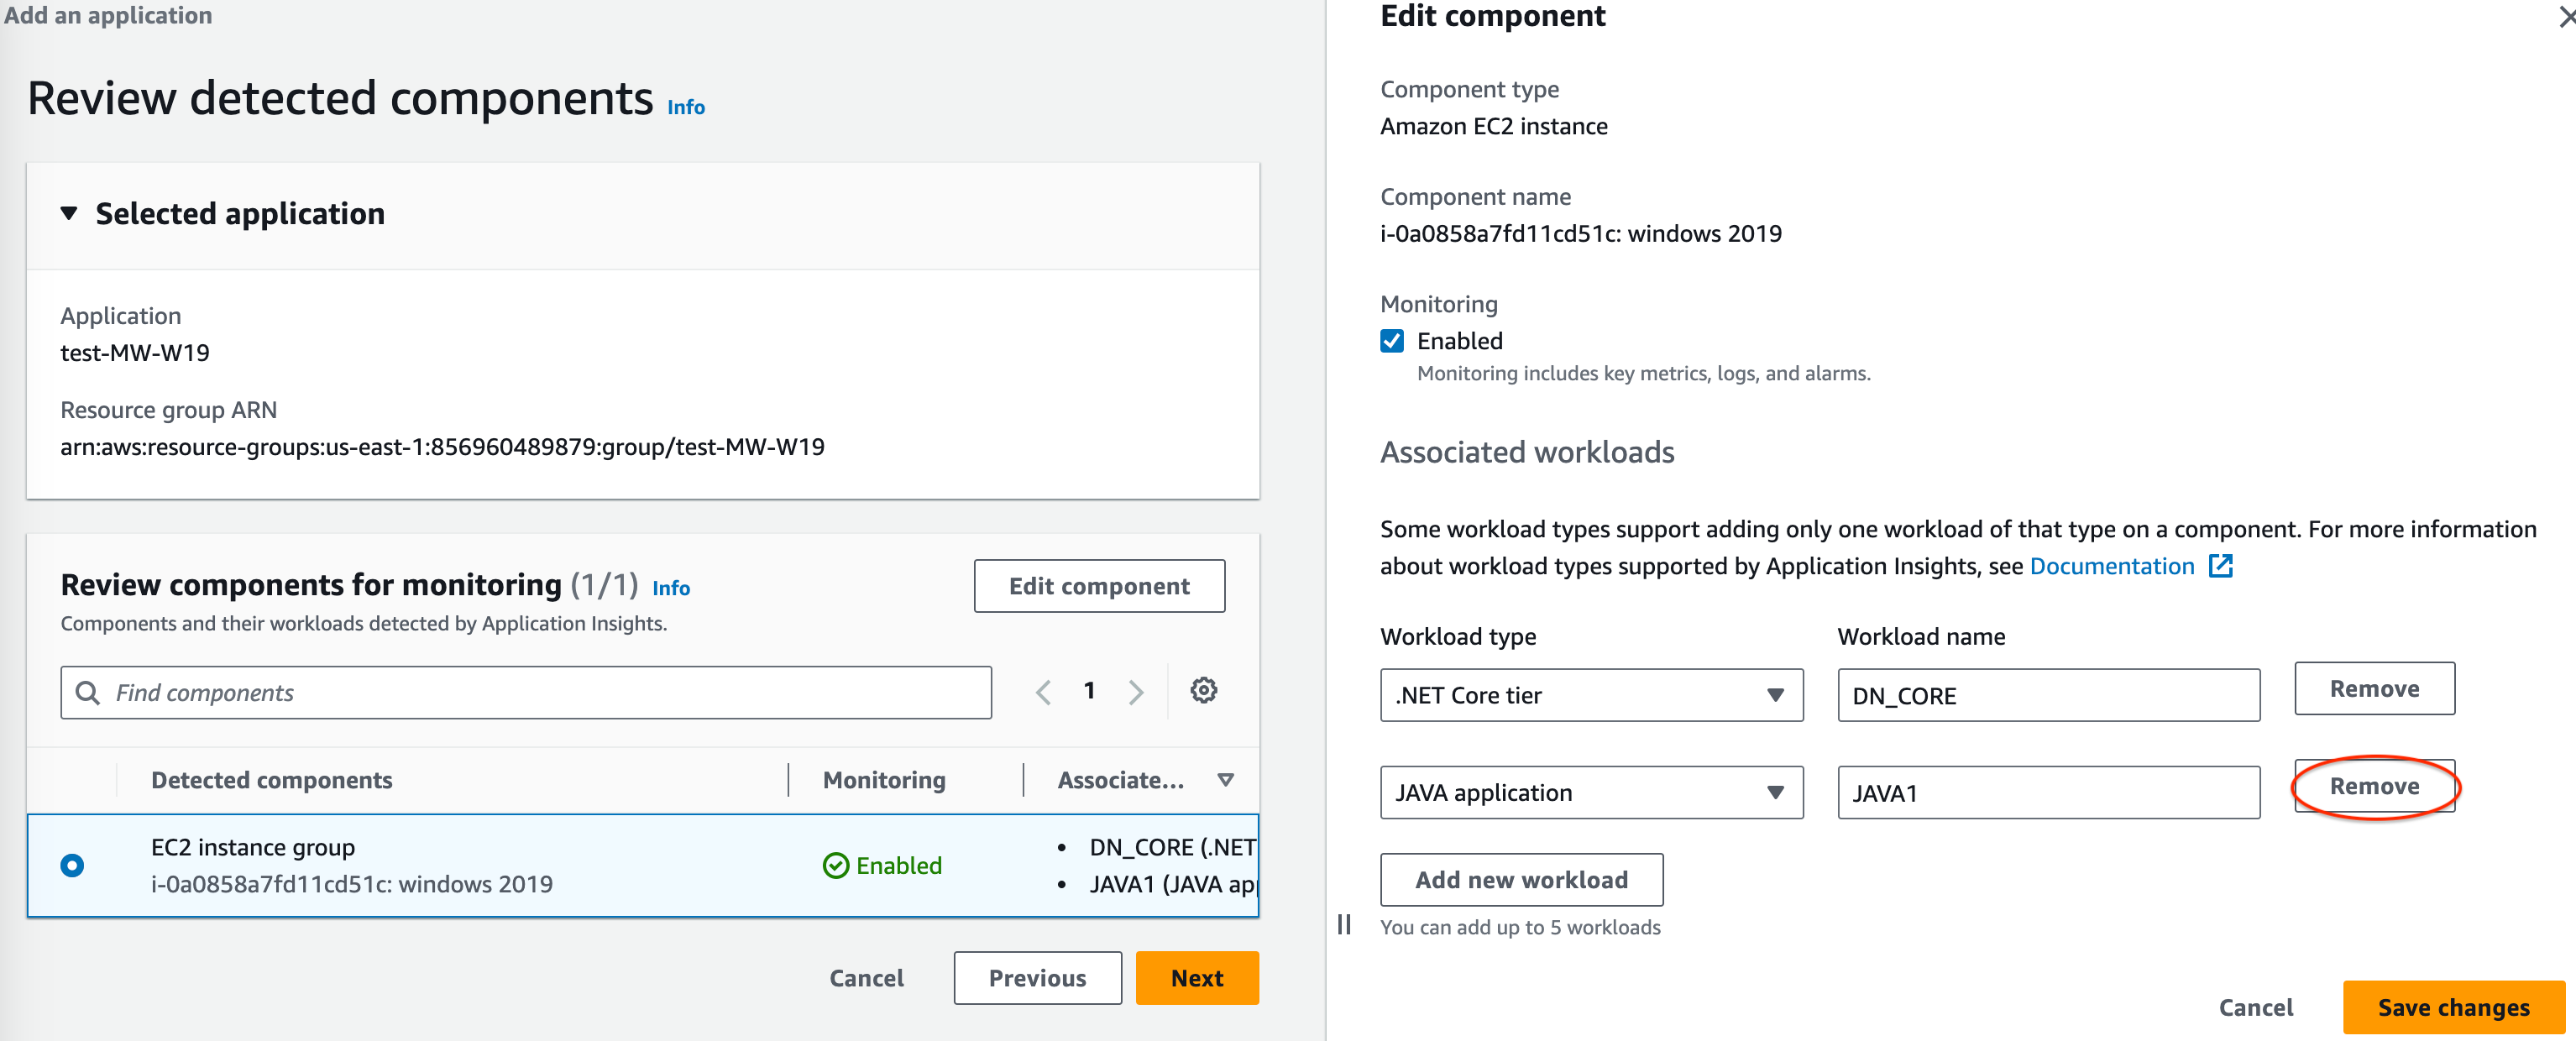
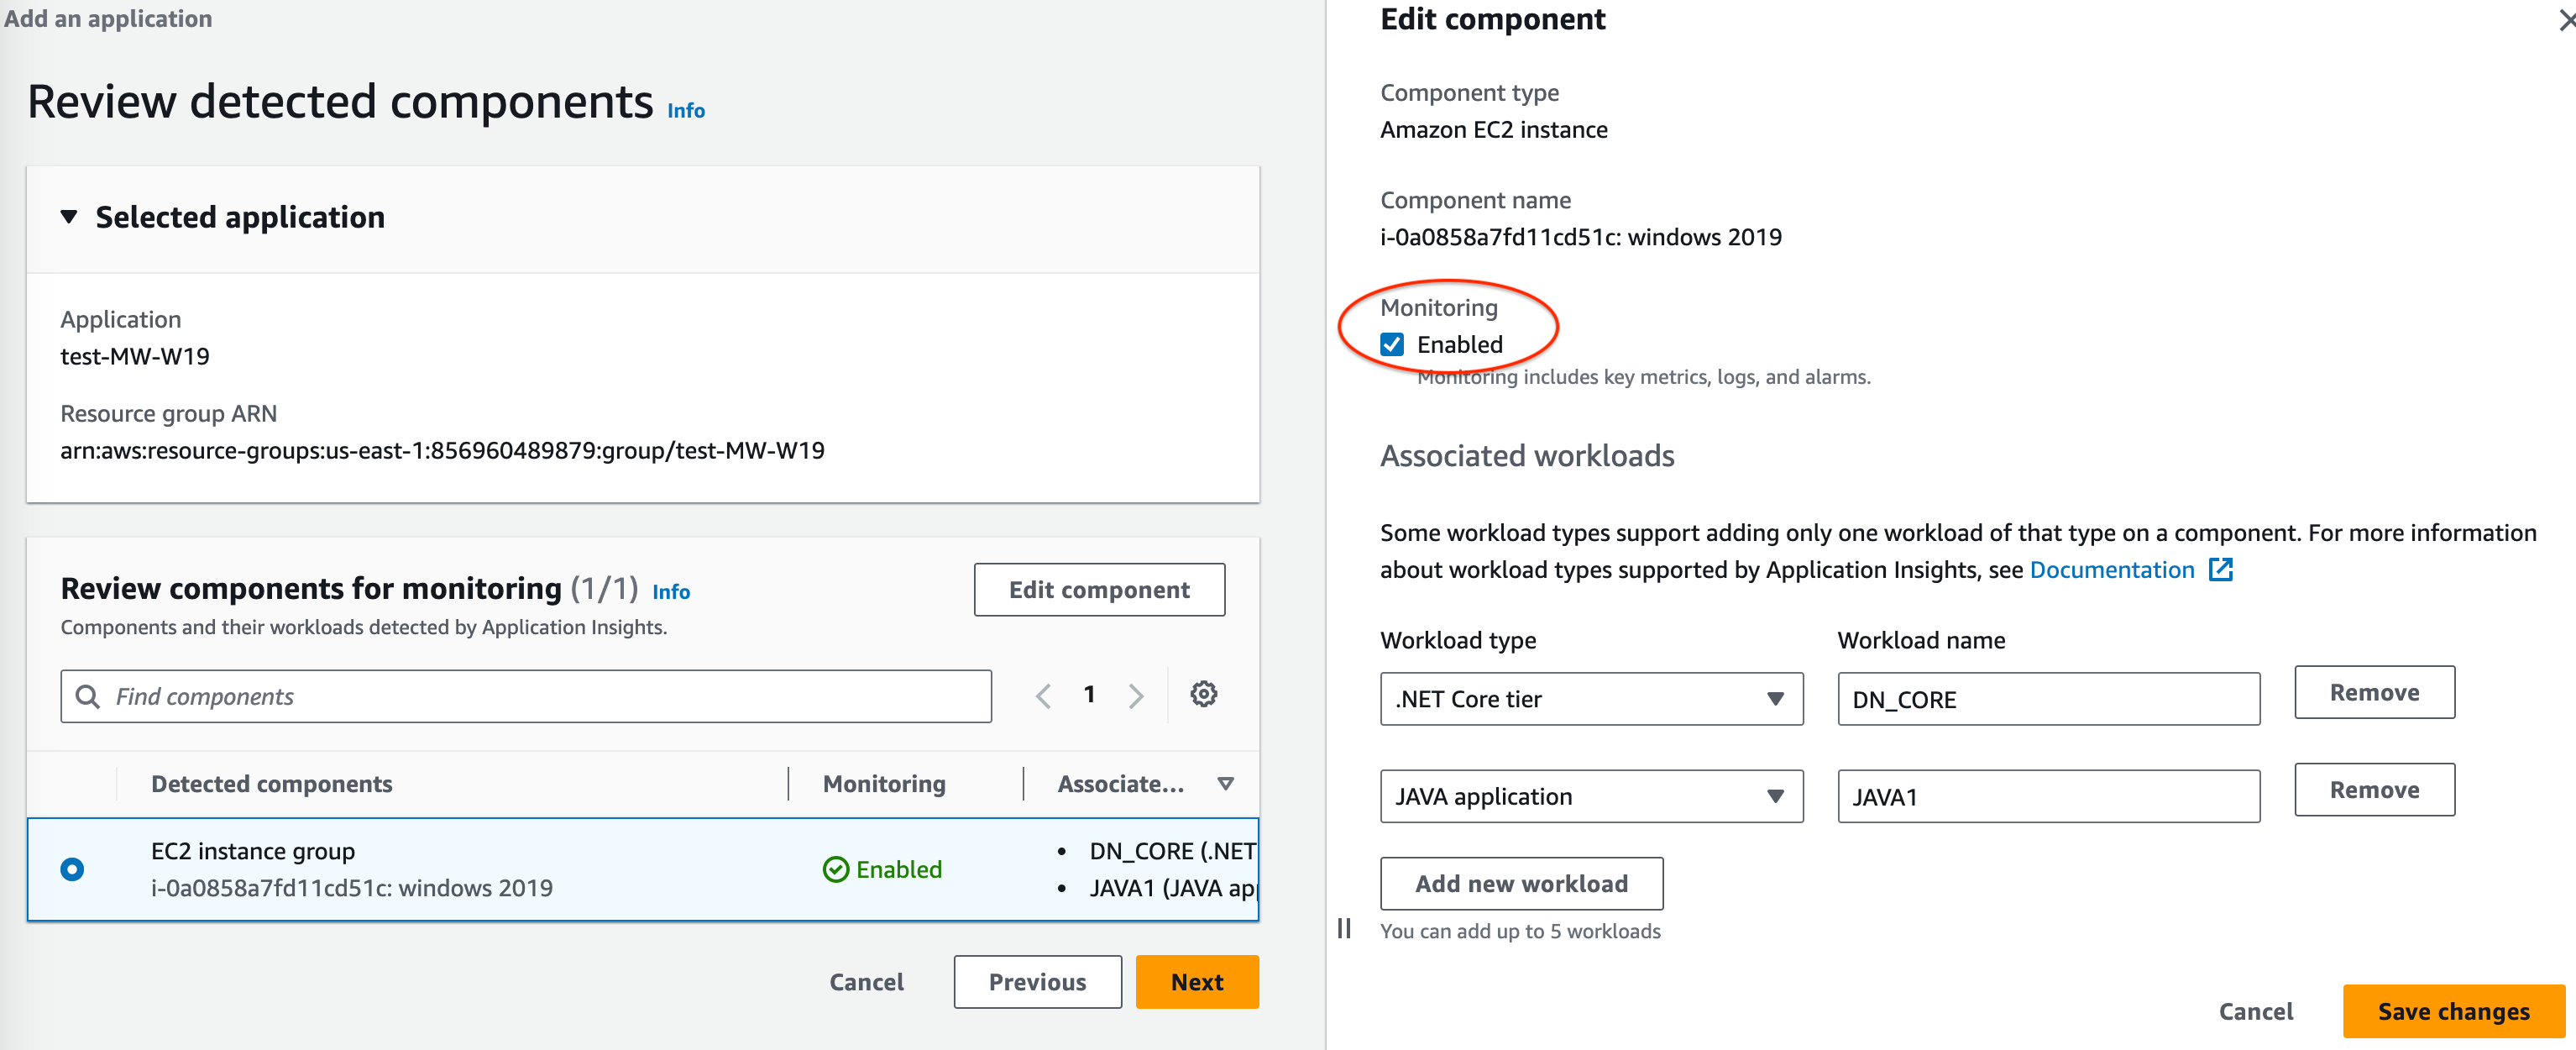
To edit a component, select a component, and then choose Edit component. A
side panel opens with workloads detected on the component. In this panel, you can edit the component details and add new workloads.
-
To edit the workload type or name, use the dropdown list.
-
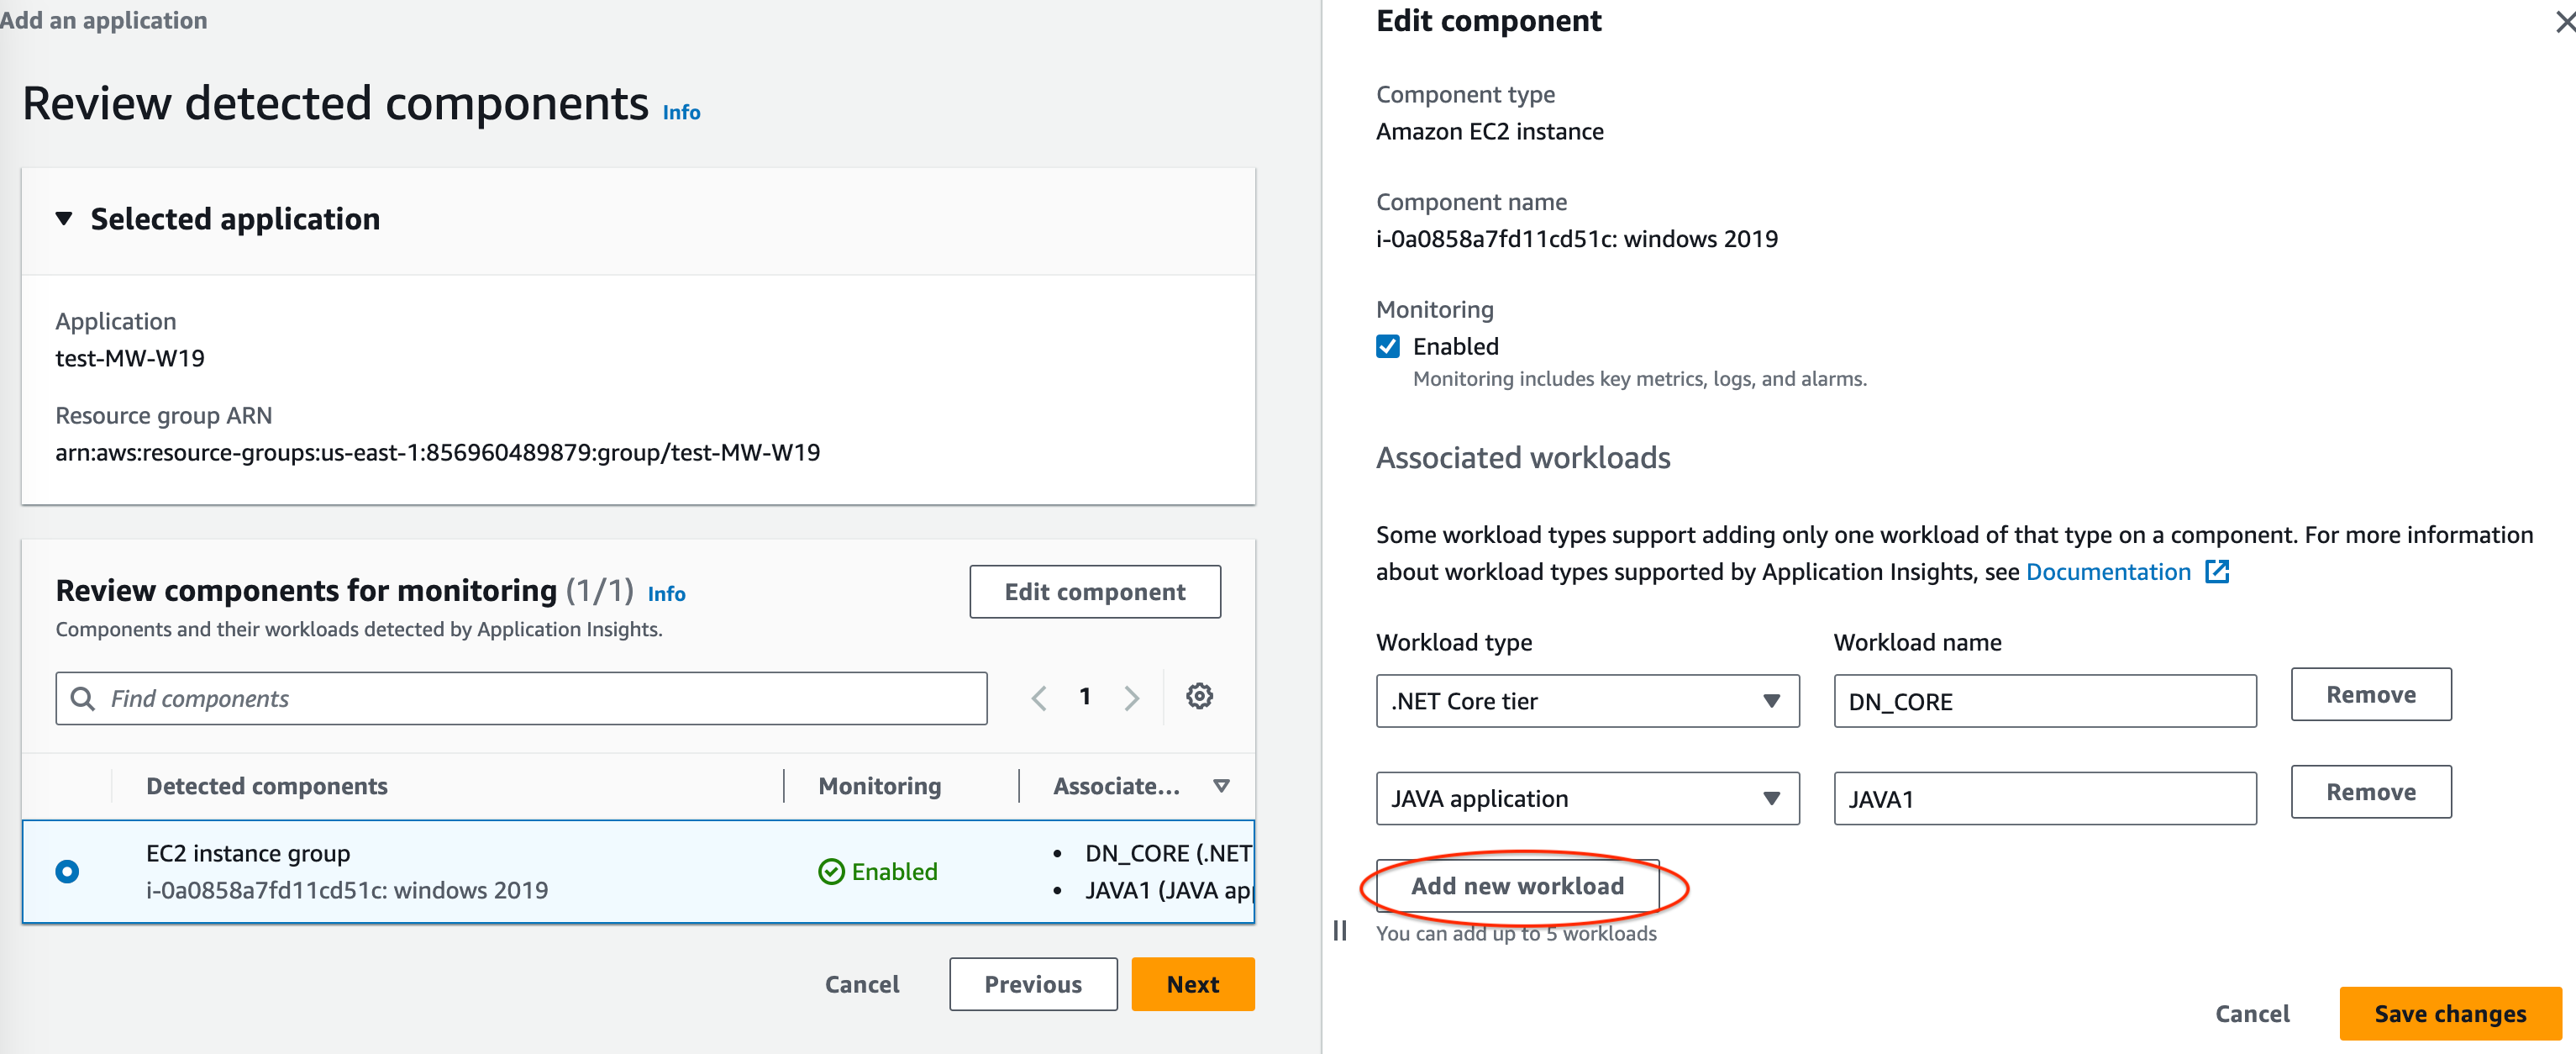
To add a workload to the component, choose Add new workload.
-
If Add new workload doesn't appear, this component doesn't support multiple workloads.
-
If the Associated workloads heading doesn't appear, this component doesn't support customized workloads.
-
To remove a workload, choose
Remove next to the workload
that you want to remove from monitoring.
-
To disable monitoring for the entire component, clear the Monitoring check box.
-
When you are done editing the component, choose Save changes in the lower right corner. Any changes to workloads for a component are visible on the
Review components for monitoring table under Associated workloads.
-
On the Review detected components page, choose Next.
-
The Specify component details page includes all components with customizable associated workloads from the previous step.
If a component header has an
optional tag, additional
details for the workloads in that component are
optional.
If a component doesn't appear on this page, the component doesn't have any additional details that can be specified in this step.
-
Choose Next.
-
On the Review and submit page, review all monitored component and workload details.
-
Choose Submit.
- Account-based application monitoring
-
-
Application
name. Enter a name for your
account-based application.
-
Automated monitoring of
new resources. By default, Application Insights
uses recommended settings to configure monitoring
for resource components that are added to your
account after you onboard the application. You can
exclude monitoring for resources added after
onboarding your application by clearing the check
box.
-
Monitor CloudWatch
Events. Select the check box to
integrate Application Insights monitoring with CloudWatch Events
to get insights from Amazon EBS, Amazon EC2,
Amazon CodeDeploy, Amazon ECS,
Amazon Health APIs And Notifications, Amazon RDS, Amazon S3, and
Amazon Step Functions.
-
Integrate with Amazon
Systems Manager OpsCenter. To view and
get notified when problems are detected for
selected applications, select the
Generate Systems Manager OpsCenter
OpsItems for remedial actions check
box. To track the operations that are taken to
resolve operational work items (OpsItems) that are
related to your Amazon resources, provide the SNS
topic ARN.
-
Tags —
optional. CloudWatch Application Insights supports both tag-based
and CloudFormation-based resource groups (with the
exception of Auto Scaling groups). For more
information, see Working with Tag Editor.
-
Discovered
resources. All of the resources
discovered in your account are added to this list.
If Application Insights is unable to discover all of the
resources in your account, an error message
appears at the top of the page. This message
includes a link to the documentation for how to add the required
permissions.
-
Choose Next.
An ARN is generated for the application in
the following format.
arn:partition:applicationinsights:region:account-id:application/TBD/application-name
Example
arn-cn:aws:applicationinsights:cn-north-1:123456789012:application/TBD/my-application
-
After you submit your application monitoring configuration, you
will be taken to the details page for the application, where you can
view the Application summary, the list of
Monitored components and
Unmonitored components, and, by selecting
the tabs next to Components, the
Configuration history, Log
patterns, and any Tags that you
have applied.
To view insights for the application, choose View
Insights.
You can update your selections for CloudWatch Events monitoring and
integration with Amazon Systems Manager OpsCenter by choosing
Edit.
Under Components, you can select the
Actions menu to Create, Modify, or Ungroup
an instance group.
You can manage monitoring for components, including application
tier, log groups, event logs, metrics, and custom alarms, by
selecting the bullet next to a component and choosing
Manage monitoring.
Enable Application Insights for Amazon ECS and Amazon EKS resource monitoring
You can enable Application Insights to monitor containerized applications and
microservices from the Container Insights console. Application Insights supports
monitoring for the following resources:
-
Amazon ECS clusters
-
Amazon ECS services
-
Amazon ECS tasks
-
Amazon EKS clusters
When Application Insights is enabled, it provides recommended metrics and logs,
detects potential problems, generates CloudWatch Events, and creates automatic
dashboards for your containerized applications and microservices.
You can enable Application Insights for containerized resources from the Container
Insights or Application Insights consoles.
Enable Application Insights from the Container Insights console
From the Container Insights console, on the Container Insights
Performance monitoring dashboard, choose
Auto-configure Application Insights. When Application Insights is
enabled, it displays details about detected problems.
Enable Application Insights from the Application Insights console
When ECS clusters appear in the component list, Application Insights
automatically enables additional container monitoring with Container
Insights.
For EKS clusters, you can enable additional monitoring with Container
Insights to provide diagnostics information, such as container restart
failures, to help you isolate and resolve problems. Additional steps are
required to set up Container Insights for EKS. For information, see Amazon EKS for steps to set up
Container Insights on EKS.
Additional monitoring for EKS with Container Insights is supported on
Linux instances with EKS.
For more information about Container Insights support for ECS and EKS
clusters, see Container Insights.
Disable monitoring for an application component
To disable monitoring for an application component, from the application
details page, select the component for which you want to disable monitoring.
Choose Actions, and then Remove from
monitoring.
Delete an application
To delete an application, from the CloudWatch dashboard, on the left navigation
pane, choose Application Insights under
Insights. Select the application that you want to
delete. Under Actions, choose Delete
application. This deletes monitoring and deletes all of the
saved monitors for application components. The application resources are not
deleted.