Tutorial: Set up monitoring for SAP HANA
This tutorial demonstrates how to configure CloudWatch Application Insights to set up monitoring for your SAP HANA databases. You can use CloudWatch Application Insights automatic dashboards to visualize problem details, accelerate troubleshooting, and facilitate mean time to resolution (MTTR) for your SAP HANA databases.
Application Insights for SAP HANA topics
Supported environments
CloudWatch Application Insights supports the deployment of Amazon resources for the following systems and patterns. You provide and install SAP HANA database software and supported SAP application software.
-
SAP HANA database on a single Amazon EC2 instance — SAP HANA in a single-node, scale-up architecture, with up to 24TB of memory.
-
SAP HANA database on multiple Amazon EC2 instances — SAP HANA in a multi-node, scale-out architecture.
-
Cross-AZ SAP HANA database high availability setup — SAP HANA with high availability configured across two Availability Zones using SUSE/RHEL clustering.
Note
CloudWatch Application Insights supports only single SID HANA environments. If multiple HANA SIDs are attached, monitoring will be set up for only the first detected SID.
Supported operating systems
CloudWatch Application Insights for SAP HANA supports x86-64 architecture on the following operating systems:
-
SuSE Linux 12 SP4 For SAP
-
SuSE Linux 12 SP5 For SAP
-
SuSE Linux 15
-
SuSE Linux 15 SP1
-
SuSE Linux 15 SP2
-
SuSE Linux 15 For SAP
-
SuSE Linux 15 SP1 For SAP
-
SuSE Linux 15 SP2 For SAP
-
SuSE Linux 15 SP3 For SAP
-
SuSE Linux 15 SP4 For SAP
-
SuSE Linux 15 SP5 For SAP
-
RedHat Linux 8.6 For SAP With High Availability and Update Services
-
RedHat Linux 8.5 For SAP With High Availability and Update Services
-
RedHat Linux 8.4 For SAP With High Availability and Update Services
-
RedHat Linux 8.3 For SAP With High Availability and Update Services
-
RedHat Linux 8.2 For SAP With High Availability and Update Services
-
RedHat Linux 8.1 For SAP With High Availability and Update Services
-
RedHat Linux 7.9 For SAP With High Availability and Update Services
Features
CloudWatch Application Insights for SAP HANA provides the following features:
-
Automatic SAP HANA workload detection
-
Automatic SAP HANA alarm creation based on static threshold
-
Automatic SAP HANA alarm creation based on anomaly detection
-
Automatic SAP HANA log pattern recognition
-
Health dashboard for SAP HANA
-
Problem dashboard for SAP HANA
Prerequisites
You must perform the following prerequisites to configure an SAP HANA database with CloudWatch Application Insights:
-
SAP HANA – Install a running and reachable SAP HANA database 2.0 SPS05 on an Amazon EC2 instance.
-
SAP HANA database user – A database user with monitoring roles must be created in the SYSTEM database and all tenants.
Example
The following SQL commands create a user with monitoring roles.
su -<sid>adm hdbsql -u SYSTEM -p<SYSTEMDB password>-d SYSTEMDB CREATE USER CW_HANADB_EXPORTER_USER PASSWORD<Monitoring user password>NO FORCE_FIRST_PASSWORD_CHANGE; CREATE ROLE CW_HANADB_EXPORTER_ROLE; GRANT MONITORING TO CW_HANADB_EXPORTER_ROLE; GRANT CW_HANADB_EXPORTER_ROLE TO CW_HANADB_EXPORTER_USER; -
Python 3.8 – Install Python 3.8 or later versions on your operating system. Use the latest release of Python. If Python3 is not detected on your operating system, Python 3.6 will be installed.
For more information, see the installation example.
Note
Manual installation of Python 3.8 or higher is required for SuSE Linux 15 SP4, RedHat Linux 8.6, and later operating systems.
-
Pip3 – Install the installer program, pip3, on your operating system. If pip3 is not detected on your operating system, it will be installed.
-
hdbclient – CloudWatch Application Insights uses the python driver to connect to the SAP HANA database. If the client is not installed under python3, ensure that you have hdbclient tar file version
2.10 or laterunder/hana/shared/SID/hdbclient/. -
Amazon CloudWatch agent – Make sure that you are not running a preexisting CloudWatch agent on your Amazon EC2 instance. If you have CloudWatch agent installed, make sure to remove the configuration of the resources you are using in CloudWatch Application Insights from the existing CloudWatch agent configuration file to avoid a merge conflict. For more information, see Manually create or edit the CloudWatch agent configuration file.
-
Amazon Systems Manager enablement – Install SSM Agent on your instances, and the instances must be enabled for SSM. For information about how to install the SSM Agent, see Working with SSM Agent in the Amazon Systems Manager User Guide.
-
Amazon EC2 instance roles – You must attach the following Amazon EC2 instance roles to configure your database.
-
You must attach the
AmazonSSMManagedInstanceCorerole to enable Systems Manager. For more information, see Amazon Systems Manager identity-based policy examples. -
You must attach the
CloudWatchAgentServerPolicyto enable instance metrics and logs to be emitted through CloudWatch. For more information, see Create IAM roles and users for use with CloudWatch agent. -
You must attach the following IAM inline policy to the Amazon EC2 instance role to read the password stored in Amazon Secrets Manager. For more information about inline policies, see Inline policies in the Amazon Identity and Access Management User Guide.
-
-
Amazon resource groups – You must create a resource group that includes all of the associated Amazon resources used by your application stack to onboard your applications to CloudWatch Application Insights. This includes Amazon EC2 instances and Amazon EBS volumes running your SAP HANA database. If there are multiple databases per account, we recommend that you create one resource group that includes the Amazon resources for each SAP HANA database system.
-
IAM permissions – For non-admin users:
-
You must create an Amazon Identity and Access Management (IAM) policy that allows Application Insights to create a service-linked role, and attach it to your user identity. For steps to attach the policy, see IAM policy for CloudWatch Application Insights.
-
The user must have permission to create a secret in Amazon Secrets Manager to store the database user credentials. For more information, see Example: Permission to create secrets.
-
-
Service-linked role – Application Insights uses Amazon Identity and Access Management (IAM) service-linked roles. A service-linked role is created for you when you create your first Application Insights application in the Application Insights console. For more information, see Using service-linked roles for CloudWatch Application Insights.
Set up your SAP HANA database for monitoring
Use the following steps to set up monitoring for your SAP HANA database
-
Open the CloudWatch console
. -
From the left navigation pane, under Insights, choose Application Insights.
-
The Application Insights page displays the list of applications that are monitored with Application Insights, and the monitoring status for each application. In the upper right-hand corner, choose Add an application.
-
On the Specify application details page, from the dropdown list under Resource group, select the Amazon resource group that contains your SAP HANA database resources. If you haven't created a resource group for your application, you can create one by choosing Create new resource group under the Resource group dropdown. For more information about creating resource groups, see the Amazon Resource Groups User Guide.
-
Under Monitor CloudWatch Events, select the check box to integrate Application Insights monitoring with CloudWatch Events to get insights from Amazon EBS, Amazon EC2, Amazon CodeDeploy, Amazon ECS, Amazon Health APIs and notifications, Amazon RDS, Amazon S3, and Amazon Step Functions.
-
Under Integrate with Amazon Systems Manager OpsCenter, select the check box next to Generate Amazon Systems Manager OpsCenter OpsItems for remedial actions to view and get notifications when problems are detected for the selected applications. To track the operations that are performed to resolve operational work items, called OpsItems, that are related to your Amazon resources, provide an SNS topic ARN.
-
You can optionally enter tags to help you identify and organize your resources. CloudWatch Application Insights supports both tag-based and Amazon CloudFormation stack-based resource groups, with the exception of Application Auto Scaling groups. For more information, see Tag Editor in the Amazon Resource Groups and Tags User Guide.
-
Choose Next to continue to set up monitoring.
-
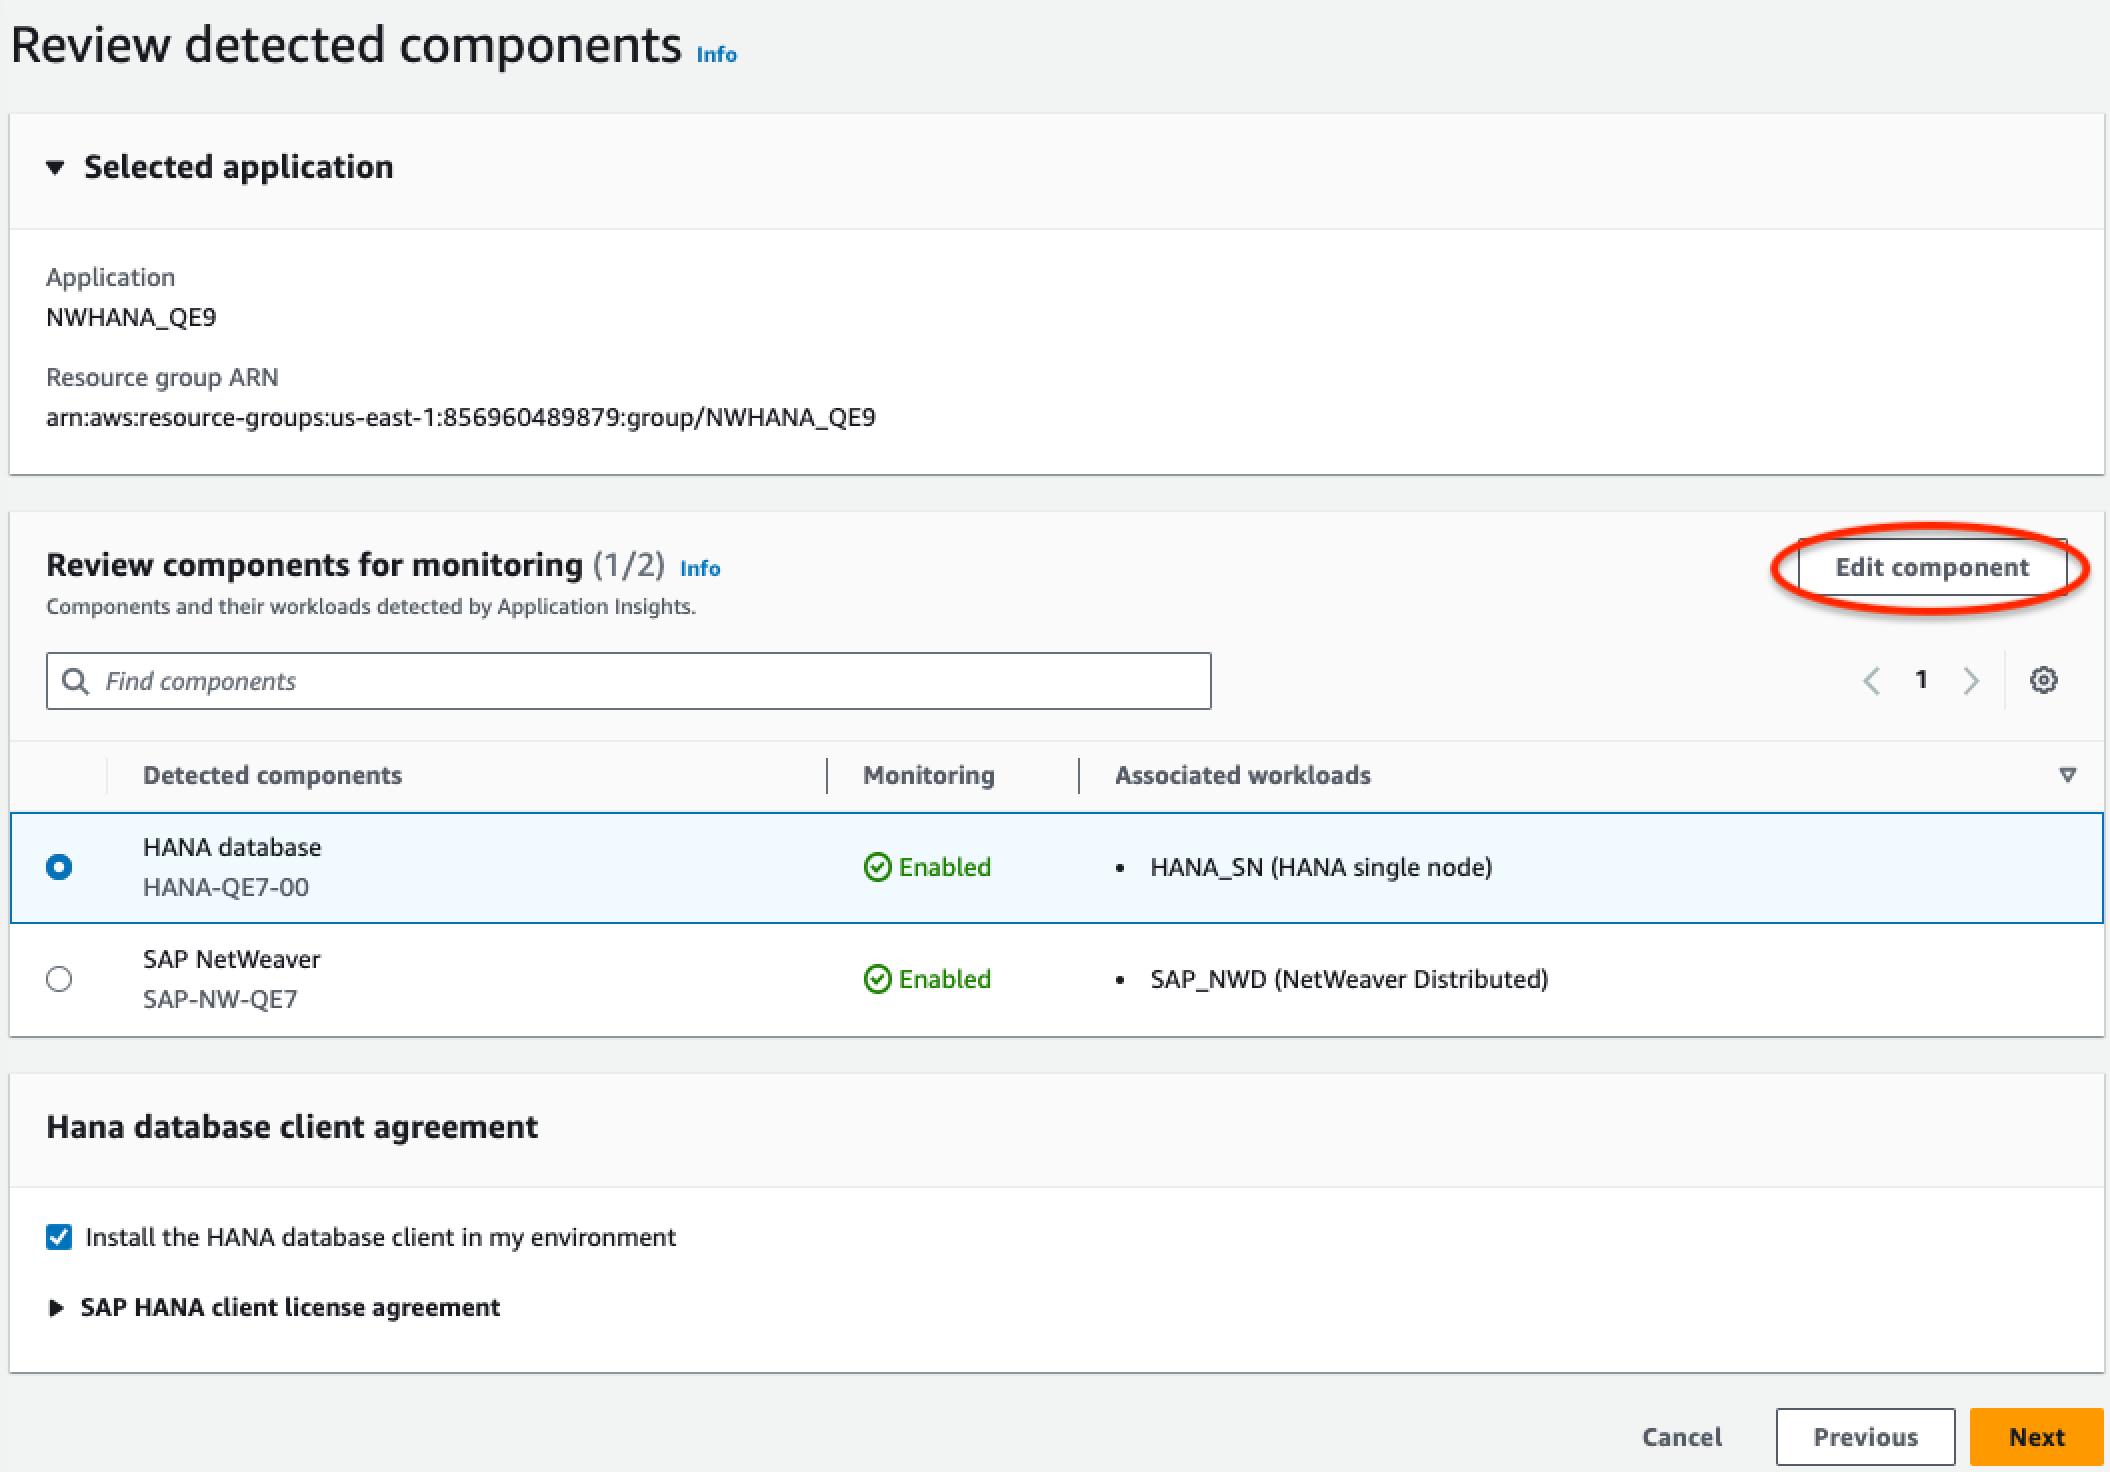
On the Review detected components page, the monitored components and their workloads automatically detected by CloudWatch Application Insights are listed.
-
To add workloads to a component that contains a detected SAP HANA single node workload, select the component, then choose Edit component.
Note
Components that contain a detected SAP HANA multi node or HANA High Availability workload support only one workload on a component.
-
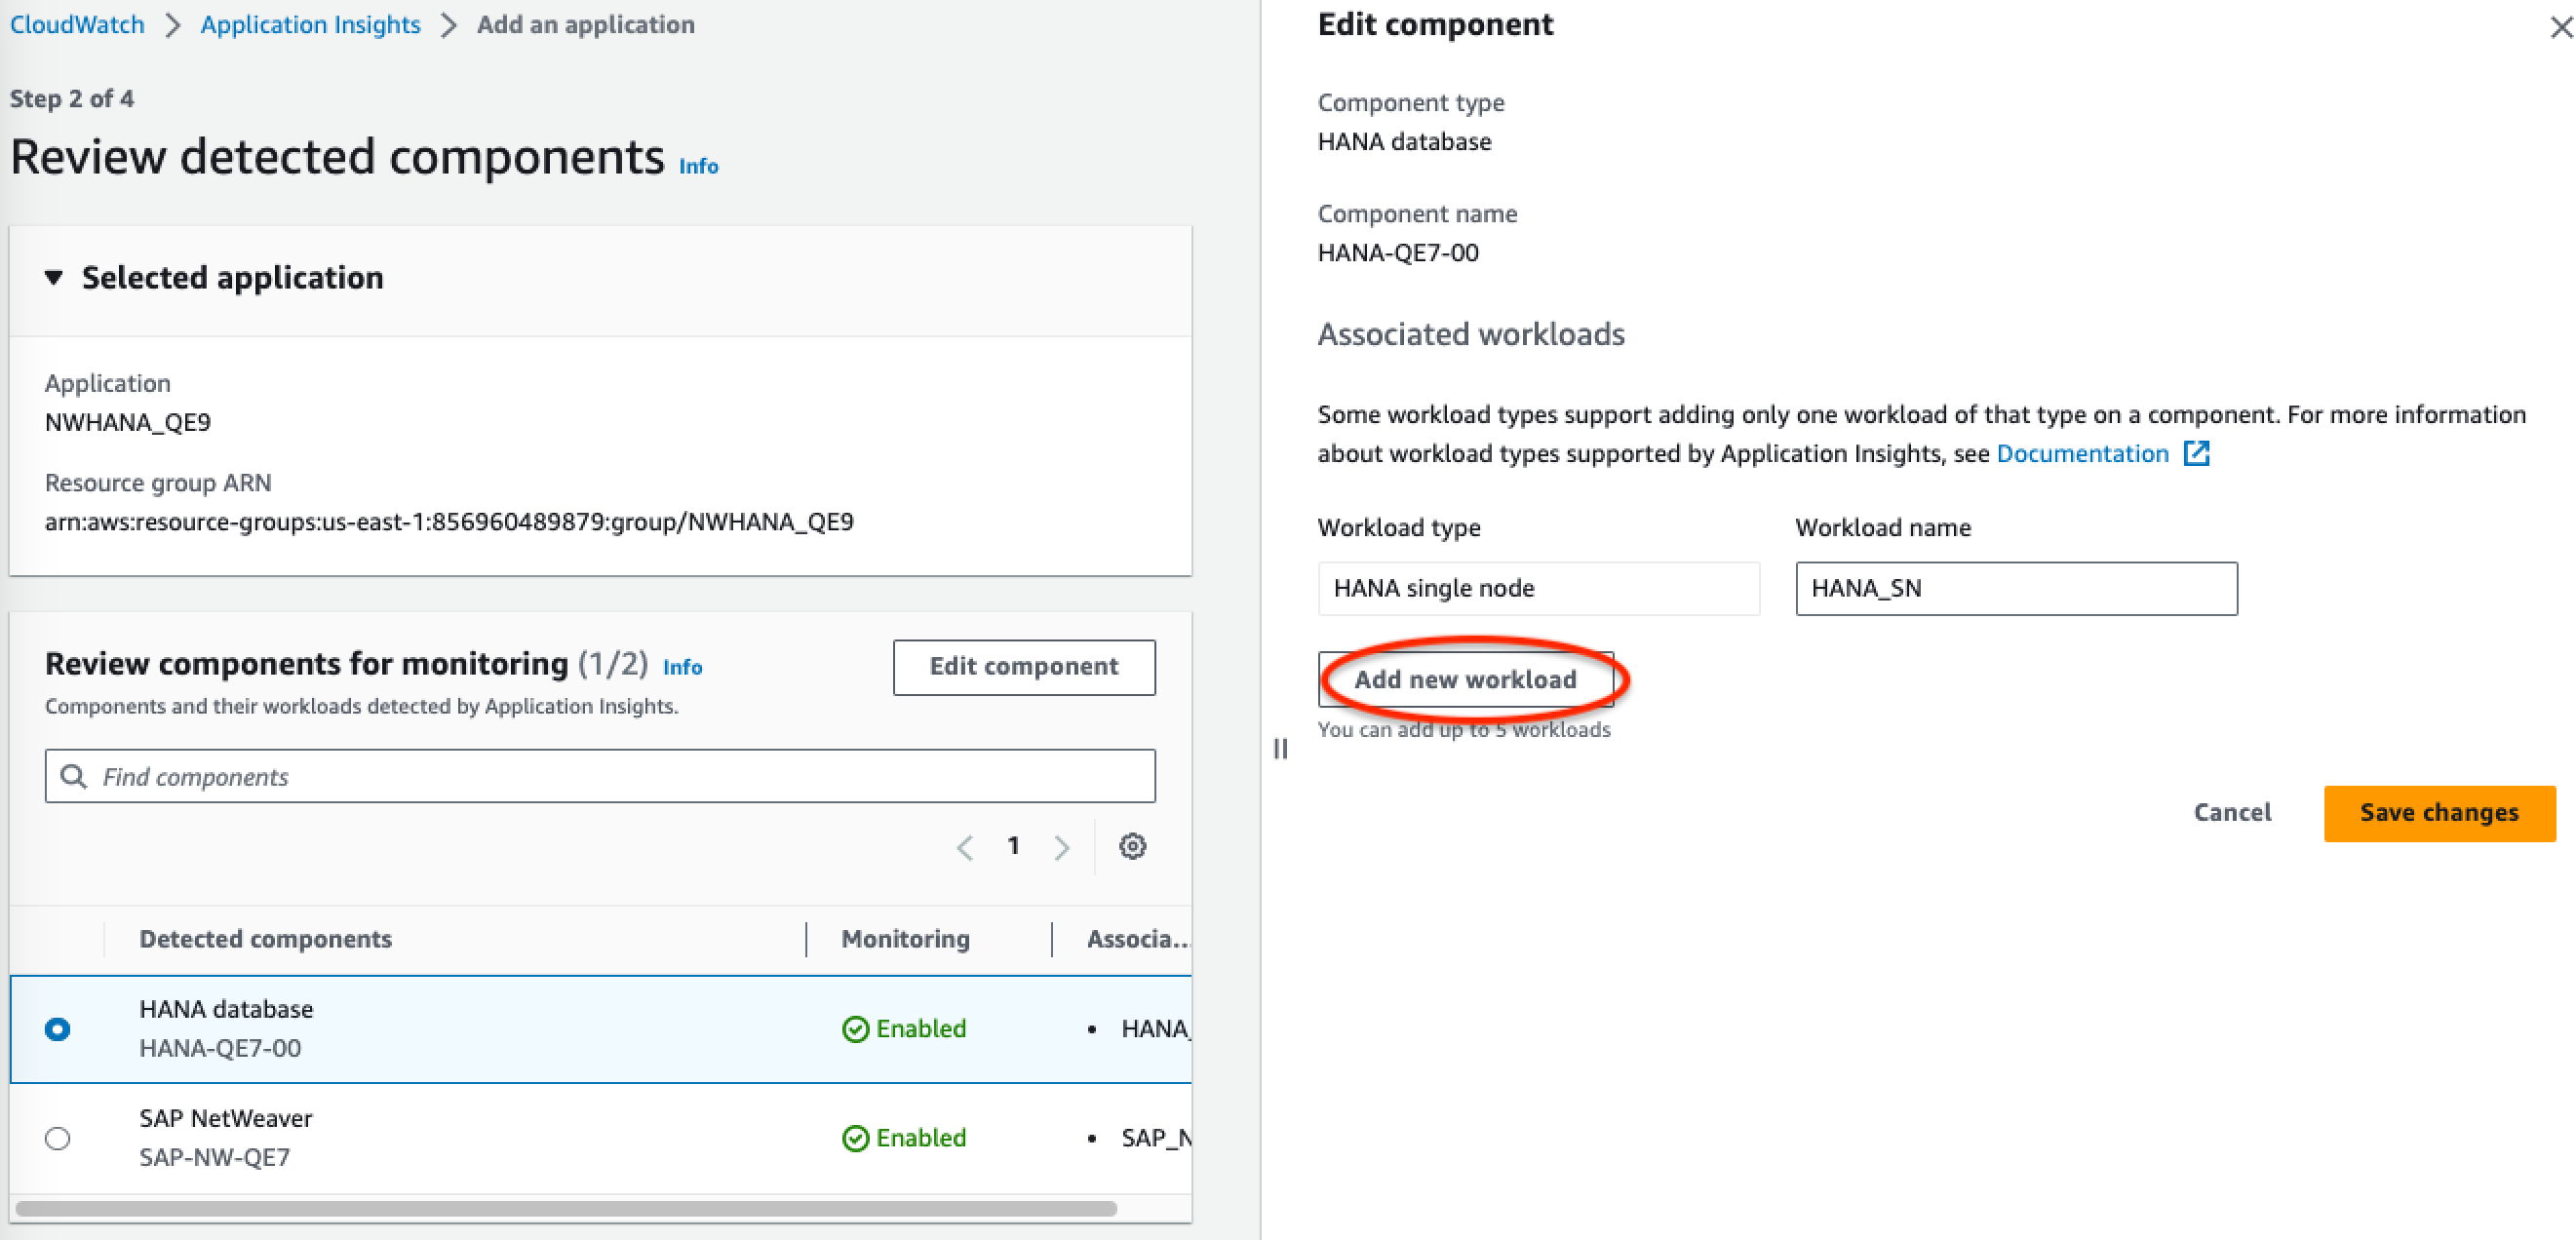
To add a new workload, choose Add new workload.
-
When you are finished editing workloads, choose Save changes.
-
-
Choose Next.
-
On the Specify component details page, enter the username and password.
-
Review your application monitoring configuration, and choose Submit.
-
The application details page opens, where you can view the Application summary, the list of Monitored components and workloads, and Unmonitored components and workloads. If you select the radio button next to a component or workload, you can also view the Configuration history, Log patterns, and any Tags that you have created. When you submit your configuration, your account deploys all of the metrics and alarms for your SAP HANA system, which can take up to 2 hours.
Manage monitoring of your SAP HANA database
You can manage user credentials, metrics, and log paths for your SAP HANA database by performing the following steps:
-
Open the CloudWatch console
. -
From the left navigation pane, under Insights, choose Application Insights.
-
The Application Insights page displays the list of applications that are monitored with Application Insights, and the monitoring status for each application.
-
Under Monitored components, select the radio button next to the component name. Then, choose Manage monitoring.
-
Under EC2 instance group logs, you can update the existing log path, log pattern set, and log group name. In addition, you can add up to three additional Application logs.
-
Under Metrics, you can choose the SAP HANA metrics according to your requirements. SAP HANA metric names are prefixed with
hanadb. You can add up to 40 metrics per component. -
Under HANA configuration, enter the password and user name for the SAP HANA database. This is the username and password that Amazon CloudWatch agent uses to connect to the SAP HANA database.
-
Under Custom alarms, you can add additional alarms to be monitored by CloudWatch Application Insights.
-
Review your application monitoring configuration and choose Submit. When you submit your configuration, your account updates all of the metrics and alarms for your SAP HANA system, which can take up to 2 hours.
View and troubleshoot SAP HANA problems detected by CloudWatch Application Insights
The following sections provide steps to help you resolve common troubleshooting scenarios that occur when you configure monitoring for SAP HANA on Application Insights.
Troubleshooting topics
SAP HANA database reaches memory allocation limit
Description
Your SAP application that is backed by an SAP HANA database malfunctions because of high memory pressure, leading to application performance degradation.
Resolution
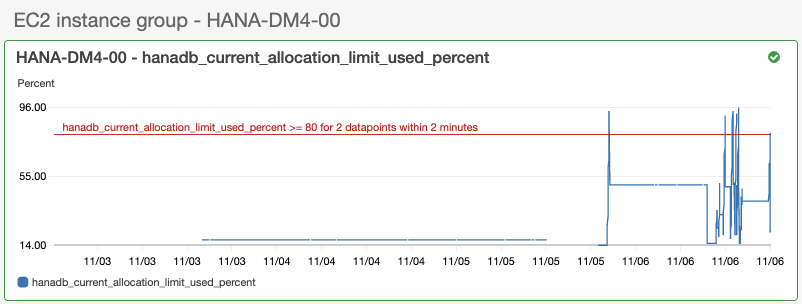
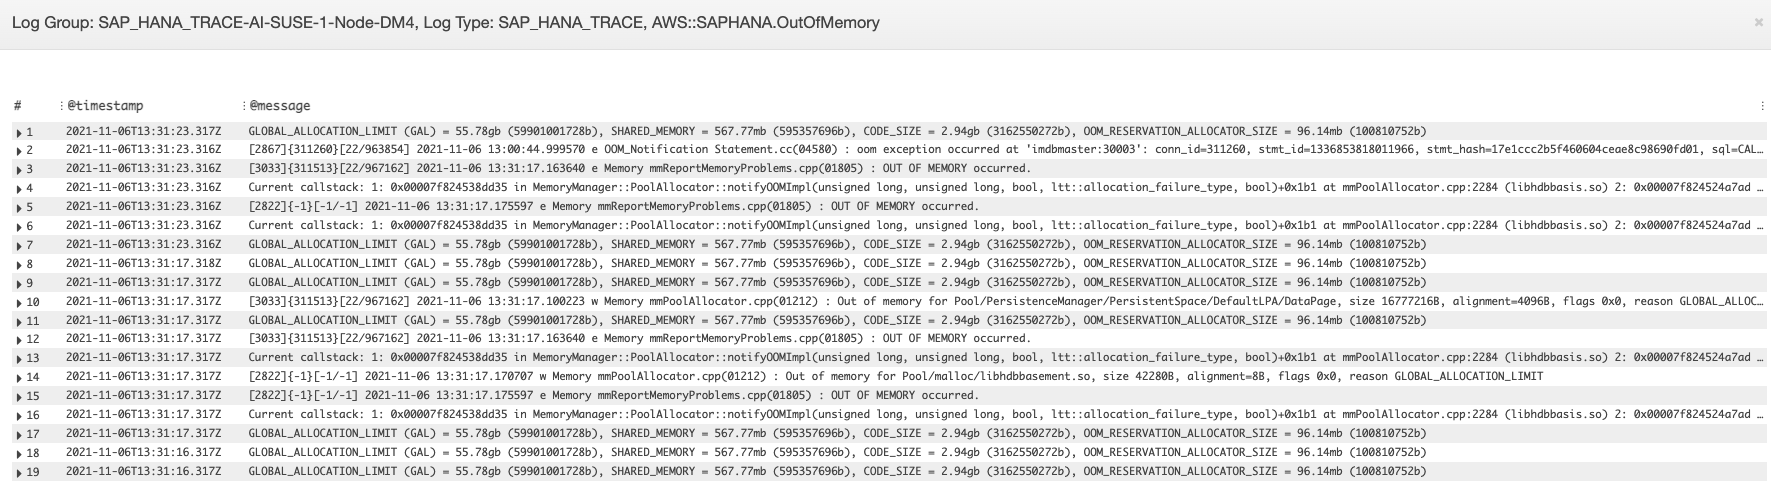
You can identify the application layer that is causing the problem by checking the dynamically created dashboard, which shows the related metrics and log file snippets. In the following example, the problem may be because of a large data load in the SAP HANA system.
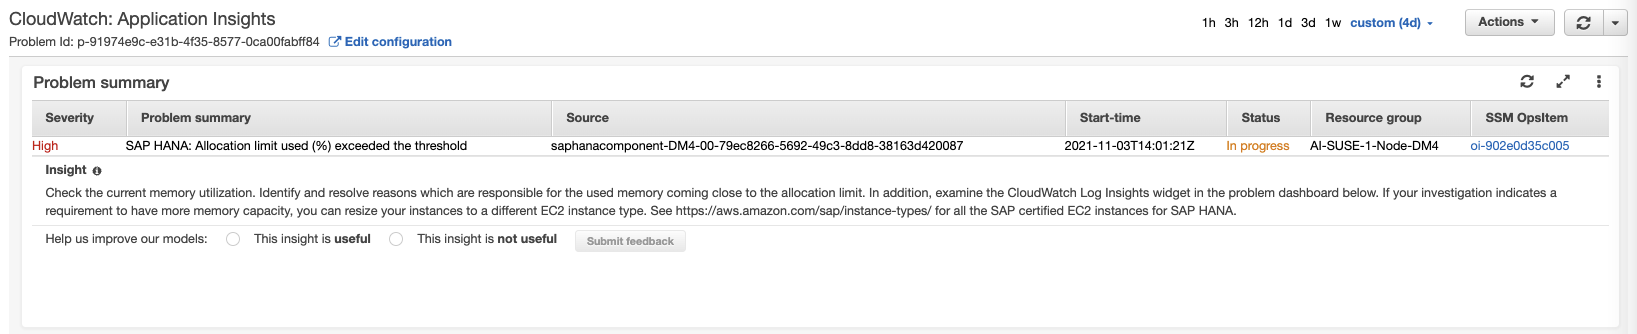
The used memory allocation exceeds the threshold of 80 percent of the total memory allocation limit.
The log group shows the scheme BNR-DATA and table
IMDBMASTER_30003 ran out of memory. In addition, the log group
shows the exact time of the issue, current global location limit, shared memory,
code size, and OOM reservation allocation size.
Disk full event
Description
Your SAP application that is backed by an SAP HANA database stops responding, which leads to an inability to access the database.
Resolution
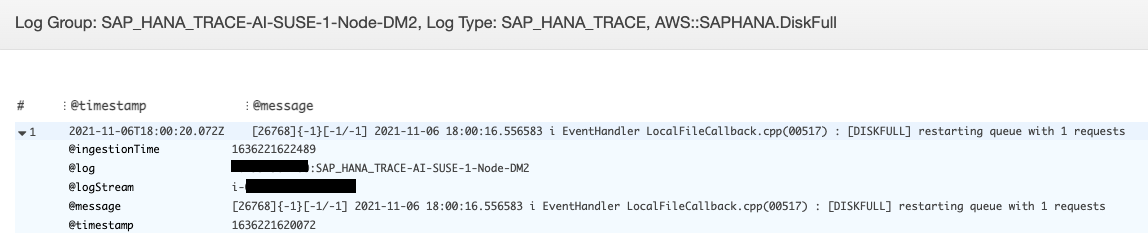
You can identify the database layer that is causing the problem by checking the dynamically created dashboard, which shows the related metrics and log file snippets. In the following example, the problem may be that the administrator failed to enable automatic log backup, which caused the sap/hana/log directory to fill up.
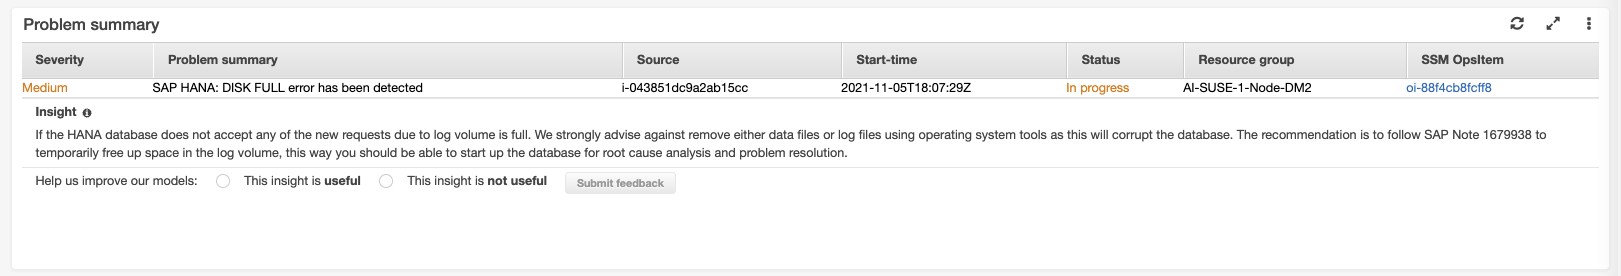
The log group widget in the problem dashboard shows the DISKFULL
event.
SAP HANA backup stopped running
Description
Your SAP application that is backed by an SAP HANA database has stopped working.
Resolution
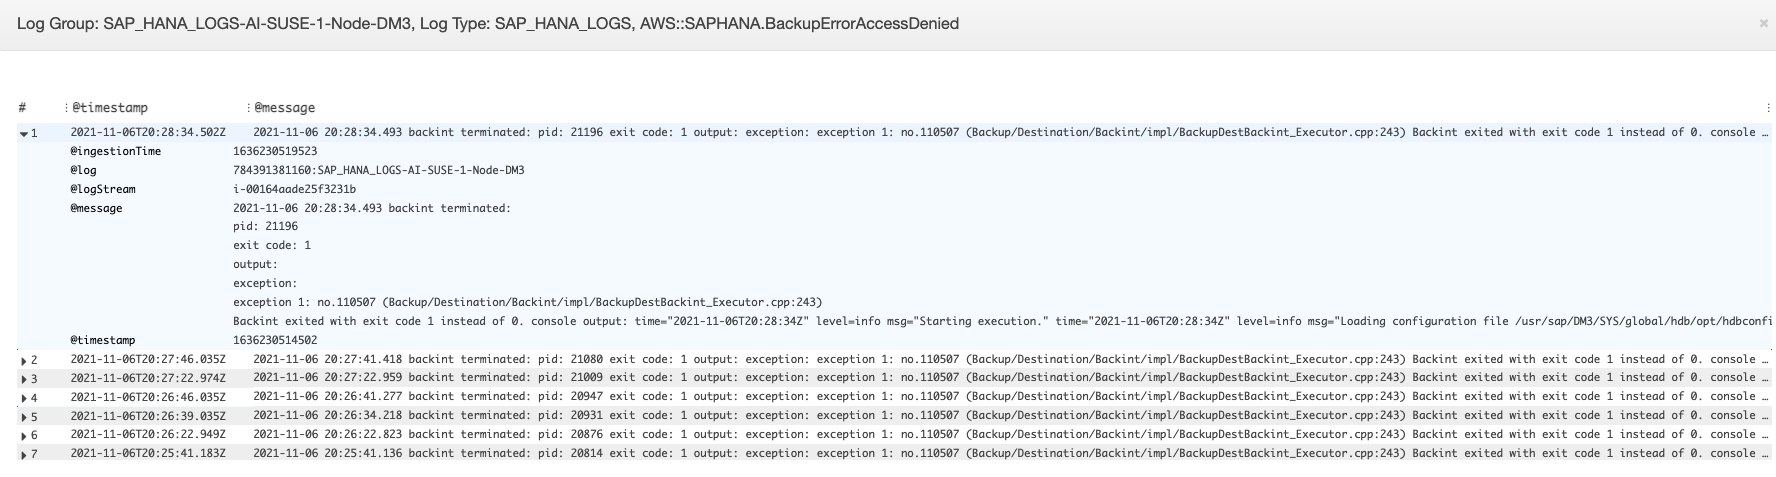
You can identify the database layer that is causing the problem by checking the dynamically created dashboard, which shows the related metrics and log file snippets.
The log group widget in the problem dashboard shows the ACCESS
DENIED event. This includes additional information, such as the S3
bucket, the S3 bucket folder, and the S3 bucket Region.
Anomaly detection for SAP HANA
For specific SAP HANA metrics, such as the number of thread count, CloudWatch applies statistical and machine learning algorithms to define the threshold. These algorithms continuously analyze the metrics of the SAP HANA database, determine normal baselines, and surface anomalies with minimal user intervention. The algorithms generate an anomaly detection model, which generates a range of expected values that represent normal metric behavior.
Anomaly detection algorithms account for the seasonality and trend changes of metrics. The seasonality changes can be hourly, daily, or weekly, as shown in the following examples of the SAP HANA CPU usage.
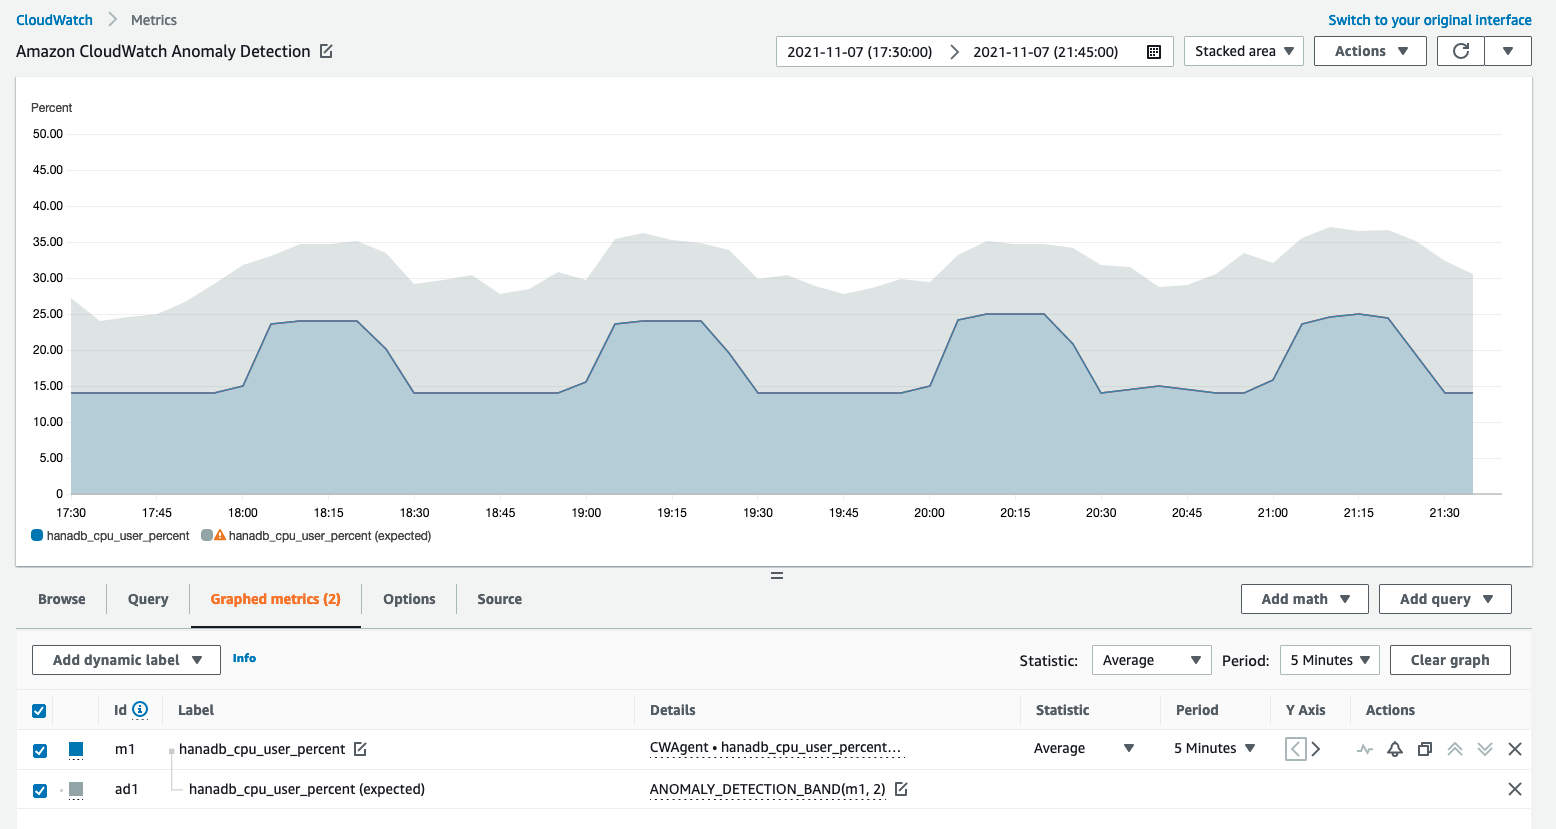
After you create a model, CloudWatch anomaly detection continuously evaluates the model and makes adjustments to it to ensure that is it as accurate as possible. This includes retraining the model to adjust if the metric values evolve over time or experience sudden changes. It also includes predictors to improve the models for metrics that are seasonal, spiky, or sparse.
Troubleshooting Application Insights for SAP HANA
This section provides steps to help you resolve common errors returned by the Application Insights dashboard.
Unable to add more than 60 monitored metrics
The output shows the following error.
Component cannot have more than 60 monitored metrics
Root cause – The current metric limit is 60 monitored metrics per component.
Resolution – To stay under the limit, remove metrics that are not necessary.
No SAP metrics appear after the onboarding process
Use the following information to find out why SAP metrics don't appear on the dashboard after the onboarding process. The first step is to troubleshoot why the SAP metrics don't appear using the Amazon Web Services Management Console or Exporter logs from an Amazon EC2 instance. Next, review the error output to find a resolution.
Troubleshoot why SAP metrics don't appear after onboarding
You can use the Amazon Web Services Management Console or exporter logs from an Amazon EC2 instance for troubleshooting.
Resolving the common root causes for SAP metrics not appearing after onboarding
The following examples describe how to resolve the common root causes of SAP metrics not appearing after onboarding.
-
The output shows the following error.
Reading json config file path: /opt/aws/amazon-cloudwatch-agent/etc/amazon-cloudwatch-agent.d/default ...
Reading json config file path: /opt/aws/amazon-cloudwatch-agent/etc/amazon-cloudwatch-agent.d/ssm_AmazonCloudWatch-ApplicationInsights-SSMParameterForTESTCWEC2INSTANCEi0d88867f1f3e36285.tmp ...
2023/11/30 22:25:17 Failed to merge multiple json config files.
2023/11/30 22:25:17 Failed to merge multiple json config files.
2023/11/30 22:25:17 Under path : /metrics/append_dimensions | Error : Different values are specified for append_dimensions
2023/11/30 22:25:17 Under path : /metrics/metrics_collected/disk | Error : Different values are specified for disk
2023/11/30 22:25:17 Under path : /metrics/metrics_collected/mem | Error : Different values are specified for mem
2023/11/30 22:25:17 Configuration validation first phase failed. Agent version: 1.0. Verify the JSON input is only using features supported by this version.
Resolution – Application Insights is trying to configure the same metrics that are pre-configured as part of the existing CloudWatch agent configuration file. Remove the existing files under
/opt/aws/amazon-cloudwatch-agent/etc/amazon-cloudwatch-agent.d/or remove the metrics that are causing the conflict from the existing CloudWatch agent configuration file. -
The output shows the following error.
Unable to find a host with system database, for more info rerun using -v
Resolution – The username, password, or database port may be incorrect. Verify that the username, password, and port are valid, then re-run the onboarding process.
-
The output shows the following error.
This hdbcli installer is not compatible with your Python interpreter
Resolution – Upgrade pip3 and wheel as shown in the following example for Python 3.6.
python3.6 -m pip install --upgrade pip setuptools wheel -
The output shows the following error.
Unable to install hdbcli using pip3. Please try to install it
Resolution – Ensure that you have followed the
hdbclientprerequisites or installhdbclientmanually under pip3. -
The output shows the following error.
Package 'boto3' requires a different Python: 3.6.15 not in '>= 3.7'
Resolution – Python 3.8 or higher is required for this operating system version. Check the Python 3.8 prerequisites and install it.
-
The output shows one of the following installation errors.
Can not execute `setup.py` since setuptools is not available in the build environment
or
[SSL: CERTIFICATE_VERIFY_FAILED]
Resolution – Install Python using SUSE Linux commands as shown in the following example. The following example installs the latest version of Python 3.8
. wget https://www.python.org/ftp/python/3.8.<LATEST_RELEASE>/Python-3.8.<LATEST_RELEASE>.tgz tar xf Python-3.* cd Python-3.*/ sudo zypper install make gcc-c++ gcc automake autoconf libtool sudo zypper install zlib-devel sudo zypper install libopenssl-devel libffi-devel ./configure --with-ensurepip=install sudo make sudo make install sudo su python3.8 -m pip install --upgrade pip setuptools wheel