Troubleshooting Metrics Insights
The results include "Other," but I don't have this as a dimension
This means that the query includes a GROUP BY clause that
specifies a label key that is not used in some of the metrics that are returned by the
query. In this case, a null group named Other is returned. The metrics that
do not include that label key are probably aggregated metrics that return values
aggregated across all values of that label key.
For example, suppose we have the following query:
SELECT AVG(Faults)
FROM MyCustomNamespace
GROUP BY Operation, ServiceName
If some of the returned metrics don't include ServiceName as a dimension,
then those metrics are displayed as having Other as the value for
ServiceName.
To prevent seeing "Other" in your results, use SCHEMA in your FROM clause, as in the following example:
SELECT AVG(Faults)
FROM SCHEMA(MyCustomNamespace, Operation)
GROUP BY Operation, ServiceName
This limits the returned results to only the metrics that have both the
Operation and ServiceName dimensions.
The oldest timestamp in my graph has a lower metric value than the others
CloudWatch Metrics Insights supports up to two weeks of historical data. When you graph with a period larger than one minute, there could be cases where the oldest data point differs from the expected value. This is because the CloudWatch Metrics Insights queries return only data within the two-week retention period. In this case, the oldest data point in the query returns only the observations that have been measured within the two-week boundary, instead of returning all the observations within the period of that data point.
Inconsistent metric values across different time periods when using tag-based queries
When you use WHERE or GROUP BY clauses with tags in CloudWatch Metrics Insights
queries, you might see different metric values depending on the selected time period. For
example, a 6-hour period might show a peak value of 20, while a 1-hour period shows only 2
for the same time window.
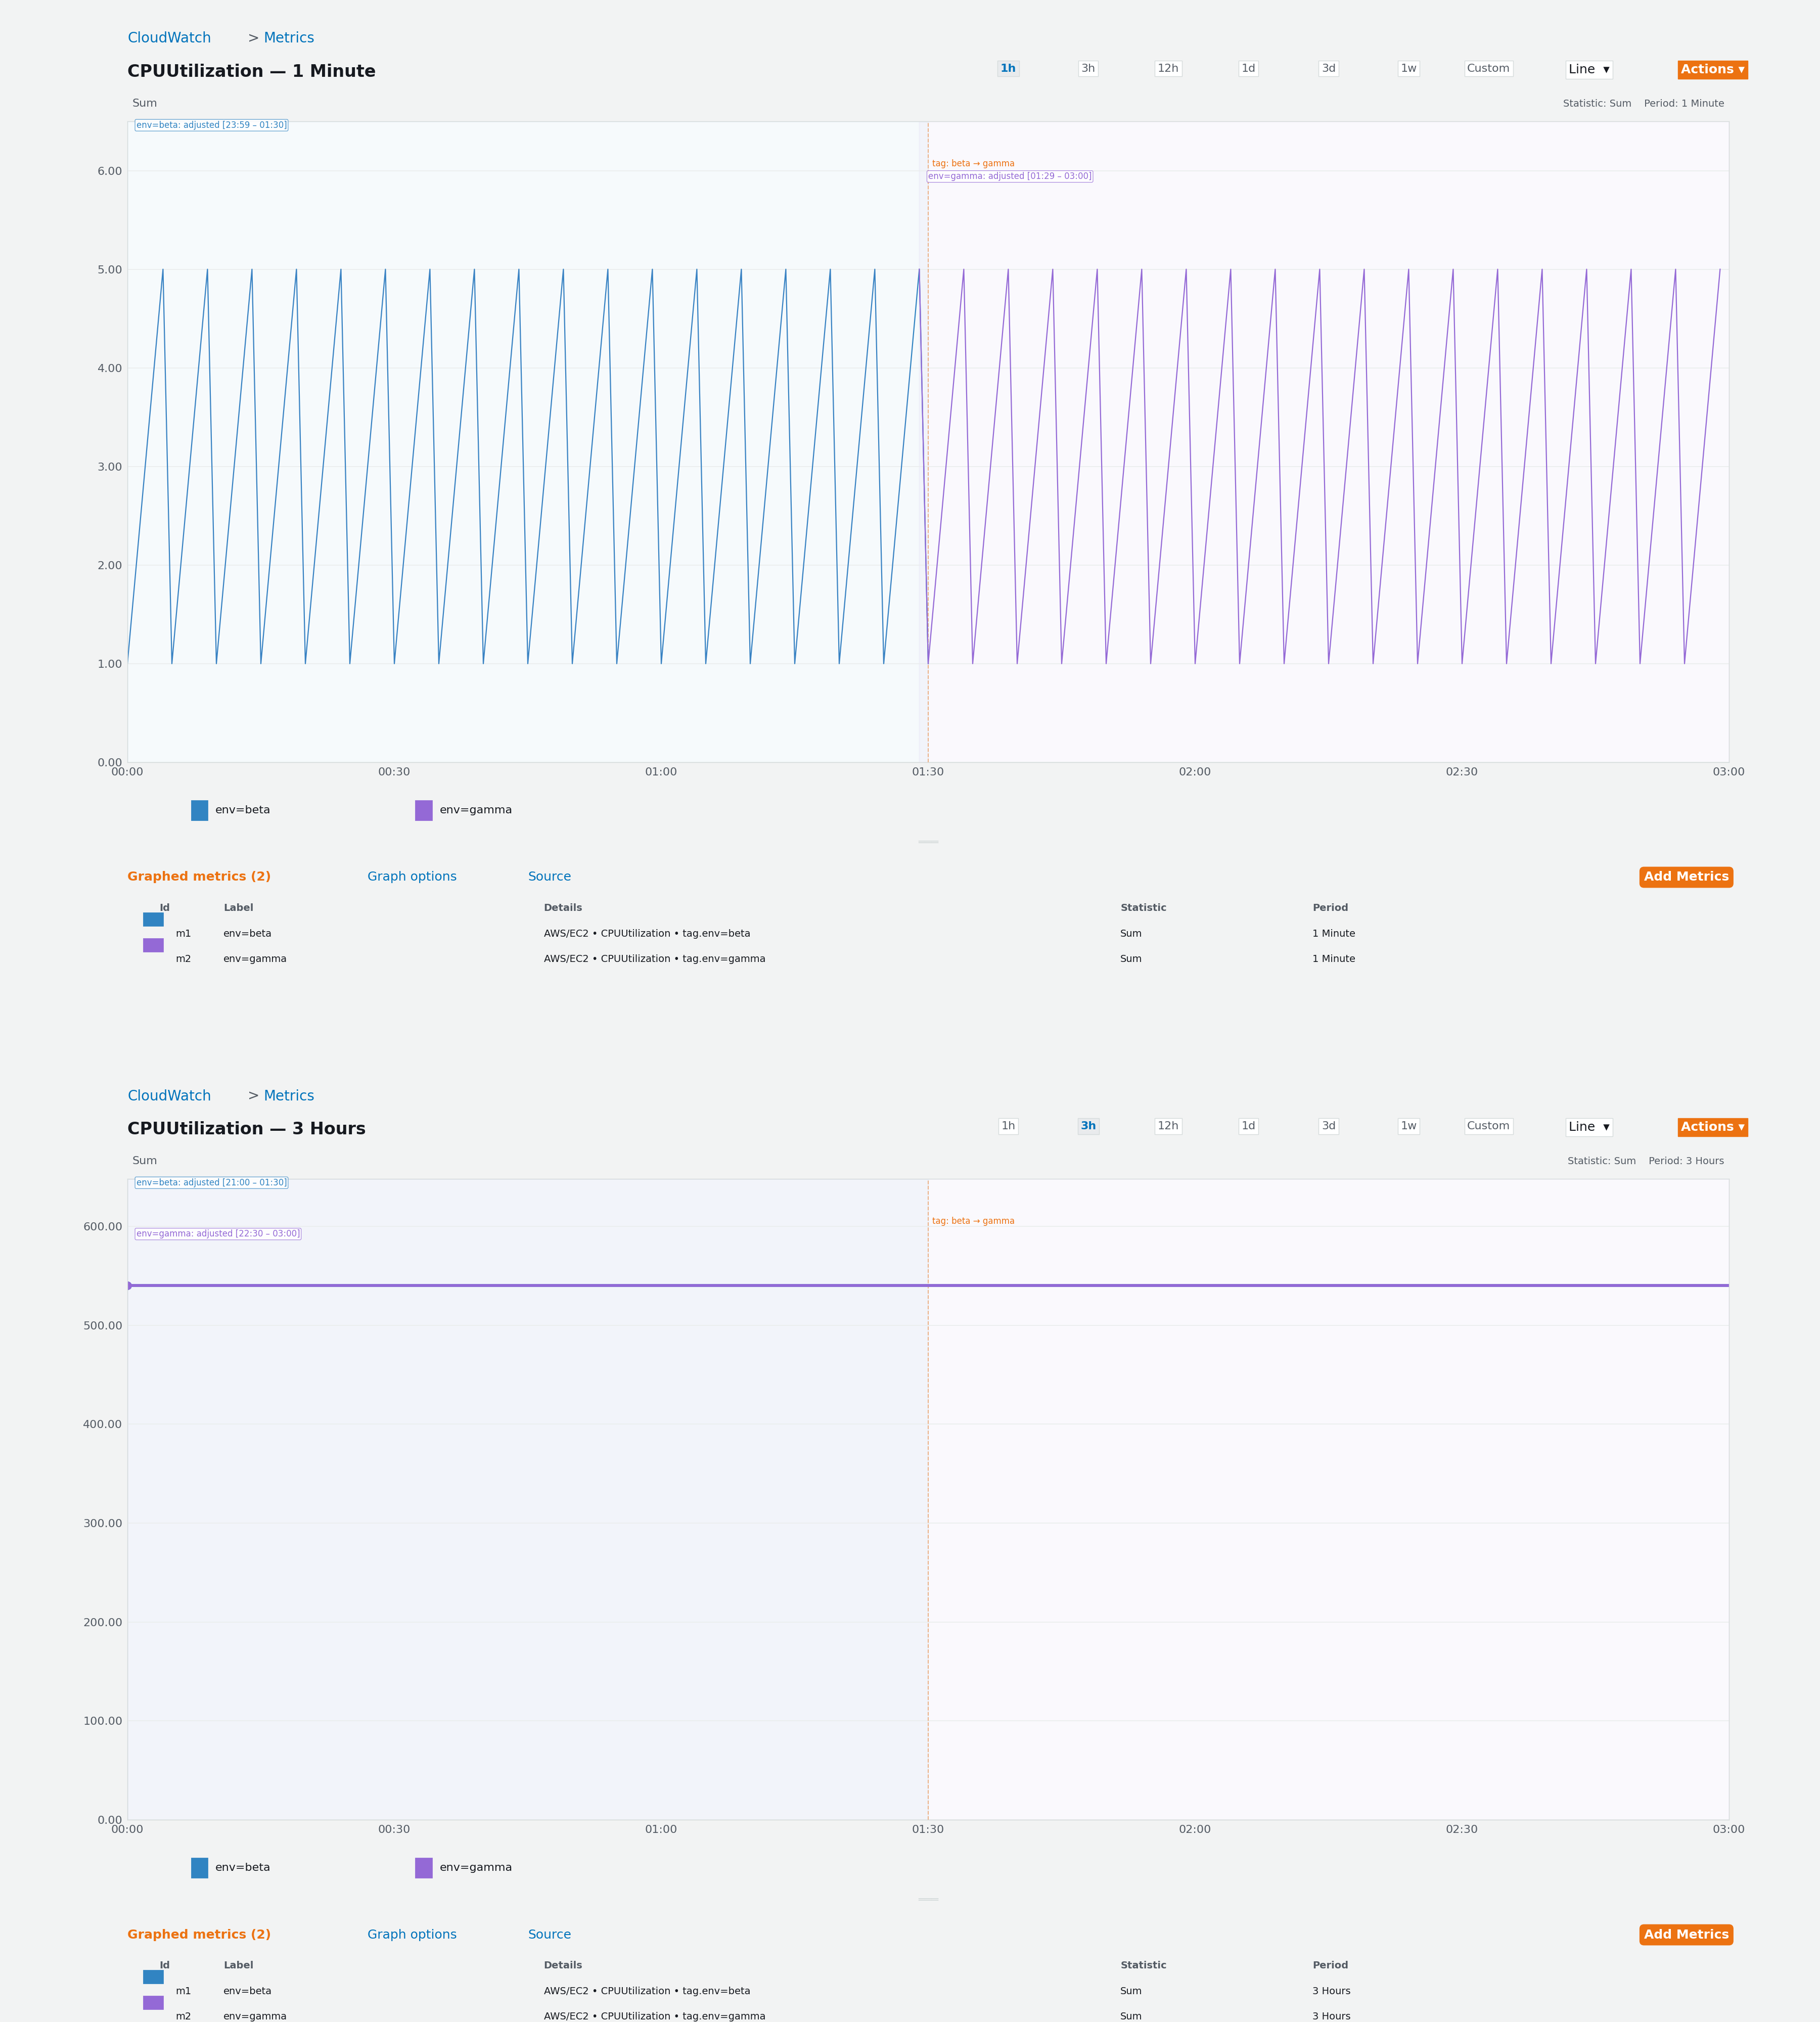
This occurs because tag timestamps are stored with second-level resolution, while metric data points are aligned to period boundaries (for example, the start of each minute or hour). To determine which data points match a tag time range, CloudWatch adjusts the start of the range by subtracting one period. With larger periods, this adjustment creates a wider gap between the tag timestamp and the earliest included data point, which can cause data points near the start of the range to be excluded.
The following example shows how this affects query results. A metric has two tag
values: env=beta (from 00:00 to 01:30) and env=gamma (from
01:30 to 03:00). Each tag covers 90 minutes of data with a SUM of 270.
| env=beta with 1-minute period | |||
|---|---|---|---|
| Statistic | Expected | Returned | Difference |
| SUM | 270 | 271 | +1 |
| AVG | 3.0 | 3.0 | 0 |
| MIN | 1 | 1 | 0 |
| MAX | 5 | 5 | 0 |
| SAMPLE_COUNT | 90 | 91 | +1 |
| env=gamma with 1-minute period | |||
|---|---|---|---|
| Statistic | Expected | Returned | Difference |
| SUM | 270 | 275 | +5 |
| AVG | 3.0 | 3.0 | 0 |
| MIN | 1 | 1 | 0 |
| MAX | 5 | 5 | 0 |
| SAMPLE_COUNT | 90 | 91 | +1 |
With a 1-minute period, the alignment adjustment is small (1 minute), so only 1 extra data point is included per tag. With a 3-hour period, the adjustment spans the entire query range:
| env=beta with 3-hour period | |||
|---|---|---|---|
| Statistic | Expected | Returned | Difference |
| SUM | 270 | 540 | +270 |
| AVG | 3.0 | 3.0 | 0 |
| MIN | 1 | 1 | 0 |
| MAX | 5 | 5 | 0 |
| SAMPLE_COUNT | 90 | 180 | +90 |
| env=gamma with 3-hour period | |||
|---|---|---|---|
| Statistic | Expected | Returned | Difference |
| SUM | 270 | 540 | +270 |
| AVG | 3.0 | 3.0 | 0 |
| MIN | 1 | 1 | 0 |
| MAX | 5 | 5 | 0 |
| SAMPLE_COUNT | 90 | 180 | +90 |
With the 3-hour period, both tags return the entire dataset (SUM=540, SAMPLE_COUNT=180) because the single aggregated data point's timestamp falls within both adjusted ranges. The tag boundary is effectively erased.
To reduce the impact of this behaviour, try the following approaches:
-
Use smaller aggregation periods. Smaller periods (such as 1 minute or 5 minutes) more closely match the second-level resolution of tag timestamps, which minimizes the alignment gap and makes it more likely that all relevant data points are included.
-
Use dimension-based filtering instead of tags. If your use case allows it, filter by dimensions rather than tags. Dimension-based queries are not affected by this behaviour. For example, use
WHERE InstanceId = 'i-1234567890abcdef0'instead ofWHERE tag."my-tag" = 'my-value'. -
Query at a consistent granularity. When comparing metric data across different time windows, use the same period to avoid unexpected differences caused by the alignment adjustment.