Monitoring Aurora Limitless databases with Database Insights
Database Insights supports monitoring Aurora PostgreSQL Limitless Databases at both the fleet and instance levels. Your Aurora PostgreSQL Limitless Databases are discoverable in both the Database Instance Dashboard and the Fleet Health Dashboard.
Aurora PostgreSQL Limitless Databases use shard groups. Each shard group consists of multiple database instances that work together to process distributed workloads. Database Insights helps you understand the load distribution among the instances within a shard group.
In the Fleet Health Dashboard, Database Insights provides monitoring of your Limitless shard groups together with the rest of databases that make up your database fleets. You can get an opinionated view of health and DBLoad utlilization for your Limitless shard groups in the same way you do for other databases in the fleet. In the Instance Dashboard, Database Insights provides monitoring at both the shard group level and for individual instances within the group. Database Insights provides a new view per shard group where you can see database load distributed across the instances in the shard group. From there, you can navigate to the specific instance dashboard within a shard group.
Available features for Aurora Limitless
The following table displays the features available for Aurora PostgreSQL Limitless databases. They indicate whether each feature is supported in the Standard and Advanced monitoring modes, and whether they are available at the Shard Group level, the instance level, and whether they are available in the Fleet or the Instance Dashboard of Database Insights.
| Feature | Standard | Advanced | ShardGroup | Instance | Database Insights dashboard |
|---|---|---|---|---|---|
| Analyze the top contributors to DB Load by dimension | Supported | Supported | Yes | Yes | Instance |
| Query, graph, and set alarms on database metrics with up to 7 days of retention | Supported | Supported | Yes | Yes | Instance |
| Define fine‐grained access control policies to restrict access to potentially sensitive dimensions such as SQL text | Supported | Supported | Yes | Yes | Instance |
| Use the Load Distribution component to analyze load distribution across instances within the same shard group | Supported | Supported | Yes | No | Instance |
|
Analyze operating system processes happening in your databases with detailed metrics per running process Amazon RDS Enhanced Monitoring is required for this feature to work. |
Not supported | Supported | No | Yes | Instance |
| Create and save fleet‐wide monitoring views to assess health across hundreds of databases | Not supported | Supported | Yes | No | Fleet |
| Analyze SQL locks with 15 months of retention and a guided UX | Not supported | Not supported | No | No | Instance |
| Analyze SQL execution plans with 15 months of retention and guided UX | Not supported | Not supported | No | No | Instance |
| Visualize per‐query statistics | Not supported | Supported | No | Yes | Instance |
| Analyze slow SQL queries Export of database logs to CloudWatch Logs is required for this feature to work. |
Not supported | Supported | No | Yes | Instance |
| View calling services with CloudWatch Application Signals | Not supported | Supported | Yes | No | Both |
| View a consolidated dashboard for all database telemetry, including
metrics, logs, events, and applications Export of database logs to CloudWatch Logs is required to view database logs in the Database Insights console. |
Not supported | Supported | No | Yes | Instance |
| Import Performance Insights counter metrics into CloudWatch automatically | Not supported | Supported | N/A | N/A | Instance |
| View Amazon RDS events in CloudWatch | Not supported | Supported | Yes | No | Both |
| Analyze database performance for a time period of your choice with on‐demand analysis | Not supported | Not supported | No | No | Instance |
Note
Enhanced Monitoring is automatically enabled for Aurora PostgreSQL Limitless Databases. Enhanced Monitoring incurs additional charges. For more information, see Cost of Enhanced Monitoring.
For Aurora PostgreSQL Limitless Databases, logs are automatically published to CloudWatch Logs
and are discoverable in the Database Insights console. This incurs additional charges,
following standard CloudWatch Logs pricing. For details about how CloudWatch Logs and Database Insights are priced
and pricing examples, see Amazon CloudWatch
pricing
Monitoring Aurora Limitless shard groups in the Fleet Health Dashboard
Database Insights supports monitoring Aurora Limitless shard groups in the Fleet Health Dashboard.
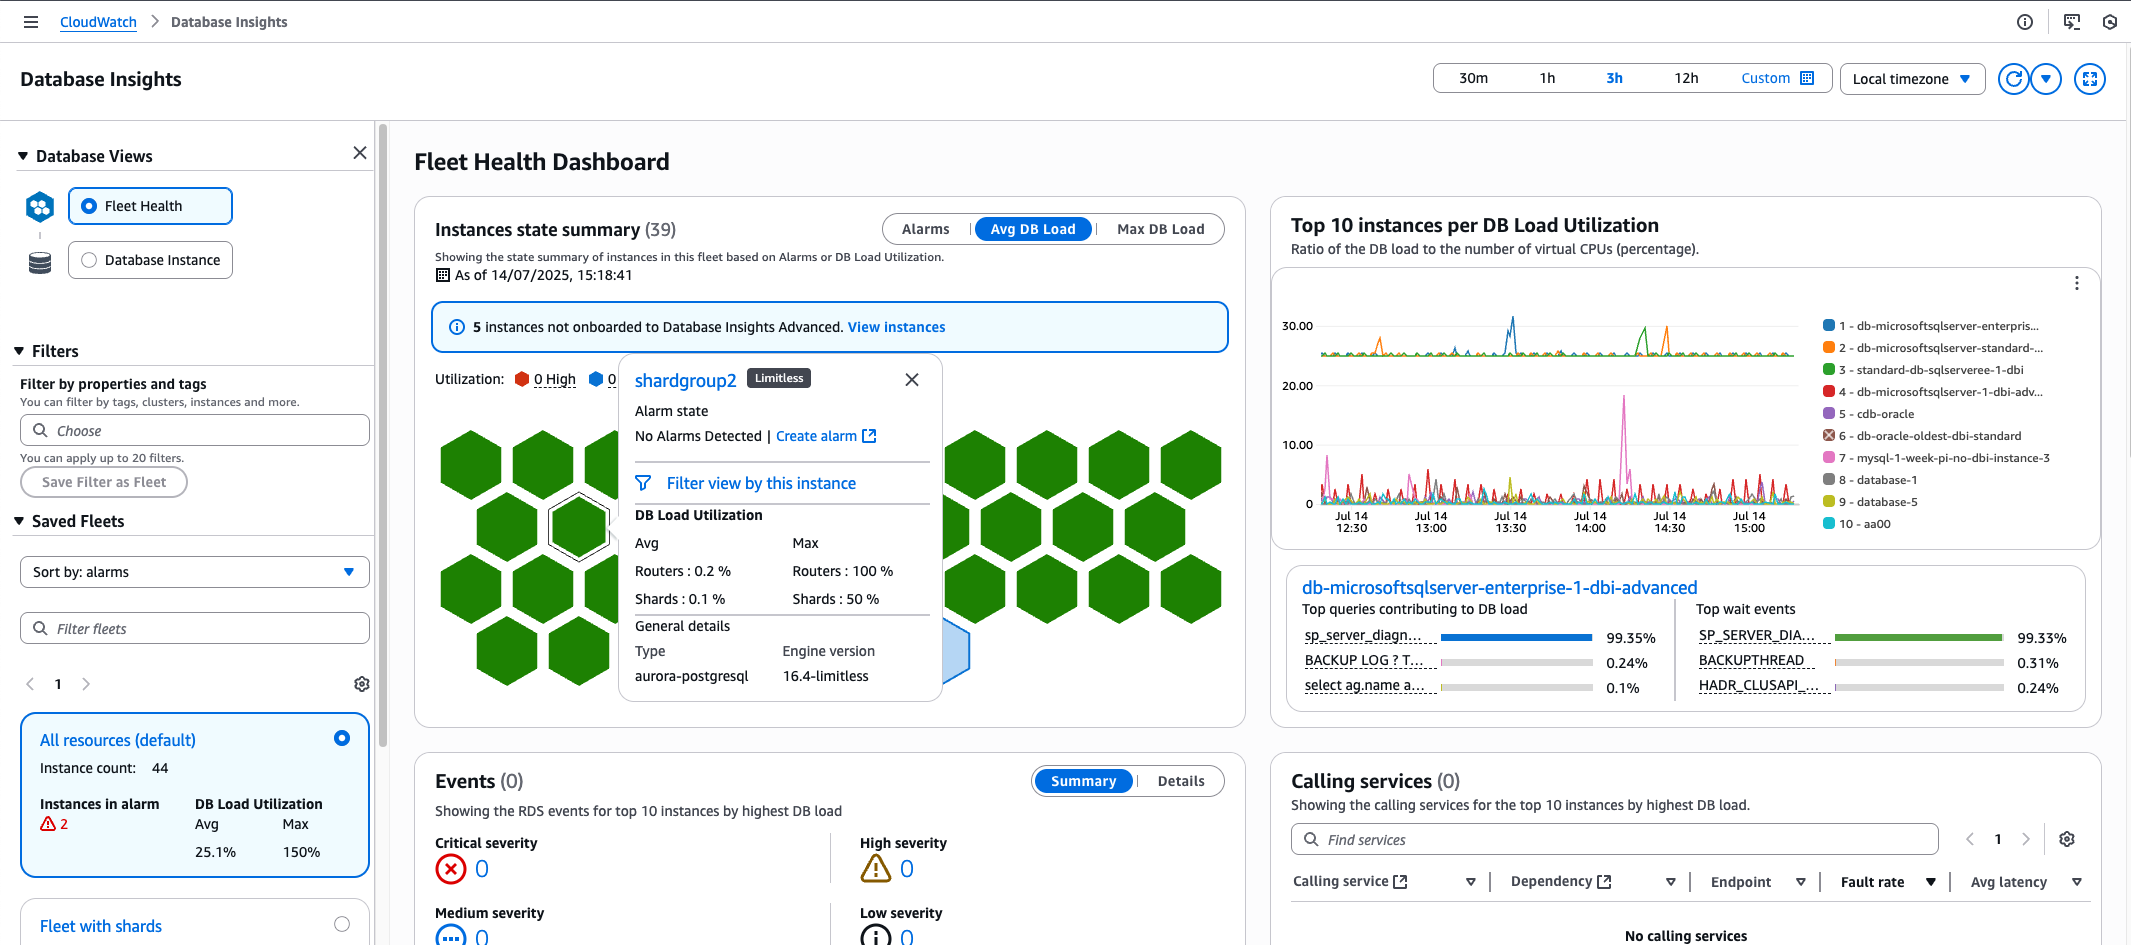
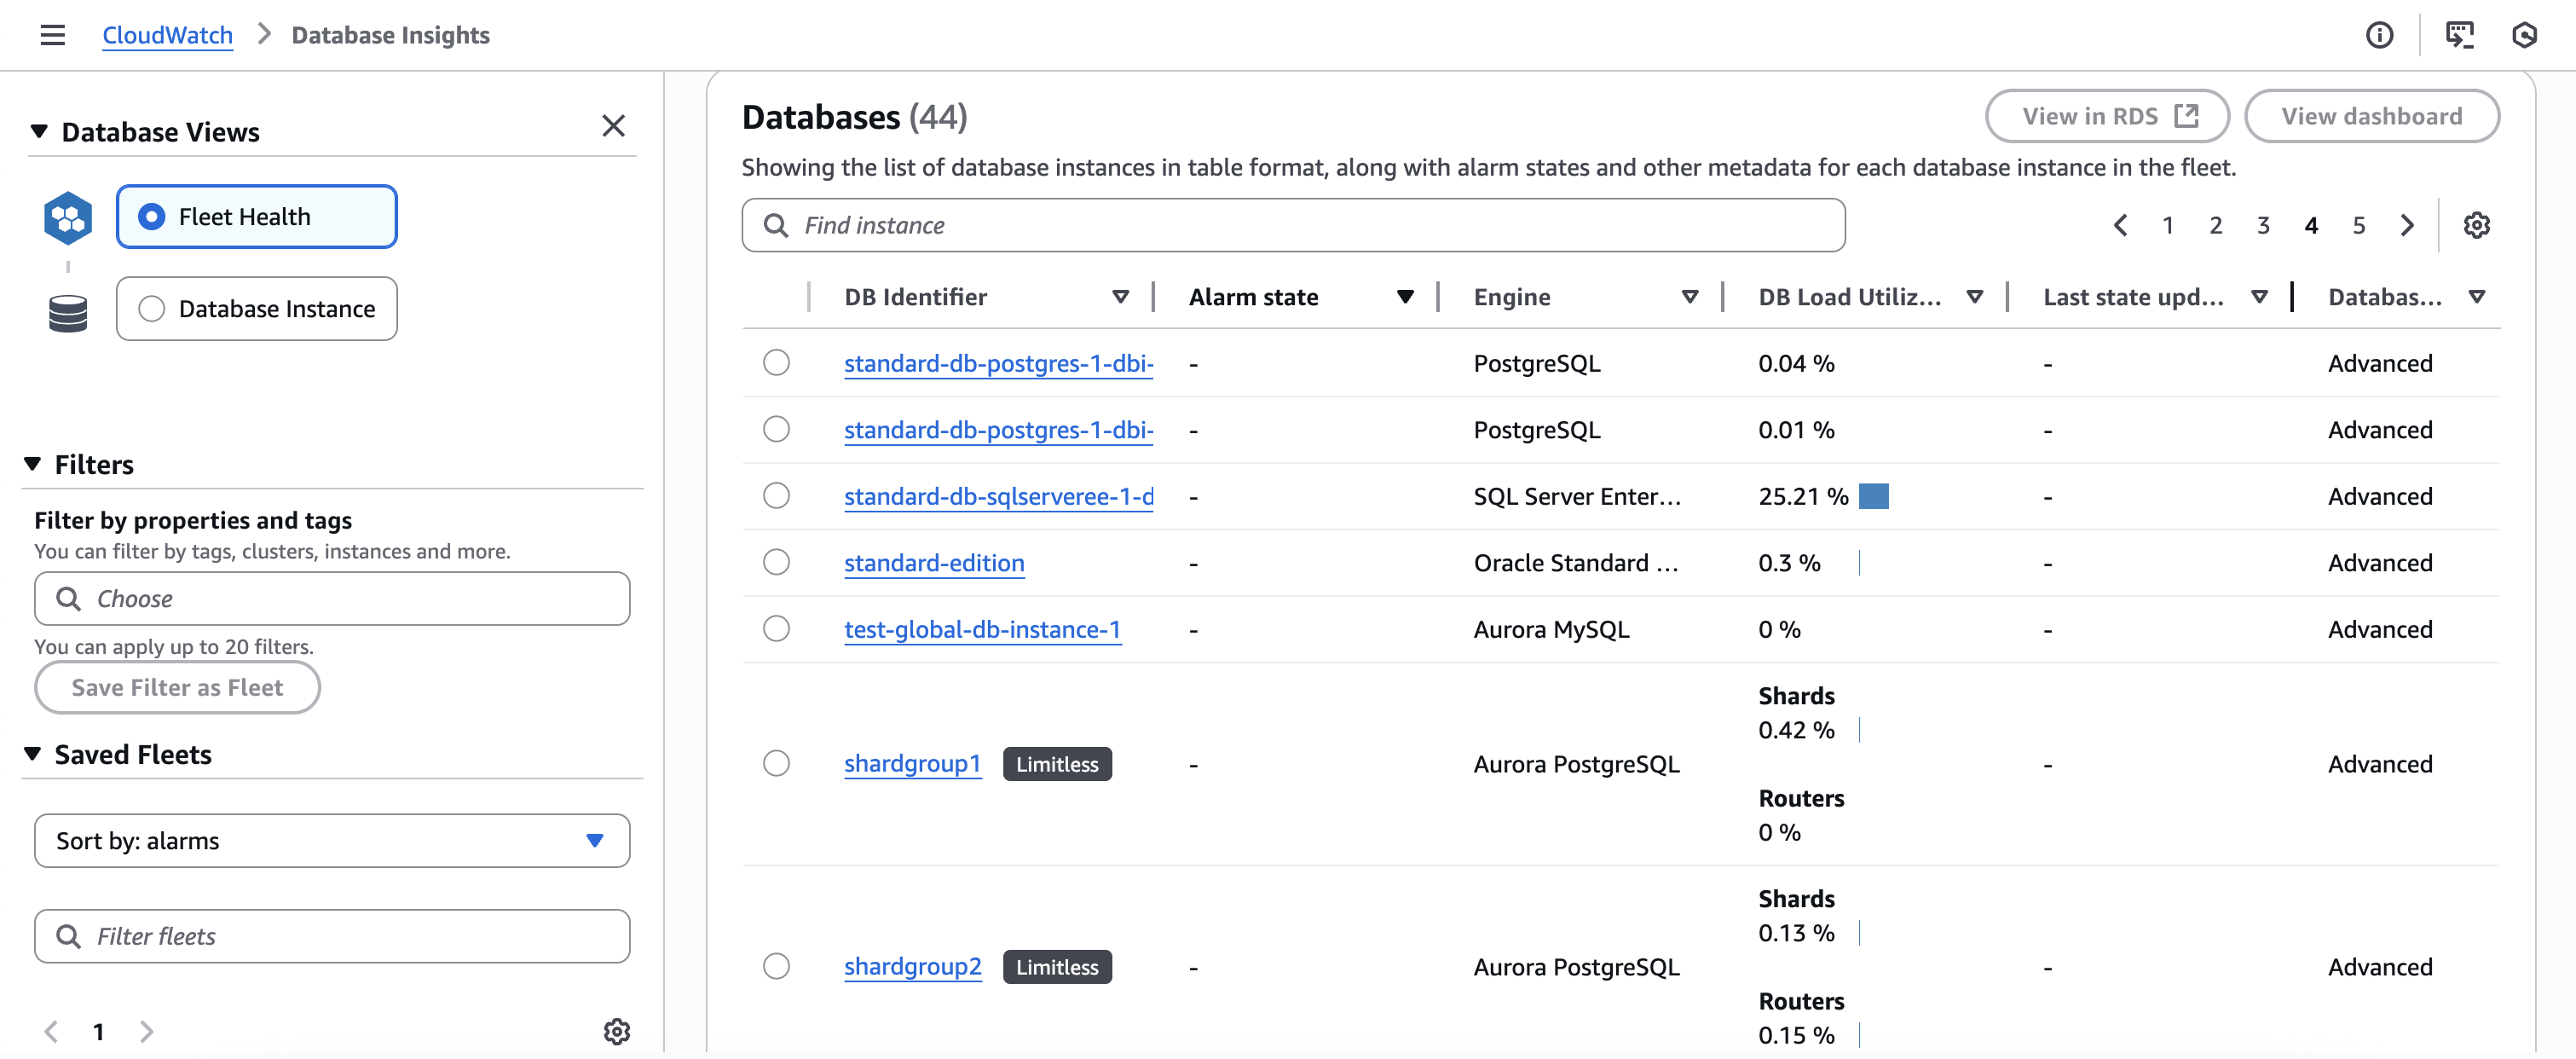
In this view, you can see your Limitless shard groups alongside other databases that make up your database fleets. The Fleet Health Dashboard provides an opinionated view of health and DBLoad utilization for your Limitless shard groups, similar to how it presents information for other databases in the fleet.

When viewing Aurora Limitless databases in the Fleet Health Dashboard:
-
Only shard groups are visible, not individual instances
-
Shard groups appear in the following widgets:
-
The honeycomb chart
-
The top 10 by DBLoad
-
Events
-
Calling Services
-
The table list
-
-
DBLoad utilization is provided for both routers and shards
This fleet-level view allows you to monitor and compare the performance of your Aurora Limitless shard groups with other databases in your fleet, providing a comprehensive overview of your entire database fleet.

Monitoring Aurora PostgreSQL Limitless Databases in the Instance Dashboard
Database Insights works similarly for Aurora PostgreSQL Limitless Database as it does for standard Aurora DB clusters. However, you track metrics at the shard group level for Aurora PostgreSQL Limitless Database. The two main metrics to track are the following:
-
Database load – Measures the level of activity in your database. The key metric is
DBLoad, which is collected every second. The unit for theDBLoadmetric is average active sessions (AAS). To get the average active sessions, Database Insights samples the number of sessions concurrently running a query. The AAS is the total number of sessions divided by the total number of samples for a specific time period. -
Maximum CPU – The maximum computational power available to your database. To see whether active sessions are exceeding the maximum CPU, look at their relationship to the
Max
                        vCPU
line. TheMax vCPUvalue is determined by the number of vCPU (virtual CPU) cores for your DB instance.
You can also "slice" the DBLoad metric into dimensions, which are
subcategories of the metric. The most useful dimensions are the following:
-
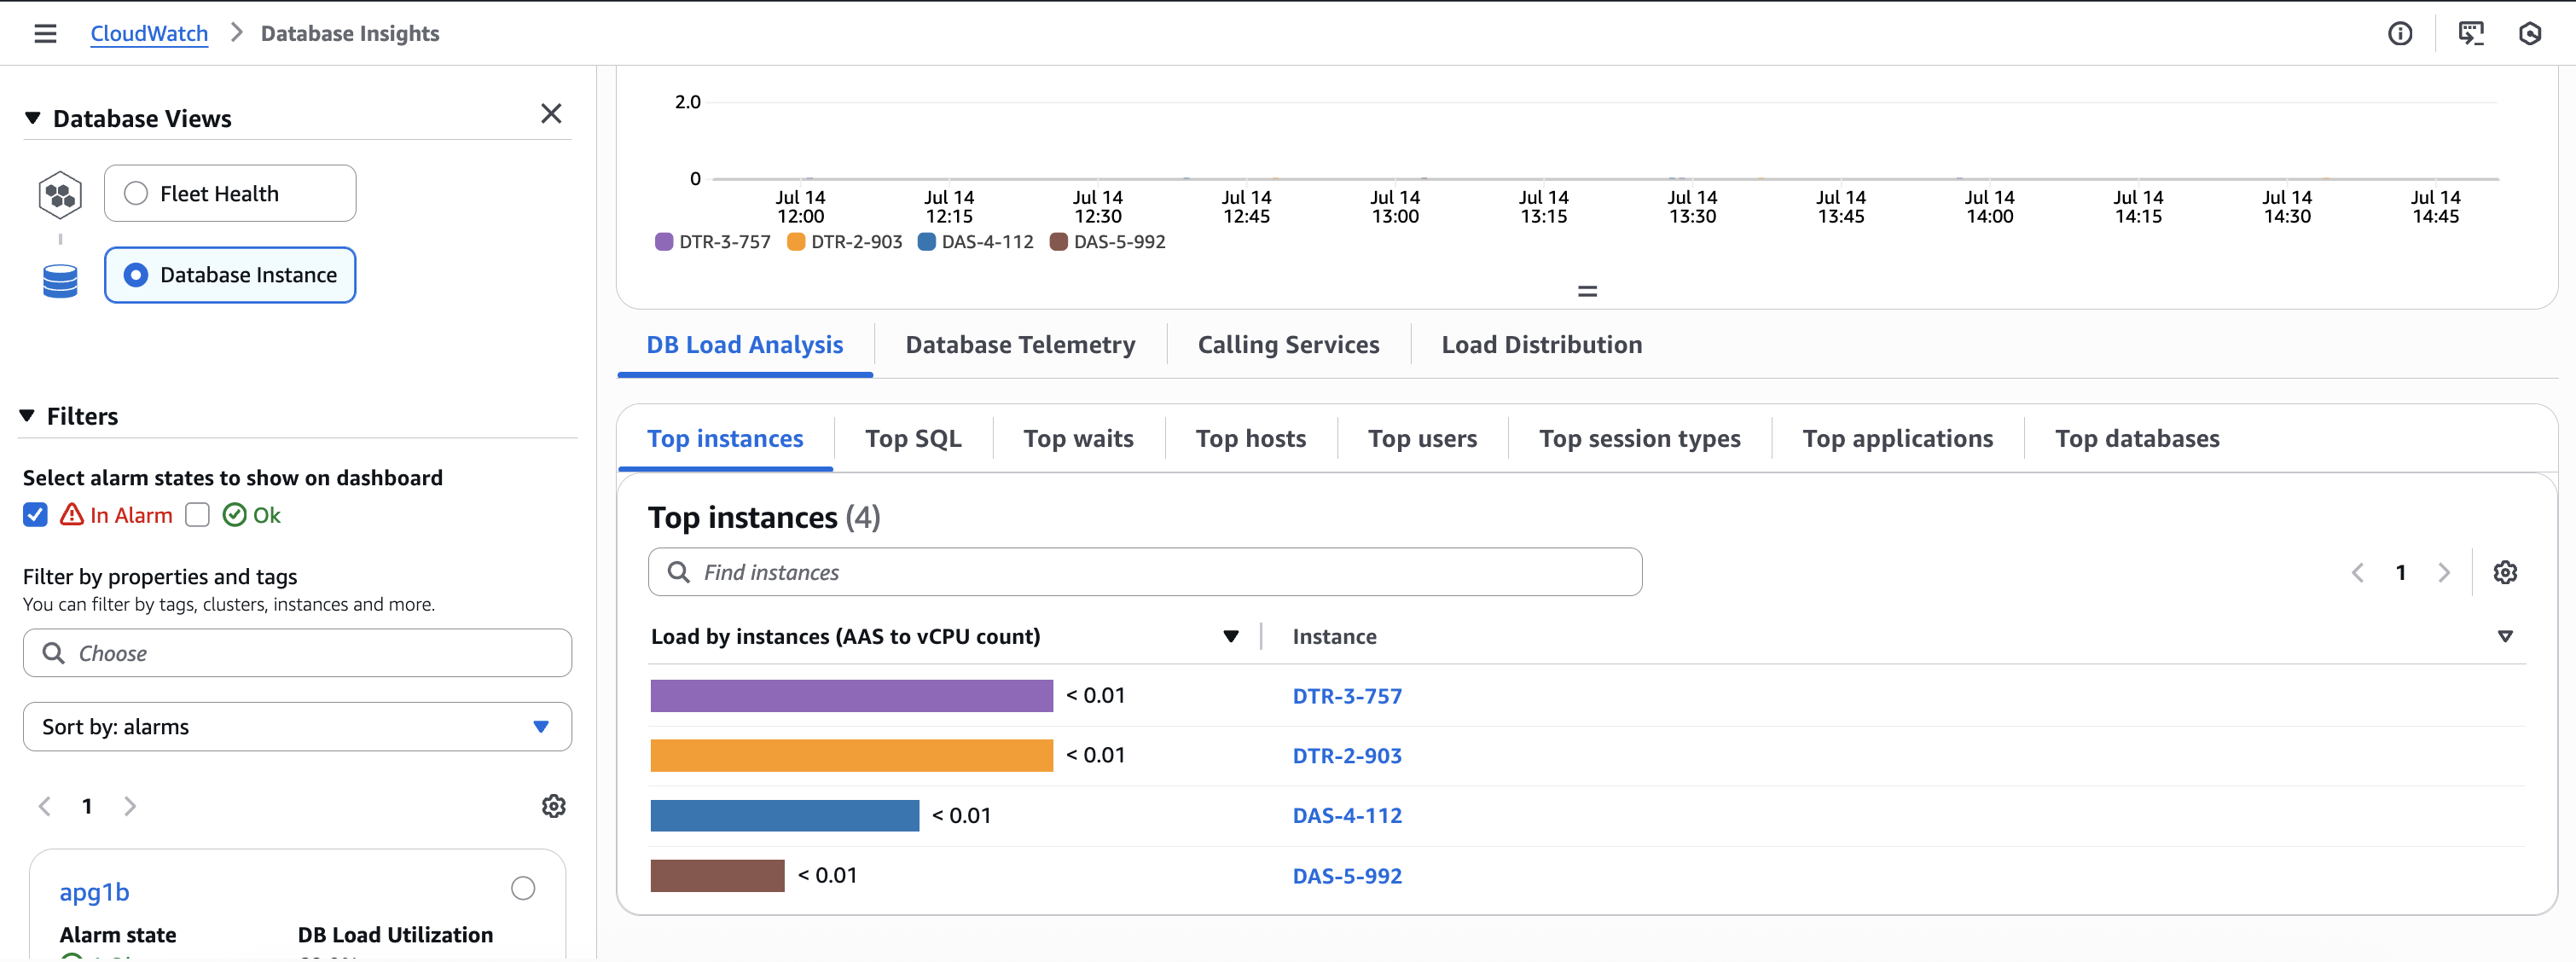
Top instances – Shows the relative DB load for your instances (shards and routers) in descending order.
-
Wait events – Cause SQL statements to wait for specific events to happen before they can continue running. Wait events indicate where work is impeded.
-
Top SQL – Shows which queries contribute the most to DB load.

Analyze DB load for Aurora PostgreSQL Limitless Databases with Database Insights
With Database Insights, you can track metrics at the shard group level and at the instance level for an Aurora PostgreSQL Limitless Database. When analyzing DB load for an Aurora PostgreSQL Limitless Database, you might want to compare the DB load for each shard and router to the maximum vCPU.
The Absolute view shows the number of Average active sessions (AAS) and the estimated vCPU. The Relative view shows the ratio of AAS to the estimated vCPU.

Analyzing relative DB load using the Database Insights dashboard
You might want to improve the performance of your Aurora PostgreSQL Limitless Database by tracking relative DB load. To analyze relative DB load by instance for your Aurora PostgreSQL Limitless Database, use the following procedure.
To analyze relative DB load using the console
Open the CloudWatch console at https://console.amazonaws.cn/cloudwatch/
. -
In the navigation pane, choose Database Insights.
-
Choose an Aurora PostgreSQL Limitless Database. The Database Insights dashboard is displayed for that Aurora PostgreSQL Limitless Database.
-
In the Database load (DB load) section, choose Instances for Sliced by. To see the ratio of Average active sessions (AAS) to vCPU cores for all of the instances in your Aurora PostgreSQL Limitless Database, choose Relative for Viewed as.
The Average active sessions chart shows the DB load for instances in yourAurora PostgreSQL Limitless Database.
-
To view the top instances, choose the Top instances tab.
-
(Optional) To analyze DB load for an instance in your Aurora PostgreSQL Limitless Database, choose the instance name in the Instances column.
Analyzing DB load by waits using the Database Insights dashboard
You might want to improve the performance for your Aurora PostgreSQL Limitless Database by tracking wait events. To analyze DB load by wait events for your Aurora PostgreSQL Limitless Database, use the following procedure.
To analyze DB load by waits for Aurora PostgreSQL Limitless Database using the console
Open the CloudWatch console at https://console.amazonaws.cn/cloudwatch/
. -
In the navigation pane, choose Database Insights.
-
Choose an Aurora PostgreSQL Limitless Database. The Database Insights dashboard is displayed for that Aurora PostgreSQL Limitless Database.
-
In the Database load (DB load) section, choose Waits for Sliced by. To view the number of AAS and the estimated vCPU, choose Absolute for Viewed as.
The Average active sessions chart shows the DB load for instances in your Aurora PostgreSQL Limitless Database.
-
Scroll down to the Top SQL tab.
-
Choose the SQL statement to expand it into its component statements.
Analyzing load distribution using the Database Insights dashboard
You might want to balance the load distribution for instances on your Aurora PostgreSQL Limitless Database. To analyze load distribution of the instances on an Aurora PostgreSQL Limitless Database, use the following procedure.
To analyze load distribution of the instances on an Aurora PostgreSQL Limitless Database using the console
Open the CloudWatch console at https://console.amazonaws.cn/cloudwatch/
. -
In the navigation pane, choose Database Insights.
-
Choose an Aurora PostgreSQL Limitless Database. The Database Insights dashboard is displayed for that Aurora PostgreSQL Limitless Database.
-
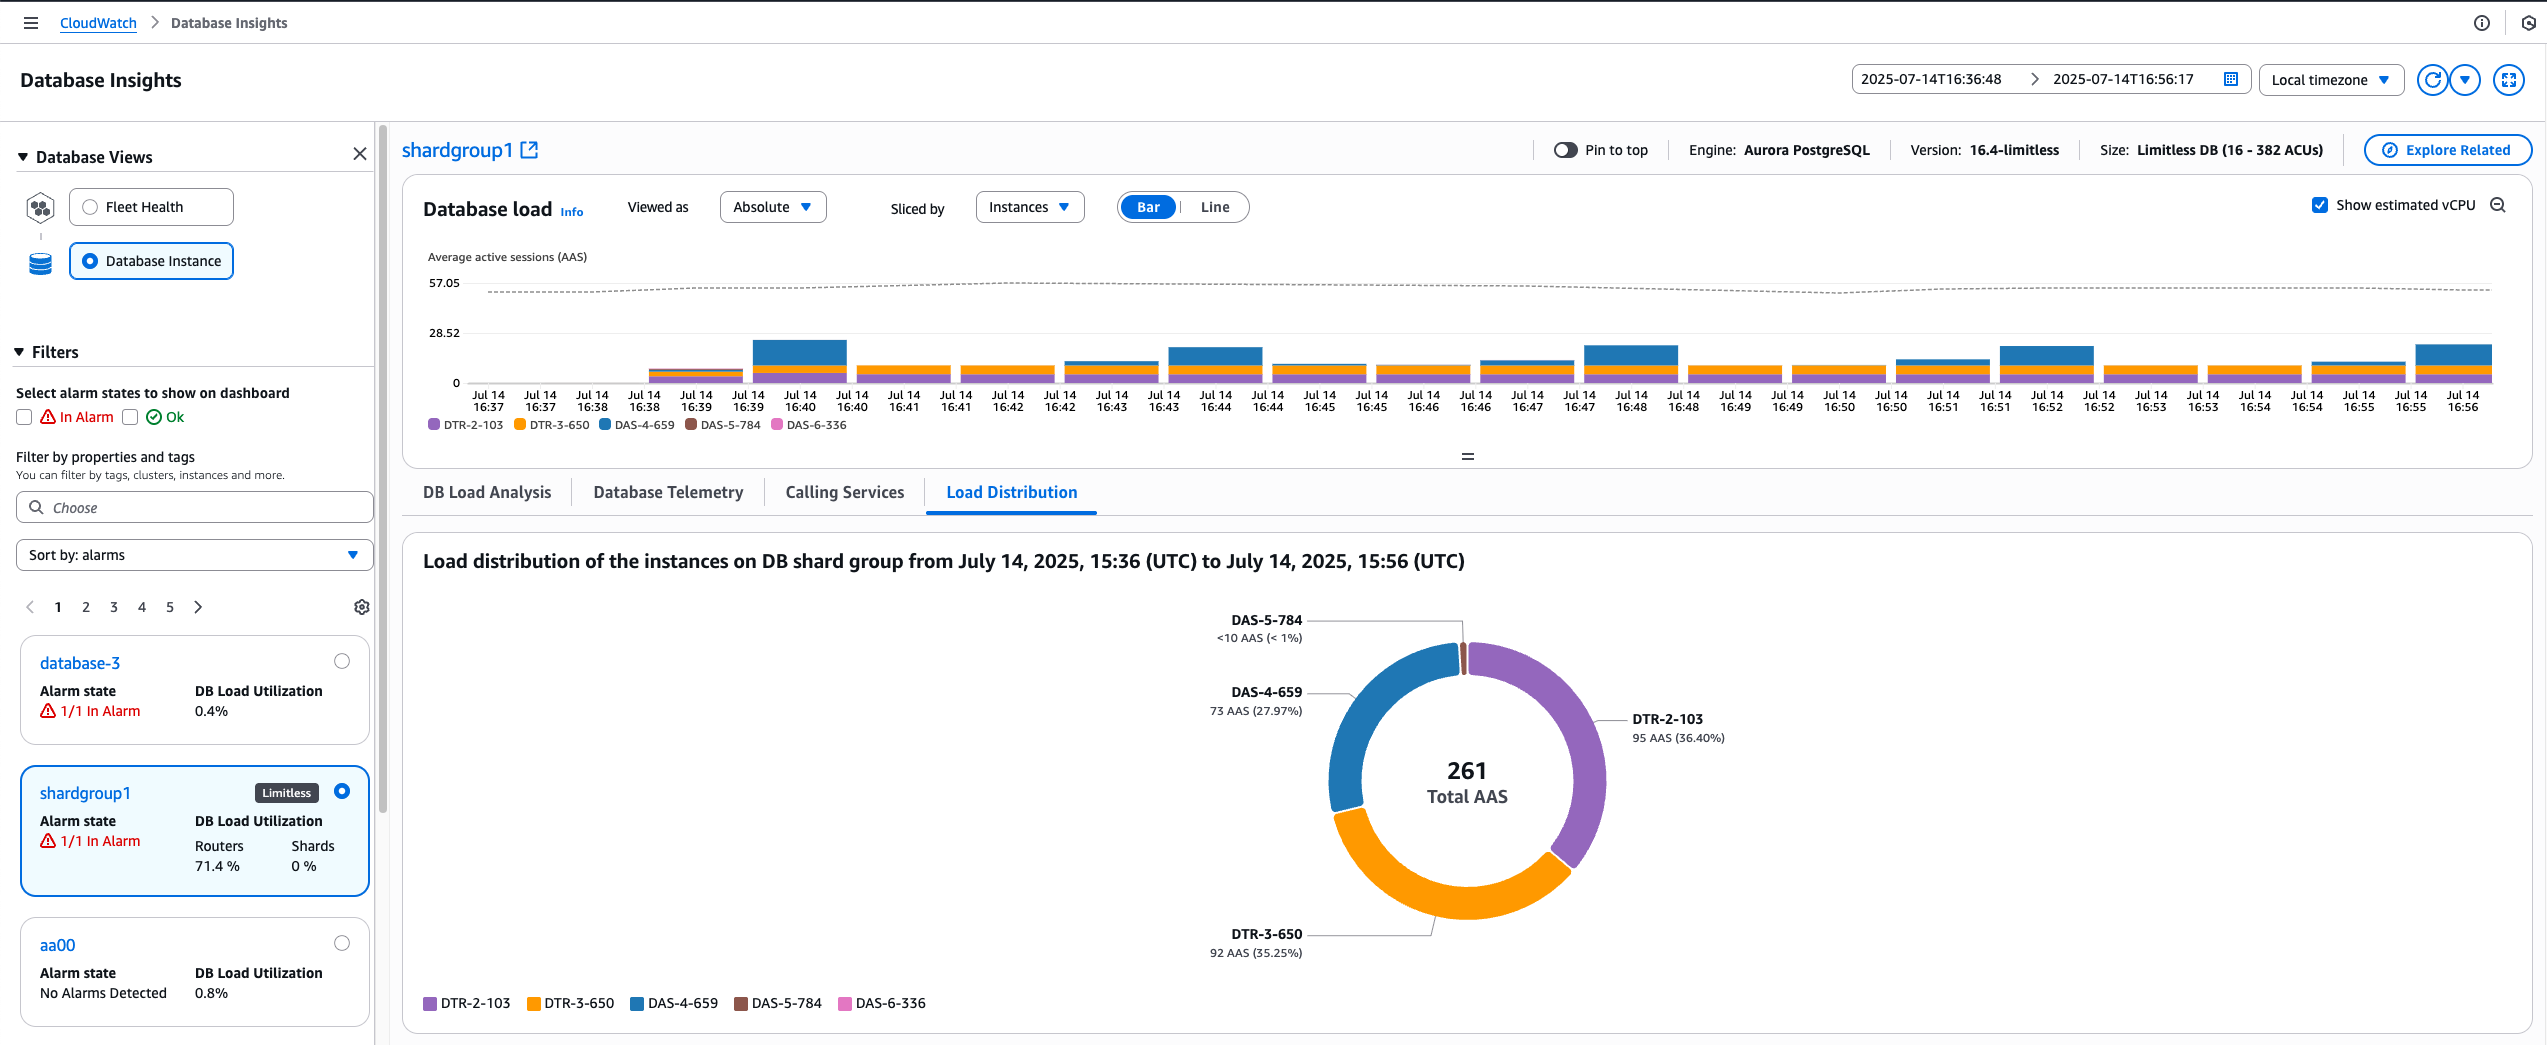
In the Database load (DB load) section, choose Instances for Sliced by. To view the number of AAS and the estimated vCPU for all instances in your Aurora PostgreSQL Limitless Database, choose Absolute for Viewed as.
The Average active sessions chart shows the DB load for instances in your Aurora PostgreSQL Limitless Database.
-
To see a chart of the load distribution of the instances in your Aurora PostgreSQL Limitless Database, choose the Load distribution tab.