Monitor dashboards
You can use the monitor dashboard in Network Synthetic Monitor to view the network health indicator (NHI), as well as probe round-trip time and packet loss at a monitor level. That is, a monitor dashboard shows this information for all the probes created for the monitor.
Network Synthetic Monitor also has dashboards for probes, to view the information at a probe level. For more information, see Probe dashboards.
To access a monitor dashboard
-
Open the CloudWatch console at https://console.amazonaws.cn/cloudwatch/
, and then under Network Monitoring, choose Synthetic monitors. -
In the Monitors section, choose the Name link to open the monitor dashboard.
Overview page
The Overview page displays the following information for a monitor:
-
Network health — Network health displays the network health indicator (NHI) value, which pertains to health of only the Amazon network. The NHI status is displayed as Healthy or Degraded. A Healthy status indicates that Network Synthetic Monitor did not observe issues with the Amazon network. A Degraded status indicates that Network Synthetic Monitor observed an issue with the Amazon network. The status bar in this section shows the status of the network health indicator over a default time of one hour. Hover over any point in the status bar to view additional details.
-
Probe traffic summary — Displays the current state of the traffic between the source Amazon subnets specified for the probes in the monitor and the probes' destination IP addresses. This summary displays the following:
-
Probes in alarm — This number indicates how many of your probes in this monitor are in a degraded state. An alarm is triggered when a metric that you've set up as an alarm is triggered. For information on creating alarms for metrics in Network Synthetic Monitor, see Probe alarms.
-
Packet loss — The number of packets that were lost from the source subnet to the destination IP address. This is represented as a percentage of the total packets sent.
-
Round-trip time — The time it takes, displayed in milliseconds, for a packet from the source subnet to reach the destination IP address, and then come back again. Round-trip time is the average RTT observed during the aggregation period.
-
The data is represented on an interactive graph, so you can explore to learn details.
By default, data is displayed for a two-hour time frame, calculated from the current date and time. However, you can change the range to fit your needs. For more information, see Specify metrics time frame.
Tracking metrics
The Overview dashboard in Network Synthetic Monitor displays a graphical representation of a monitor and probes. The following graphs are shown:
-
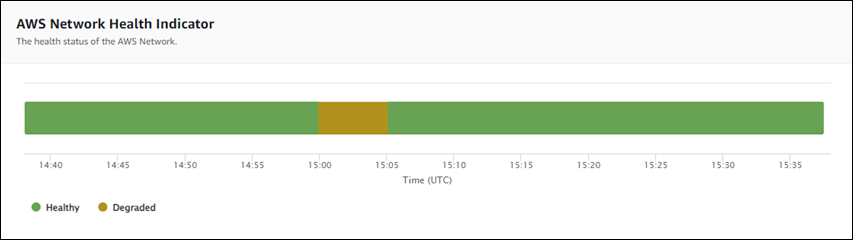
Network health indicator — This represents the the NHI values over a specified period. NHI indicates whether a network issue is due to problems with the Amazon network. NHI is displayed as Healthy (no issue with the Amazon network) or Degraded (there is an issue with the Amazon network).
In the following example, you can see that from 15:00 UTC until 15:05 UTC, there was a network issue that was due to an Amazon network issue (Degraded). After 15:05, the network issue with the Amazon network ended, so the value returned to Healthy. You can hover over any section of the graph to see additional details.
Note
The NHI indicates that an issue is due to the Amazon network. It does not describe the overall health of the Amazon network nor the health of Network Synthetic Monitor probes.
-
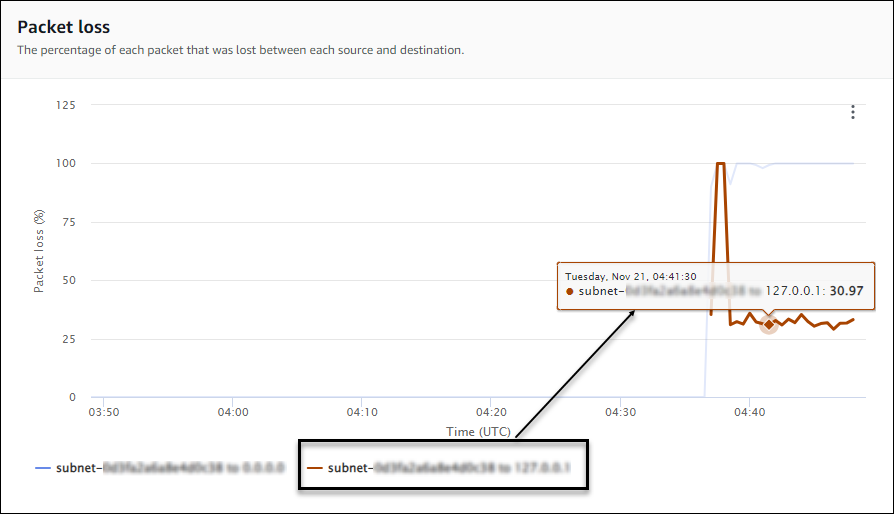
Packet loss — This graph displays a line that shows the percentage of packet loss for each probe in a monitor. The legend at the bottom of the page displays each of the probes in the monitor, color-coded for uniqueness. You can hover over a probe in the chart to see the source subnet, the destination IP address, and the percentage of packet loss.
In the following example, a packet loss alarm was created for a probe from a subnet to IP address 127.0.0.1. The alarm was triggered when the packet loss threshold was exceeded for the probe. If you hover over the graph, you can see the probe source and destination, and that there was a 30.97% packet loss for this probe on November 21 at 02:41:30.
-
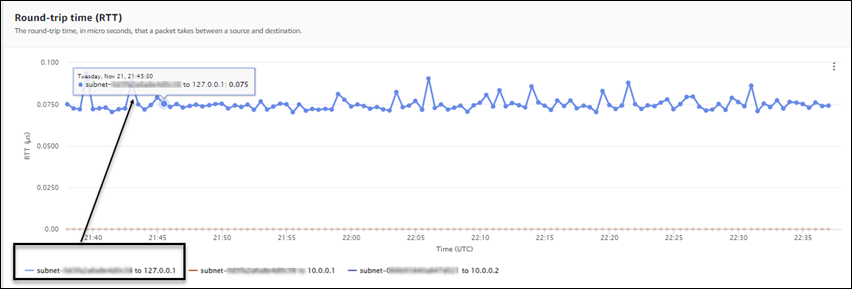
Round-trip time — This graph displays a line that shows the round-trip time for each probe. The legend at the bottom of the page displays each of the probes in the monitor, color-coded for uniqueness. You can hover over a probe in the chart to see the source subnet, the destination IP address, and the round-trip time.
The following example shows that on Tuesday, Nov 21, at 21:45:30, the round-trip time for a probe from a subnet to IP address 127.0.0.1 was 0.075 seconds.
Monitor details
The Monitor details page displays details about your monitor, including a list of the probes for the monitor. You can update or add tags, or add a probe. The page includes the following sections:
-
Monitor details — This page provides details about your monitor. You can't edit information in this section. However, you can view details of the Network Synthetic Monitor service-linked role: choose the Role name link to see details.
-
Probes — This section displays a list of all probes associated with the monitor. Choose a VPC or Subnet ID link to open the VPC or subnet details in the Amazon VPC Console. You can modify a probe, to activate or deactivate it. For more information, see Working with monitors and probes in Network Synthetic Monitor.
The Probes section displays information about each probe set up for that monitor, including the probe ID, the VPC ID, the Subnet ID, IP address, Protocol, and whether the probe is Active or Inactive.
If you've created an alarm for a probe, the current Status of the alarm is shown. A status of OK indicates that there are no metrics events have triggered any alarms. A status of In alarm indicates that a metric that you created in CloudWatch triggered an alarm. If no status is displayed for a probe, then there isn't a CloudWatch alarm for it. For information on the types of Network Synthetic Monitor probe alarms that you can create, see Probe alarms.
-
Tags — View the current tags for a monitor. You can add or remove tags by choosing Manage tags. This opens the Edit probe page. For more information on editing tags, see Edit a monitor.