Exporting Performance Insights metrics as a new dashboard to CloudWatch
Choose a preconfigured or custom metrics dashboard from the Performance Insights dashboard and export it as a new dashboard to CloudWatch. You can view the exported dashboard in the CloudWatch console.
To export a Performance Insights metric dashboard as a new dashboard to CloudWatch
Open the Amazon RDS console at https://console.amazonaws.cn/rds/
. -
In the left navigation pane, choose Performance Insights.
-
Choose a DB instance.
The Performance Insights dashboard appears for the DB instance.
-
Scroll down and choose Metrics.
By default, the preconfigured dashboard with Performance Insights metrics appears.
Choose a preconfigured or custom dashboard and then choose Export to CloudWatch.
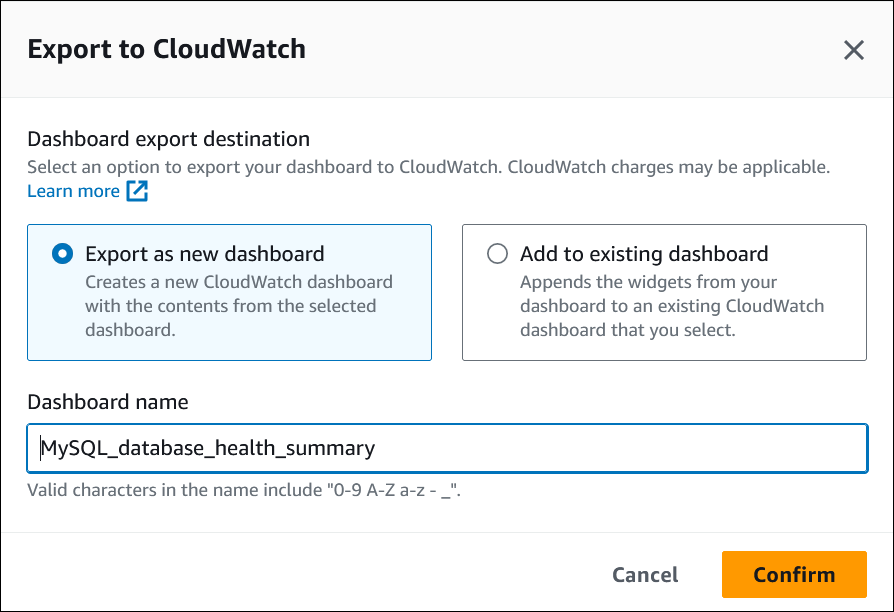
The Export to CloudWatch window appears.

-
Choose Export as new dashboard.

-
Enter a name for the new dashboard in the Dashboard name field and choose Confirm.
A banner displays a message after the dashboard export is successful.

-
Choose the link or View in CloudWatch in the banner to view the metrics dashboard in the CloudWatch console.