Analyzing SQL Server execution plans using the Performance Insights dashboard for Amazon RDS
When analyzing DB load on a SQL Server Database, you might want to know which plans are contributing the most to DB load. You can determine which plans are contributing the most to DB load by using the plan capture feature of Performance Insights.
To analyze SQL Server execution plans using the console
Open the Amazon RDS console at https://console.amazonaws.cn/rds/
. -
In the navigation pane, choose Performance Insights.
-
Choose a SQL Server DB instance. The Performance Insights dashboard is displayed for that DB instance.
-
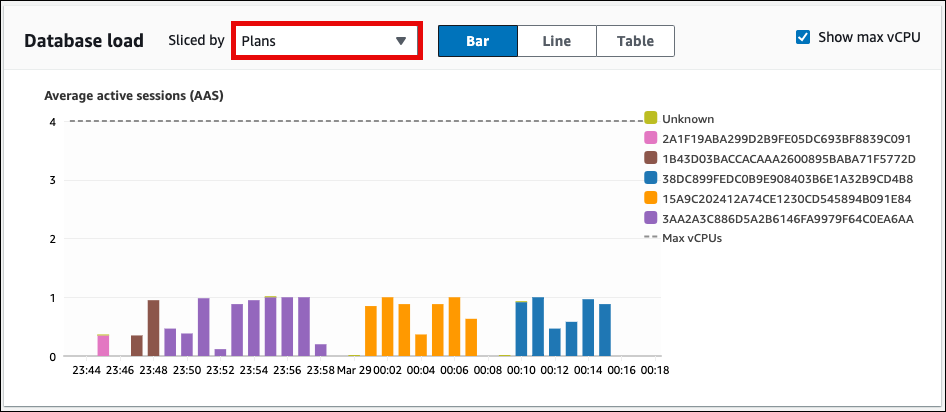
In the Database load (DB load) section, choose Plans next to Slice by.
The Average active sessions chart shows the plans used by your top SQL statements. The plan hash values appear to the right of the color-coded squares. Each hash value uniquely identifies a plan.
-
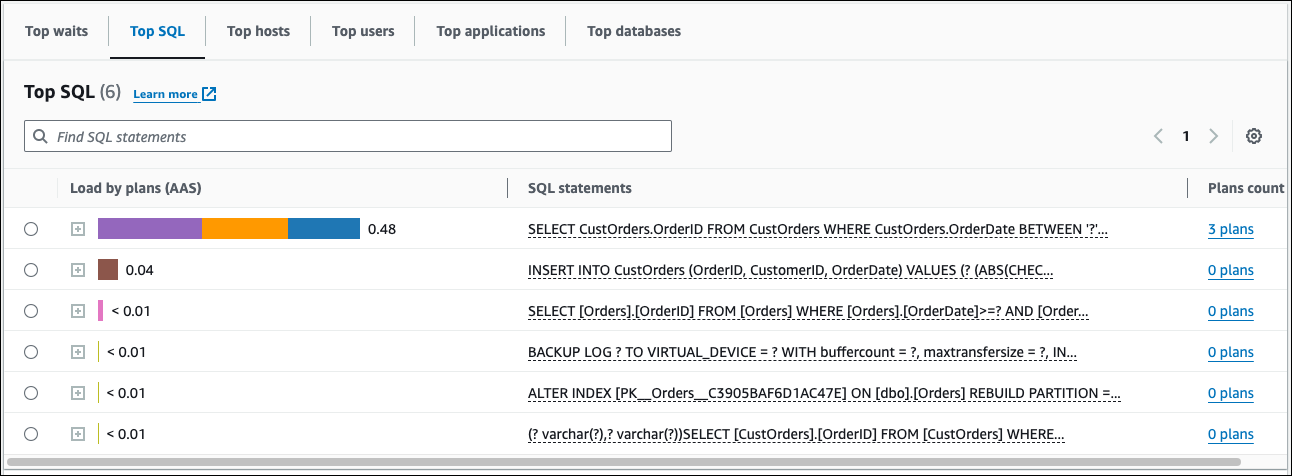
Scroll down to the Top SQL tab.
In the following example, the top SQL digest has three plans. The presence of a question mark in the SQL statement indicates that the statement is a digest. To view the full SQL statement, choose a value in the SQL statements column.
-
Choose the digest to expand it into its component statements.
In the following example, the
SELECTstatement is a digest query. The component queries in the digest use three different execution plans. The colors assigned to the plans correspond to the database load chart.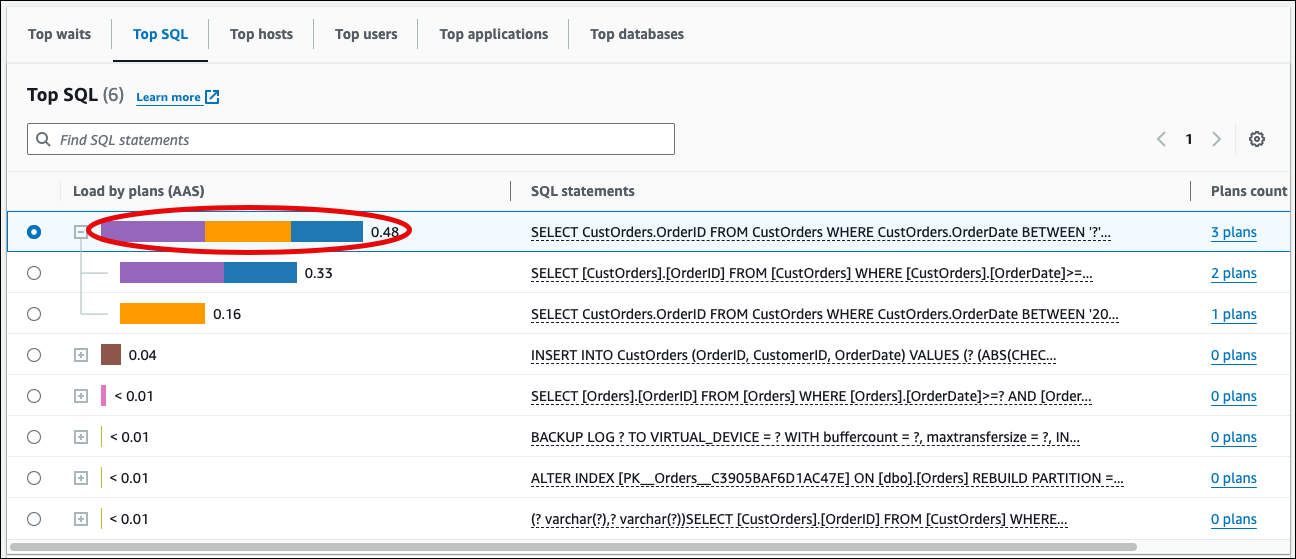
-
Scroll down and choose two Plans to compare from Plans for digest query list.
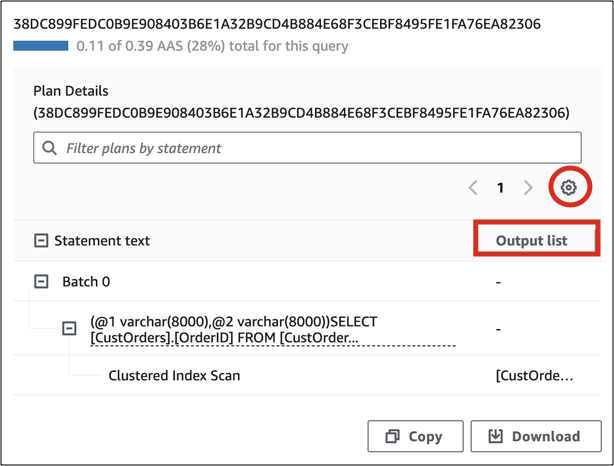
You can view either one or two plans for a query at a time. The following screenshot compares two plans in the digest. In the following example, 40% of the average active sessions running this digest query are using the plan on the left, whereas 28% are using the plan on the right.
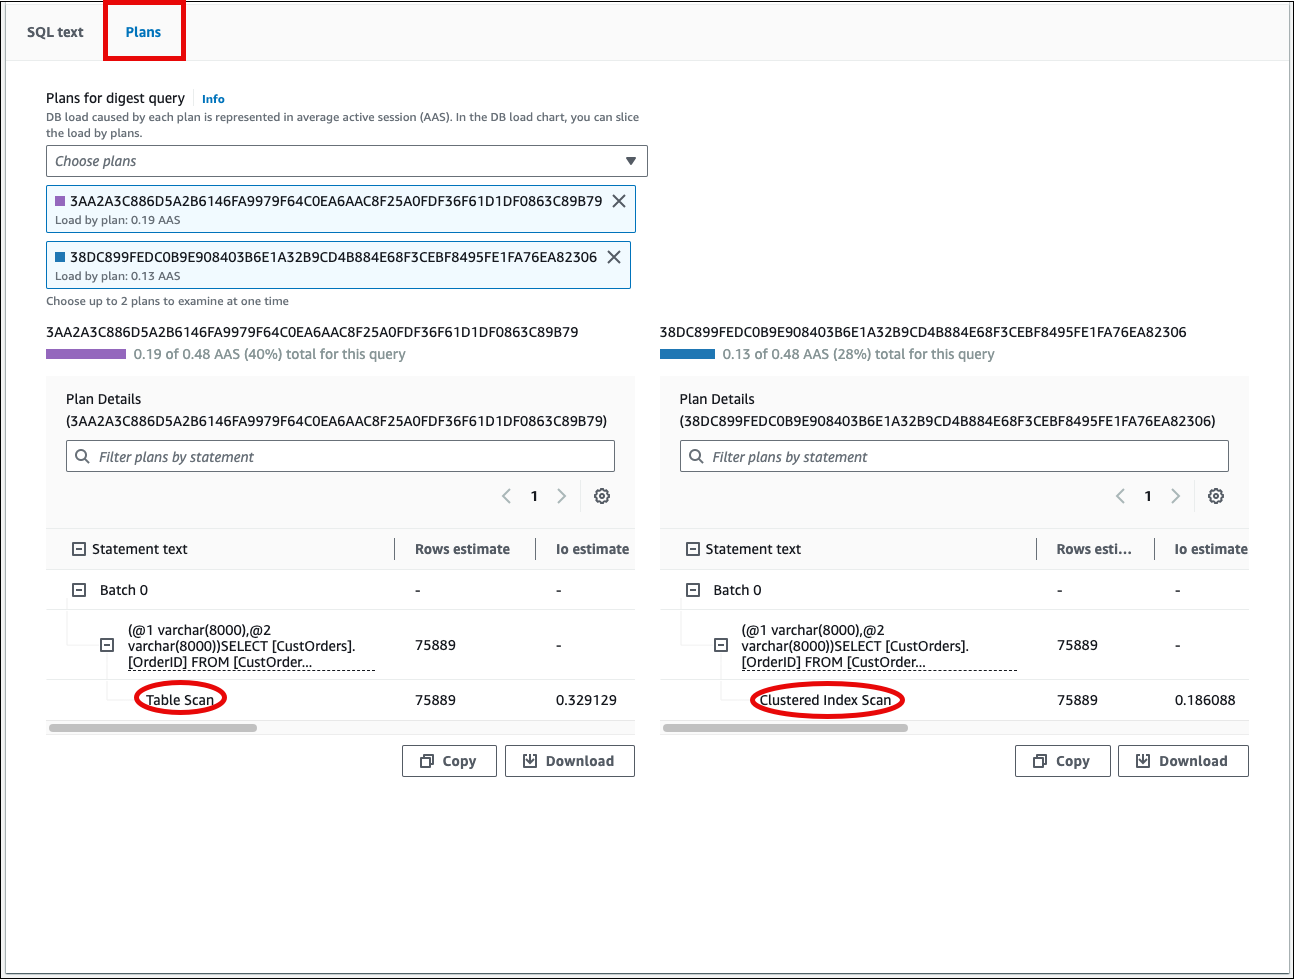
In the previous example, the plans differ in an important way. Step 2 in the plan on the left uses an table scan, whereas the plan on the right uses a clustered index scan. For a table with a large number of rows, a query retrieving a single row is almost always faster with a clustered index scan.
(Optional) Choose the Settings icon on the Plan Details table to customize the visibility and order of columns. The following screenshot shows the Plan Details table with the Output list column as the second column.
-
(Optional) Choose Copy to copy the plan to the clipboard, or Download to save the plan to your hard drive.
Note
Performance Insights displays estimated execution plans using a hierarchical tree table.
The table includes the partial execution information for each statement.
For more information about the columns in the Plan Details table, see SET SHOWPLAN_ALL