Analyzing top Oracle PDB load
When analyzing the load on an Oracle container DB (CDB), you might want to identify which pluggable databases (PDBs) contribute the most to DB load. You might also want to compare the performance of individual PDBs that are running similar queries to fine tune performance. For more information about Oracle CDBs, see RDS for Oracle database architecture.
In the Amazon RDS Performance Insights dashboard, you can find information about pluggable databases (PDBs) under Top PDB tab in the Dimensions tab.
For the region, DB engine, and instance class support information for this feature, see Amazon RDS DB engine, Region, and instance class support for Performance Insights features.
To analyze Top PDB load in an Oracle CDB
Sign in to the Amazon Web Services Management Console and open the Amazon RDS console at https://console.amazonaws.cn/rds/
. -
In the left navigation pane, select Performance Insights.
-
Choose an Oracle CDB instance.
The Performance Insights dashboard appears for the DB instance.
-
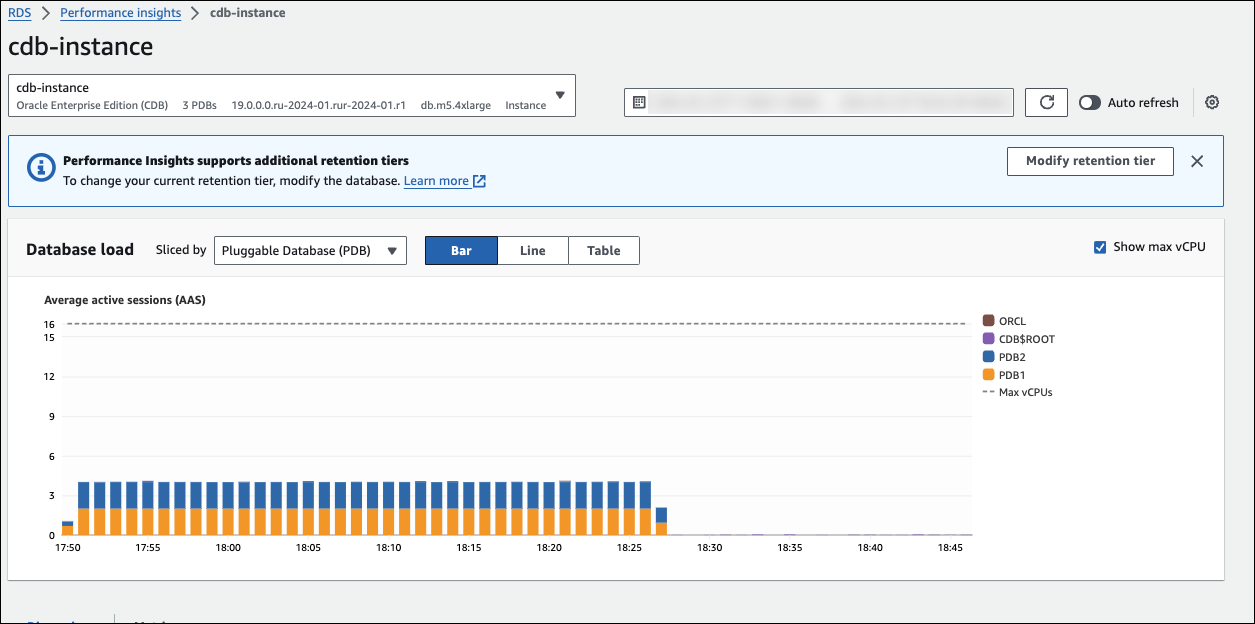
In the Database load (DB load) section, choose Pluggable database (PDB) next to Slice by.
The Average active sessions chart shows the PDB with the highest load. The PDB identifiers appear to the right of the color-coded squares. Each identifier uniquely identifies a PDB.
-
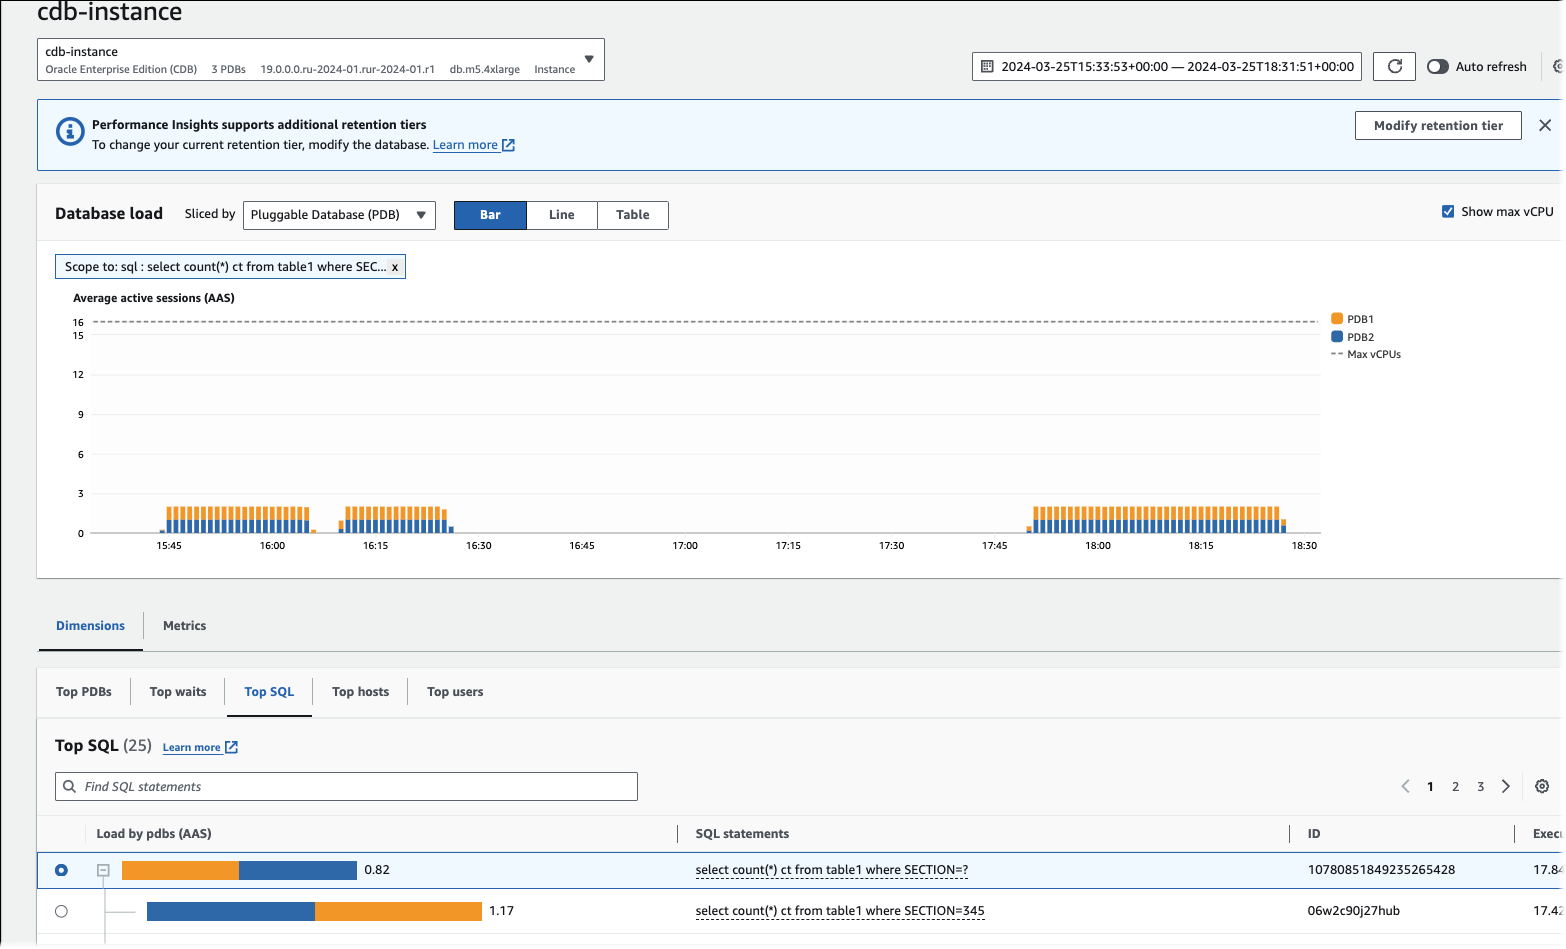
Scroll down to the Top SQL tab.
In the following example, you can see the same SQL query and the load it drives to multiple PDBs.
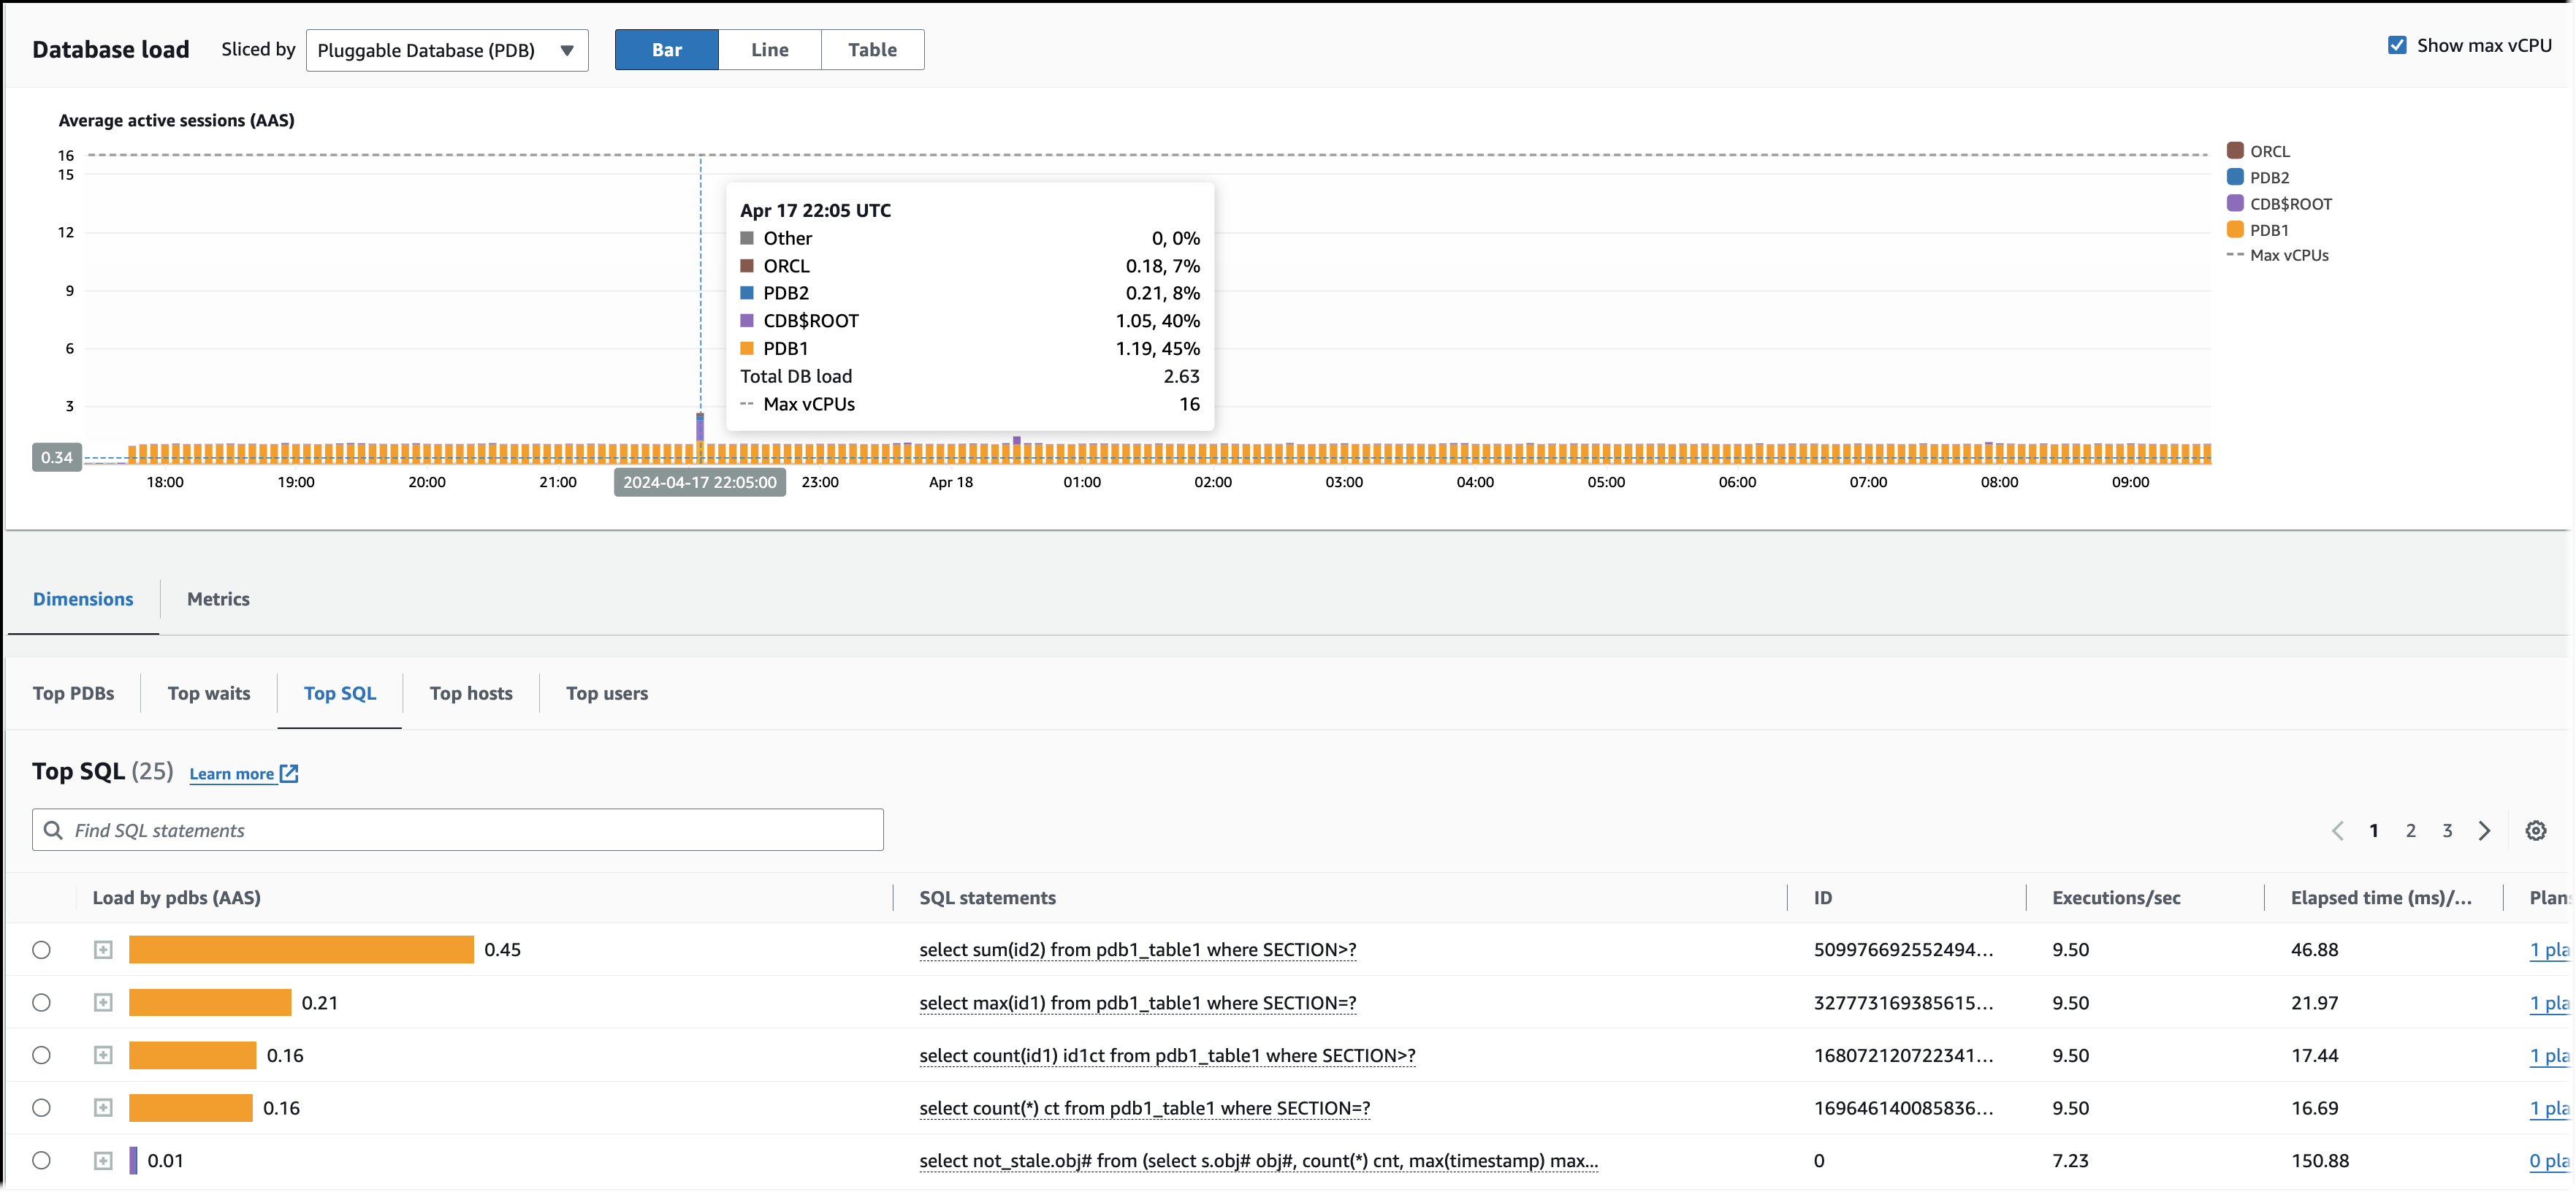
In the following example, a single PDB is handling higher load than other PDBs in the CDB.
For more information about Oracle CDBs, see CDBs and PDBs
.