Use magics to create data graphs
The line magics in this section specialize in rendering data for particular types of data or in conjunction with graphing libraries.
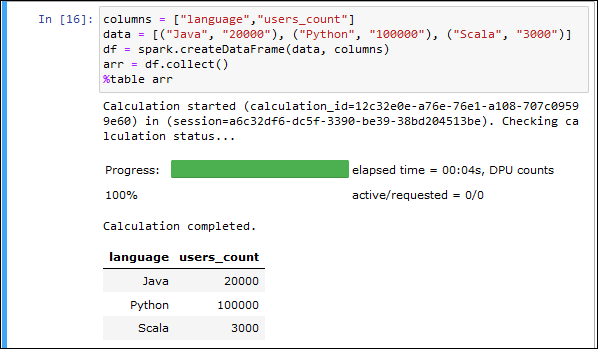
%table
You can use the %table magic command to display dataframe data in table
format.
The following example creates a dataframe with two columns and three rows of data, then displays the data in table format.
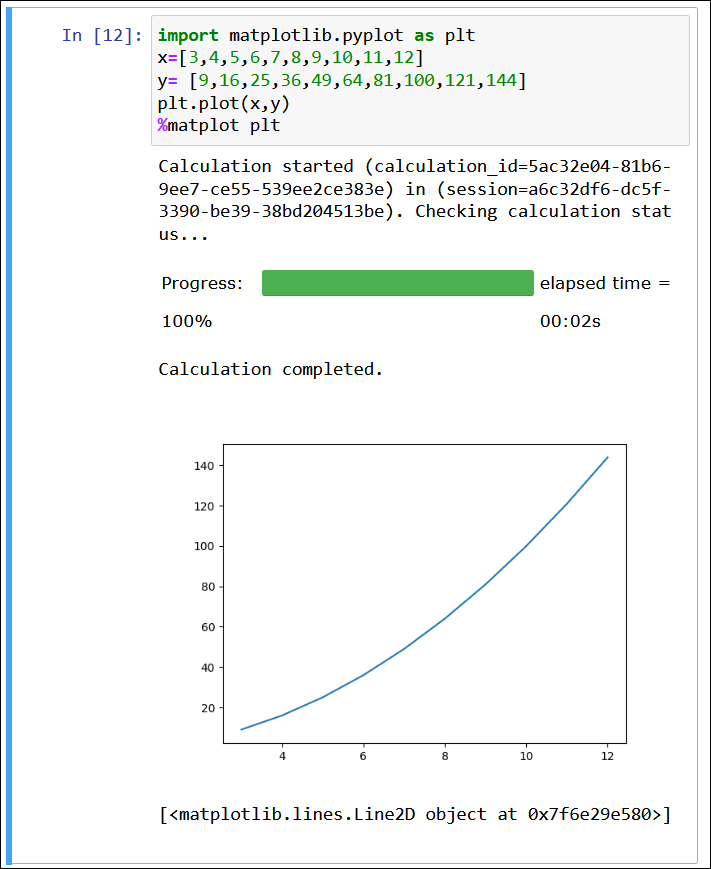
%matplot
Matplotlib%matplot magic command to create a graph after you import the
matplotlib library into a notebook cell.
The following example imports the matplotlib library, creates a set of x and y
coordinates, and then uses the use the %matplot magic command to create a
graph of the points.
import matplotlib.pyplot as plt
x=[3,4,5,6,7,8,9,10,11,12]
y= [9,16,25,36,49,64,81,100,121,144]
plt.plot(x,y)
%matplot plt
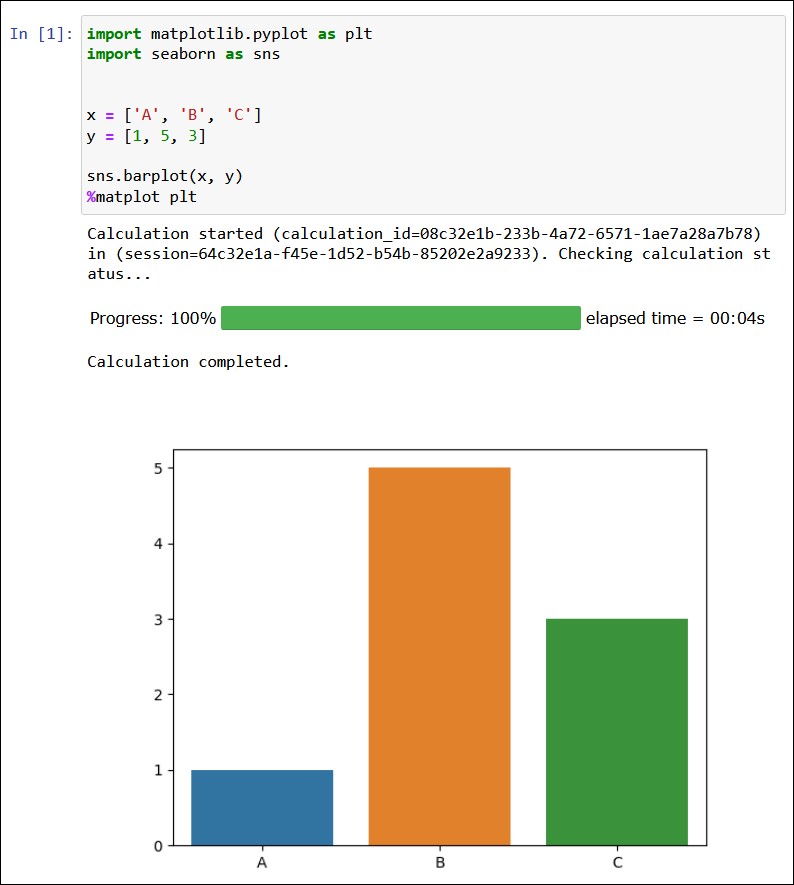
Use the matplotlib and seaborn libraries together
Seaborn%matplot
magic command to render seaborn data.
The following example uses both the matplotlib and seaborn libraries to create a simple bar graph.
import matplotlib.pyplot as plt
import seaborn as sns

x = ['A', 'B', 'C']
y = [1, 5, 3]

sns.barplot(x, y)
%matplot plt
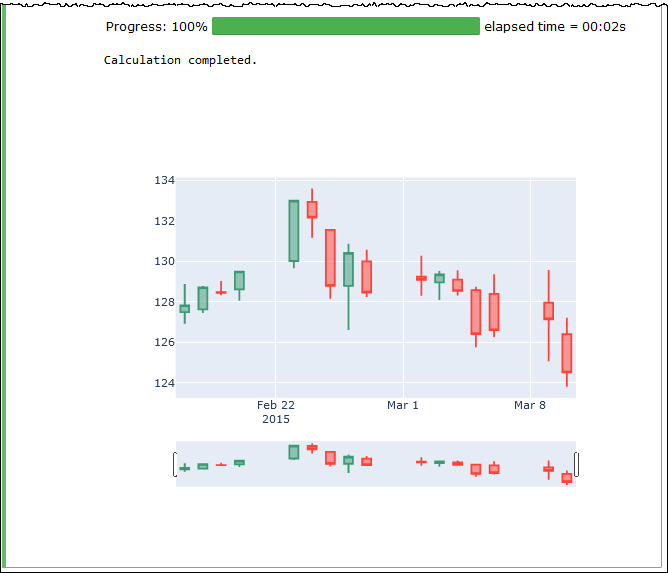
%plotly
Plotly%ploty magic command to render ploty data.
The following example uses the StringIO
from io import StringIO
csvString = """
Date,AAPL.Open,AAPL.High,AAPL.Low,AAPL.Close,AAPL.Volume,AAPL.Adjusted,dn,mavg,up,direction
2015-02-17,127.489998,128.880005,126.919998,127.830002,63152400,122.905254,106.7410523,117.9276669,129.1142814,Increasing
2015-02-18,127.629997,128.779999,127.449997,128.720001,44891700,123.760965,107.842423,118.9403335,130.0382439,Increasing
2015-02-19,128.479996,129.029999,128.330002,128.449997,37362400,123.501363,108.8942449,119.8891668,130.8840887,Decreasing
2015-02-20,128.619995,129.5,128.050003,129.5,48948400,124.510914,109.7854494,120.7635001,131.7415509,Increasing
2015-02-23,130.020004,133,129.660004,133,70974100,127.876074,110.3725162,121.7201668,133.0678174,Increasing
2015-02-24,132.940002,133.600006,131.169998,132.169998,69228100,127.078049,111.0948689,122.6648335,134.2347981,Decreasing
2015-02-25,131.559998,131.600006,128.149994,128.789993,74711700,123.828261,113.2119183,123.6296667,134.0474151,Decreasing
2015-02-26,128.789993,130.869995,126.610001,130.419998,91287500,125.395469,114.1652991,124.2823333,134.3993674,Increasing
2015-02-27,130,130.570007,128.240005,128.460007,62014800,123.510987,114.9668484,124.8426669,134.7184854,Decreasing
2015-03-02,129.25,130.279999,128.300003,129.089996,48096700,124.116706,115.8770904,125.4036668,134.9302432,Decreasing
2015-03-03,128.960007,129.520004,128.089996,129.360001,37816300,124.376308,116.9535132,125.9551669,134.9568205,Increasing
2015-03-04,129.100006,129.559998,128.320007,128.539993,31666300,123.587892,118.0874253,126.4730002,134.8585751,Decreasing
2015-03-05,128.580002,128.75,125.760002,126.410004,56517100,121.539962,119.1048311,126.848667,134.5925029,Decreasing
2015-03-06,128.399994,129.369995,126.260002,126.599998,72842100,121.722637,120.190797,127.2288335,134.26687,Decreasing
2015-03-09,127.959999,129.570007,125.059998,127.139999,88528500,122.241834,121.6289771,127.631167,133.6333568,Decreasing
2015-03-10,126.410004,127.220001,123.800003,124.510002,68856600,119.71316,123.1164763,127.9235004,132.7305246,Decreasing
"""
csvStringIO = StringIO(csvString)

from io import StringIO
import plotly.graph_objects as go
import pandas as pd
from datetime import datetime
df = pd.read_csv(csvStringIO)
fig = go.Figure(data=[go.Candlestick(x=df['Date'],
open=df['AAPL.Open'],
high=df['AAPL.High'],
low=df['AAPL.Low'],
close=df['AAPL.Close'])])
%plotly fig