View execution plans for SQL queries
You can use the Athena query editor to see graphical representations of how your query will be run. When you enter a query in the editor and choose the Explain option, Athena uses an EXPLAIN SQL statement on your query to create two corresponding graphs: a distributed execution plan and a logical execution plan. You can use these graphs to analyze, troubleshoot, and improve the efficiency of your queries.
To view execution plans for a query
-
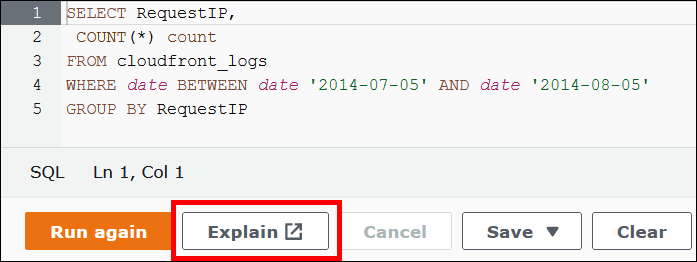
Enter your query in the Athena query editor, and then choose Explain.
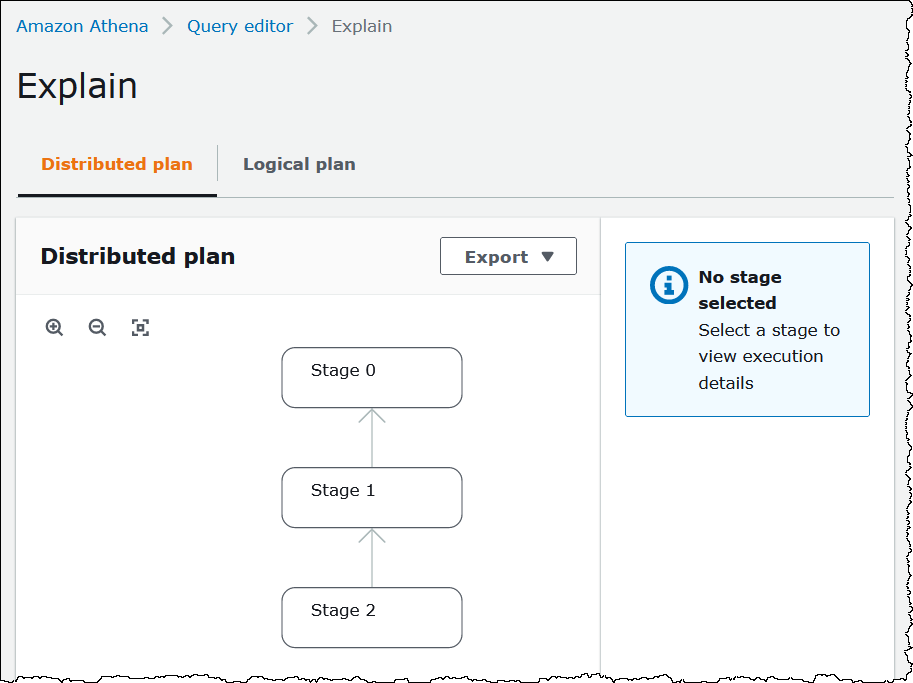
The Distributed plan tab shows you the execution plan for your query in a distributed environment. A distributed plan has processing fragments or stages. Each stage has a zero-based index number and is processed by one or more nodes. Data can be exchanged between nodes.
-
To navigate the graph, use the following options:
-
To zoom in or out, scroll the mouse, or use the magnifying icons.
-
To adjust the graph to fit the screen, choose the Zoom to fit icon.
-
To move the graph around, drag the mouse pointer.
-
-
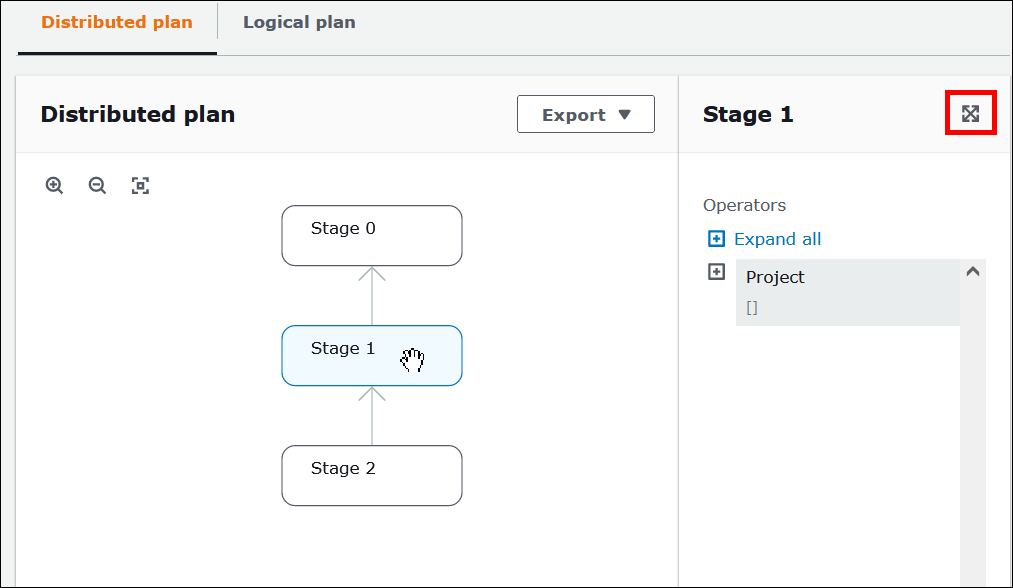
To see details for a stage, choose the stage.
-
To see the stage details full width, choose the expand icon at the top right of the details pane.
-
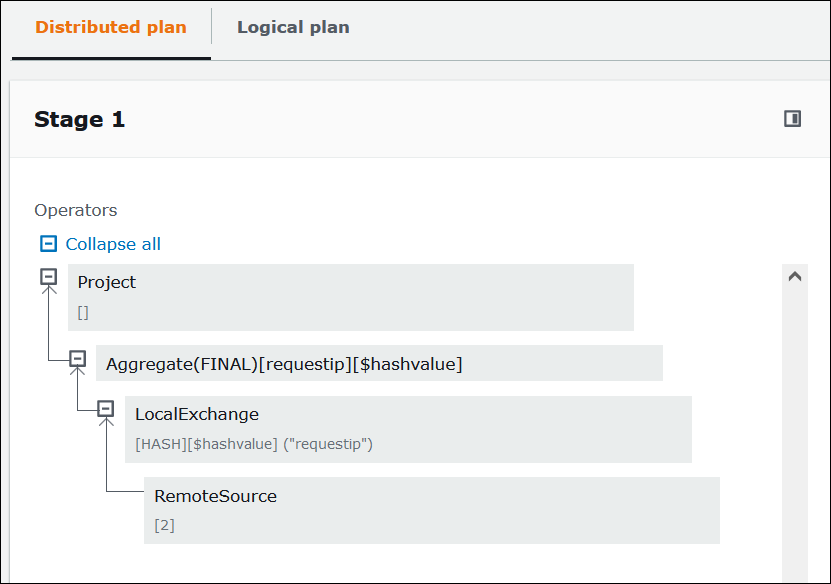
To see more detail, expand one or more items in the operator tree. For information about distributed plan fragments, see EXPLAIN statement output types.
Important
Currently, some partition filters may not be visible in the nested operator tree graph even though Athena does apply them to your query. To verify the effect of such filters, run EXPLAIN or EXPLAIN ANALYZE on your query and view the results.
-
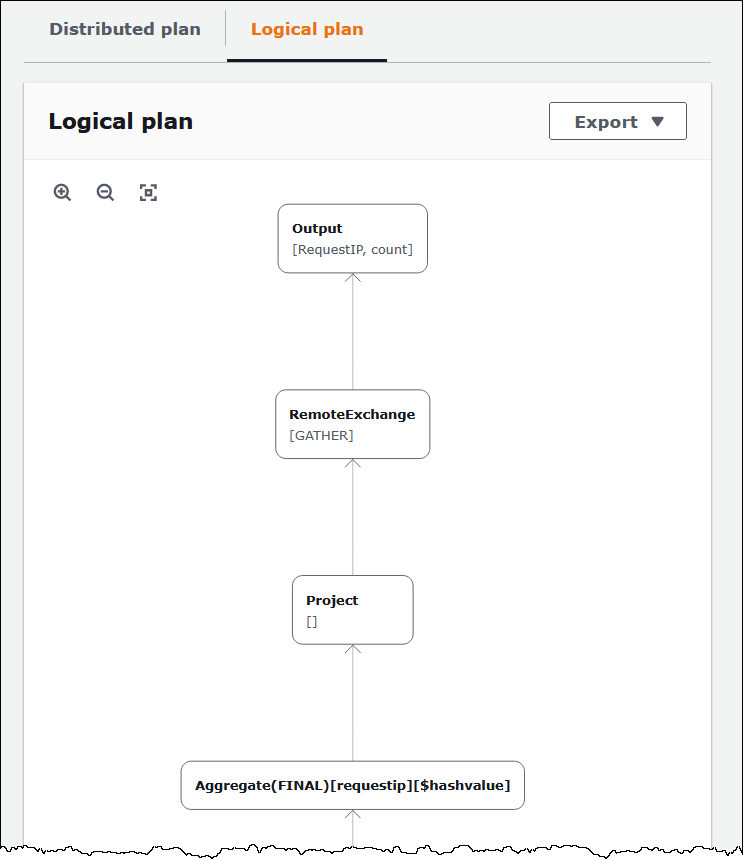
Choose the Logical plan tab. The graph shows the logical plan for running your query. For information about operational terms, see Understand Athena EXPLAIN statement results.
-
To export a plan as an SVG or PNG image, or as JSON text, choose Export.
Additional resources
For more information, see the following resources.
Using EXPLAIN and EXPLAIN ANALYZE in Athena
Understand Athena EXPLAIN statement results
View statistics and execution details for completed queries