Evaluate your predictive scaling policies
Before you use a predictive scaling policy to scale your Auto Scaling group, review the recommendations and other data for your policy in the Amazon EC2 Auto Scaling console. This is important because you don't want a predictive scaling policy to scale your actual capacity until you know that its predictions are accurate.
If the Auto Scaling group is new, give Amazon EC2 Auto Scaling 24 hours to create the first forecast.
When Amazon EC2 Auto Scaling creates a forecast, it uses historical data. If your Auto Scaling group doesn't have much recent historical data yet, Amazon EC2 Auto Scaling might temporarily backfill the forecast with aggregates created from the currently available historical aggregates. Forecasts are backfilled for up to two weeks before a policy's creation date.
View your predictive scaling recommendations
For effective analysis, Amazon EC2 Auto Scaling should have at least two predictive scaling policies to compare. (However, you can still review the findings for a single policy.) When you create multiple policies, you can evaluate a policy that uses one metric against a policy that uses a different metric. You can also evaluate the impact of different target value and metric combinations. After the predictive scaling policies are created, Amazon EC2 Auto Scaling immediately starts evaluating which policy would do a better job of scaling your group.
To view your recommendations in the Amazon EC2 Auto Scaling console
Open the Amazon EC2 console at https://console.amazonaws.cn/ec2/
, and choose Auto Scaling Groups from the navigation pane. -
Select the check box next to the Auto Scaling group.
A split pane opens up in the bottom of the page.
-
On the Auto scaling tab, under Predictive scaling policies, you can view details about a policy along with our recommendation. The recommendation tells you whether the predictive scaling policy does a better job than not using it.
If you're unsure whether a predictive scaling policy is appropriate for your group, review the Availability impact and Cost impact columns to choose the right policy. The information for each column tells you what the impact of the policy is.
-
Availability impact: Describes whether the policy would avoid negative impact to availability by provisioning enough instances to handle the workload, compared to not using the policy.
-
Cost impact: Describes whether the policy would avoid negative impact on your costs by not over-provisioning instances, compared to not using the policy. By over-provisioning too much, your instances are underutilized or idle, which only adds to the cost impact.
If you have multiple policies, then a Best prediction tag displays next to the name of the policy that gives the most availability benefits at lower cost. More weight is given to availability impact.
-
-
(Optional) To select the desired time period for recommendation results, choose your preferred value from the Evaluation period dropdown: 2 days, 1 week, 2 weeks, 4 weeks, 6 weeks, or 8 weeks. By default, the evaluation period is the last two weeks. A longer evaluation period provides more data points to the recommendation results. However, adding more data points might not improve the results if your load patterns have changed, such as after a period of exceptional demand. In this case, you can get a more focused recommendation by looking at more recent data.
Note
Recommendations are generated only for policies that are in Forecast only mode. The recommendations feature works better when a policy is in the Forecast only mode throughout the evaluation period. If you start a policy in Forecast and scale mode and switch it to Forecast only mode later, the findings for that policy are likely to be biased. This is because the policy has already contributed toward the actual capacity.
Review predictive scaling monitoring graphs
In the Amazon EC2 Auto Scaling console, you can review the forecast of the previous days, weeks, or months to visualize how well the policy performs over time. You can also use this information to evaluate the accuracy of predictions when deciding whether to let a policy scale your actual capacity.
To review predictive scaling monitoring graphs in the Amazon EC2 Auto Scaling console
-
Choose a policy from the Predictive scaling policies list.
-
In the Monitoring section, you can view your policy's past and future forecasts for load and capacity against actual values. The Load graph shows load forecast and actual values for the load metric that you chose. The Capacity graph shows the number of instances predicted by the policy. It also includes the actual number of instances launched. The vertical line separates historical values from future forecasts. These graphs become available shortly after the policy is created.
-
(Optional) To change the amount of historical data shown in the chart, choose your preferred value from the Evaluation period dropdown at the top of the page. The evaluation period does not transform the data on this page in any way. It only changes the amount of historical data shown.
The following image shows the Load and Capacity graphs when forecasts have been applied multiple times. Predictive scaling forecasts load based on your historical load data. The load your application generates is represented as the sum of the CPU utilization, network in/out, received requests, or custom metric for each instance in the Auto Scaling group. Predictive scaling calculates future capacity needs based on the load forecast and the target utilization that you want to achieve for the scaling metric.
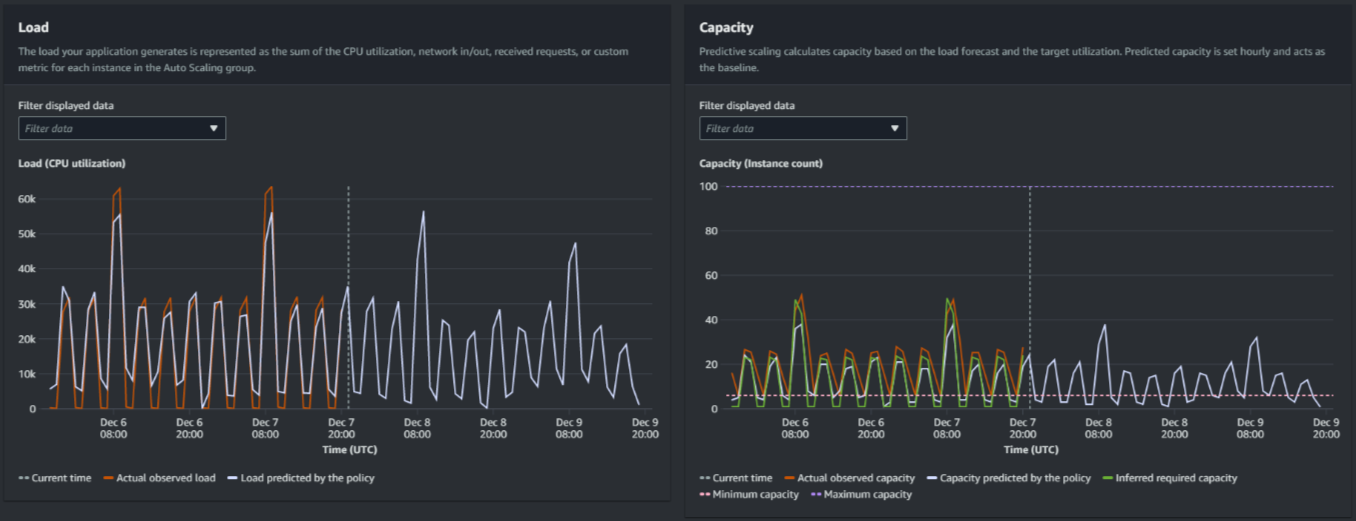
Compare data in the Load graph
Each horizontal line represents a different set of data points reported in one-hour intervals:
-
Actual observed load uses the SUM statistic for your chosen load metric to show the past total hourly load.
-
Load predicted by the policy shows the hourly load prediction. This prediction is based on the previous two weeks of actual load observations.
Compare data in the Capacity graph
Each horizontal line represents a different set of data points reported in one-hour intervals:
-
Actual observed capacity shows your Auto Scaling group's past actual capacity when the GroupTotalInstances metric is enabled. This capacity depends on your other scaling policies and the minimum group size during the selected time period.
-
Capacity predicted by the policy shows the baseline capacity that you can expect to have at the beginning of each hour when the policy is in Forecast and scale mode.
-
Inferred required capacity shows the ideal capacity to maintain the scaling metric at the target value you chose.
-
Minimum capacity shows the minimum capacity of the Auto Scaling group.
-
Maximum capacity shows the maximum capacity of the Auto Scaling group.
For the purpose of calculating the inferred required capacity, we begin by assuming that each instance is equally utilized at a specified target value. In practice, instances are not equally utilized. By assuming that utilization is uniformly spread between instances, however, we can make a likelihood estimate of the amount of capacity that is needed. The capacity requirement is then calculated to be inversely proportional to the scaling metric that you used for your predictive scaling policy. In other words, as capacity increases, the scaling metric decreases at the same rate. For example, if capacity doubles, the scaling metric must decrease by half.
The formula for the inferred required capacity:
sum of
                (actualCapacityUnits*scalingMetricValue)/(targetUtilization)
For example, we take the actualCapacityUnits (10) and
the scalingMetricValue (30) for a given hour. We then take
the targetUtilization that you specified in your predictive scaling
policy (60) and calculate the inferred required capacity for the same
hour. This returns a value of 5. This means that five is the inferred
amount of capacity required to maintain capacity in direct inverse proportion to the
target value of the scaling metric.
Note
Various levers are available for you to adjust and improve the cost savings and availability of your application.
-
You use predictive scaling for the baseline capacity and dynamic scaling to handle additional capacity. Dynamic scaling works independently from predictive scaling, scaling in and out based on current utilization. First, Amazon EC2 Auto Scaling calculates the recommended number of instances for each dynamic scaling policy. Then, it scales based on the policy that provides the largest number of instances.
-
To allow scale in to occur when the load decreases, your Auto Scaling group should always have at least one dynamic scaling policy with the scale-in portion enabled.
-
You can improve scaling performance by making sure that your minimum and maximum capacity are not too restrictive. A policy with a recommended number of instances that does not fall within the minimum and maximum capacity range will be prevented from scaling in and out.