Step 4: Create your scaling plan
On the Review and create page, review the details of your scaling plan and choose Create scaling plan. You are directed to a page that shows the status of your scaling plan. The scaling plan can take a moment to finish being created while your resources are updated.
With predictive scaling, Amazon Auto Scaling analyzes the history of the specified load metric from the past 14 days (minimum of 24 hours of data is required) to generate a forecast for two days ahead. It then schedules scaling actions to adjust the resource capacity to match the forecast for each hour in the forecast period.
After the creation of the scaling plan is complete, view the scaling plan details by choosing its name from the Scaling plans screen.
(Optional) View scaling information for a resource
Use this procedure to view the scaling information created for a resource.
Data is presented in the following ways:
-
Graphs showing recent metric history data from CloudWatch.
-
Predictive scaling graphs showing load forecasts and capacity forecasts based on data from Amazon Auto Scaling.
-
A table that lists all the predictive scaling actions scheduled for the resource.
To view scaling information for a resource
Open the Amazon Auto Scaling console at https://console.amazonaws.cn/awsautoscaling/
. -
On the Scaling plans page, choose the scaling plan.
-
On the Scaling plan details page, choose the resource to view.
Monitoring and evaluating forecasts
When your scaling plan is up and running, you can monitor the load forecast, the capacity forecast, and scaling actions to examine the performance of predictive scaling. All of this data is available in the Amazon Auto Scaling console for all Auto Scaling groups that are enabled for predictive scaling. Keep in mind that your scaling plan requires at least 24 hours of historical load data to make the initial forecast.
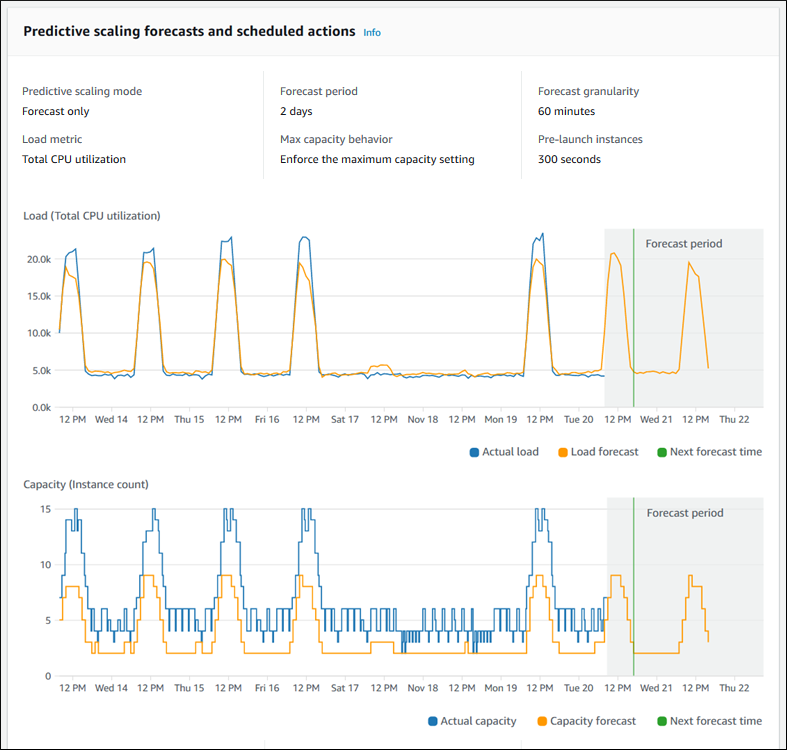
In the following example, the left side of each graph shows a historical pattern. The right side shows the forecast that was generated by the scaling plan for the forecast period. Both actual and forecast values (in blue and orange) are plotted.

Amazon Auto Scaling learns from your data automatically. First, it makes a load forecast. Then, a capacity forecast calculation determines the minimum number of instances that are required to support the application. Based on the capacity forecast, Amazon Auto Scaling schedules scaling actions that scale the Auto Scaling group in advance of predicted load changes. If dynamic scaling is enabled (recommended), the Auto Scaling group can scale out additional capacity (or remove capacity) based on the current utilization of the group of instances.
When evaluating how well predictive scaling performs, monitor how closely the actual and forecast values match over time. When you create a scaling plan, Amazon Auto Scaling provides graphs based on the most recent actual data. It also provides an initial forecast for the next 48 hours. However, when the scaling plan is created, there is very little forecast data to compare the actual data to. Wait until the scaling plan has obtained forecast values for a few periods before comparing the historical forecast values against the actual values. After a few days of daily forecasts, you'll have a larger sample of forecast values to compare with actual values.
For patterns that occur on a daily basis, the time interval between creating your scaling plan and evaluating the forecast effectiveness can be as short as a few days. However, this length of time is insufficient to evaluate the forecast based on a recent pattern change. For example, let's say you are looking at the forecast for an Auto Scaling group that started a new marketing campaign in the past week. The campaign significantly increases your web traffic for the same two days each week. In situations like this, we recommend waiting for the group to collect a full week or two of new data before evaluating the effectiveness of the forecast. The same recommendation applies for a brand new Auto Scaling group that has only started to collect metric data.
If the actual and forecast values don't match after monitoring them over an appropriate length of time, you should also consider your choice of load metric. To be effective, the load metric must represent a reliable and accurate measure of the total load on all instances in the Auto Scaling group. The load metric is core to predictive scaling. If you choose a non-optimal load metric, it can prevent predictive scaling from making accurate load and capacity forecasts and scheduling the correct capacity adjustments for your Auto Scaling group.