Overview of a DataBrew project session
In a DataBrew project session, you work within an interactive workspace.
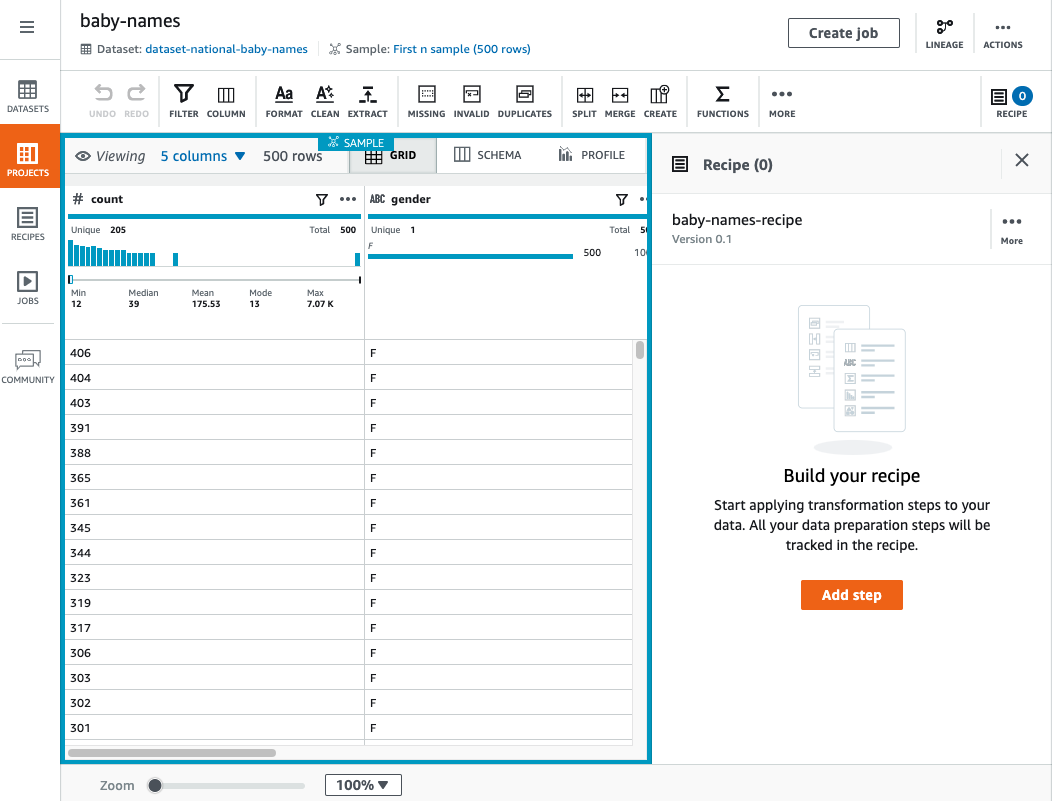
The left pane shows the current view of your data. The right pane shows the project's transformation recipe, which is currently empty.
In the upper-right corner of the data grid, there are three tabs: GRID,
SCHEMA, and PROFILE. Choosing one of these tabs displays a
corresponding view in the workspace; thees views are described next.
Grid view
Grid view is the default view, where the sample is shown in tabular format. Use the following procedure for a short walkthrough of grid view.
To take a walkthrough of grid view
-
Start by viewing the entire space:
-
Scroll left and right to see all of the columns.
-
Scroll up and down to see all of the data values.
-
Use the zoom control at the bottom of the workspace to adjust the magnification level of the grid.
-
-
At upper-right, view how many of the sample's columns are shown and the current number of rows in the sample.
To change which columns are shown, choose the N columns link (where N is the number of columns currently displayed). Choose the columns that you want, and choose Show selected columns.
-
Now you can start experimenting with DataBrew transformations. Try the following:
-
From the transformation toolbar, choose Choose Format, Change to uppercase.
-
For Source column, choose a column that contains character data.
-
Leave the other settings at their defaults.
-
To see what the transformed data will look like, choose Preview changes. Then, to add this transformation to your recipe, choose Apply.
Whenever you apply a data transformation, DataBrew adds it to the working copy of your recipe. This appears at the right side of your workspace.
-
Try the following:
-
From the transformation toolbar, choose Create, Based on a function.
-
For Select a function, choose
SQUARE ROOT. -
For Source column, choose a column that contains numeric data.
-
Leave the other settings at their defaults,.
-
Choose Preview changes to see what the transformed data looks like. Then, to add this transformation to your recipe, choose Apply.
-
-
Collapse the recipe pane at upper right by choosing RECIPE. To expand the recipe pane, choose RECIPE again.
Publishing a new version of your recipe
As you continue applying transformations, the number of steps in the recipe increases. At any time, you can publish a new version of your recipe. Publishing a recipe makes it available elsewhere in DataBrew. By doing this, you can run a recipe job to transform your entire dataset, as opposed to transforming only the project data sample.
Publishing recipes also encourages an incremental, iterative approach to recipe development: You can publish new versions of your recipe as you go, so you can fall back to a "last known good" recipe version if needed.
To publish a new version of a recipe
In the recipe pane, choose Publish. Enter a description for this version of the recipe, and choose Publish.
Schema view
If you choose the SCHEMA tab, the view changes, as shown in the screenshot following.
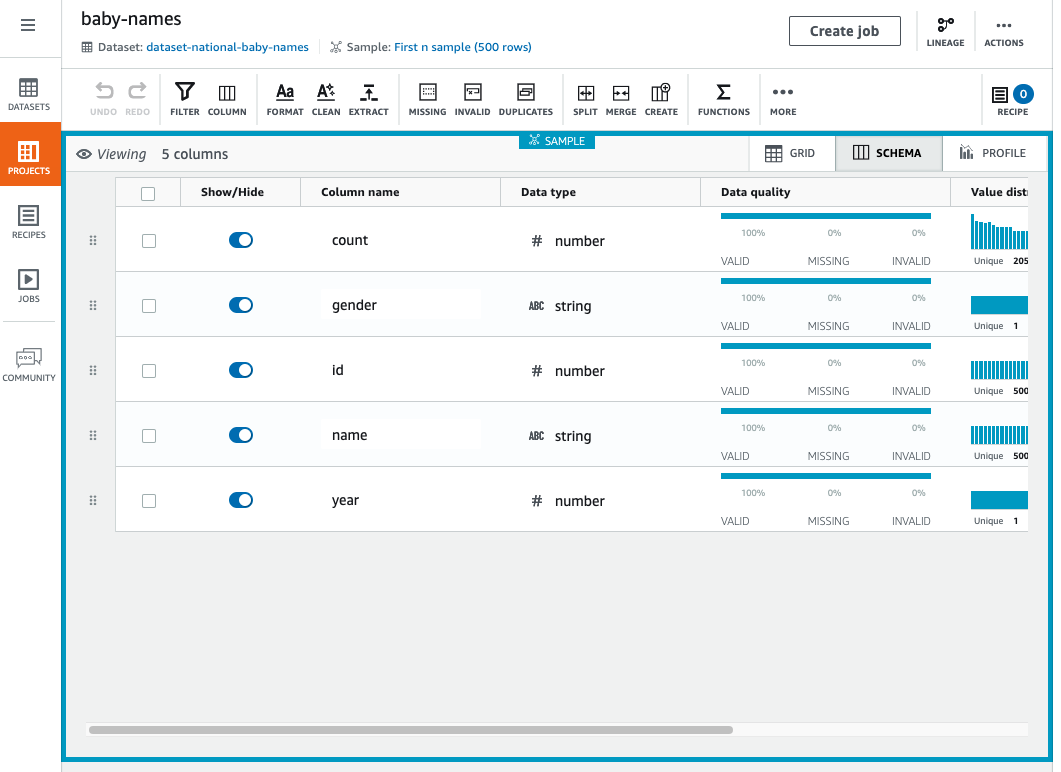
In schema view, you can see statistics about the data values in each column.
In the far left column, next to Show/Hide, choose any of the data columns. The Column details pane appears at right. This pane shows a summary of statistics for the column values.
You can rename a column by entering a new name for Column name.
You can rearrange the column order by dragging and dropping the columns.
Profile view
If you choose the PROFILE tab, you can see detailed volumetric information about your project. Before doing so, you run a DataBrew job to create the profile.
To take a walkthrough of profile view
-
Choose Create job, and enter a name for your job.
-
For Job output, choose CSV for the file type.
-
Find or create an Amazon S3 bucket and folder in your Amazon account where you want the job output from DataBrew to be written:
-
If you already have this Amazon S3 bucket and folder, choose Browse and locate them. Make sure that you have write permissions for both.
-
If you don't have this Amazon S3 bucket and folder, create them:
Open the Amazon S3 console at https://console.amazonaws.cn/s3/
. -
If you don't have an Amazon S3 bucket, choose Create bucket. For Bucket name, enter a unique name for your new bucket. Choose Create bucket.
-
From the list of buckets, choose the one that you want to use.
-
Choose Create folder. For Folder name, enter
databrew-output, and choose Create folder.
-
-
For Access permissions, choose an IAM role that allows DataBrew to write to your Amazon S3 output location.
For an S3 location owned by your Amazon account, you can choose the
AwsGlueDataBrewDataAccessRoleservice-managed role. Doing this allows DataBrew to access S3 resources that you own. -
Leave the other settings at their defaults, and choose Create and run job.
-
After the job runs to completion, the workspace displays a graphical summary of the data profile.
The Data profile overview tab shows a high-level summary of your data's characteristics, as shown in the screenshot following.
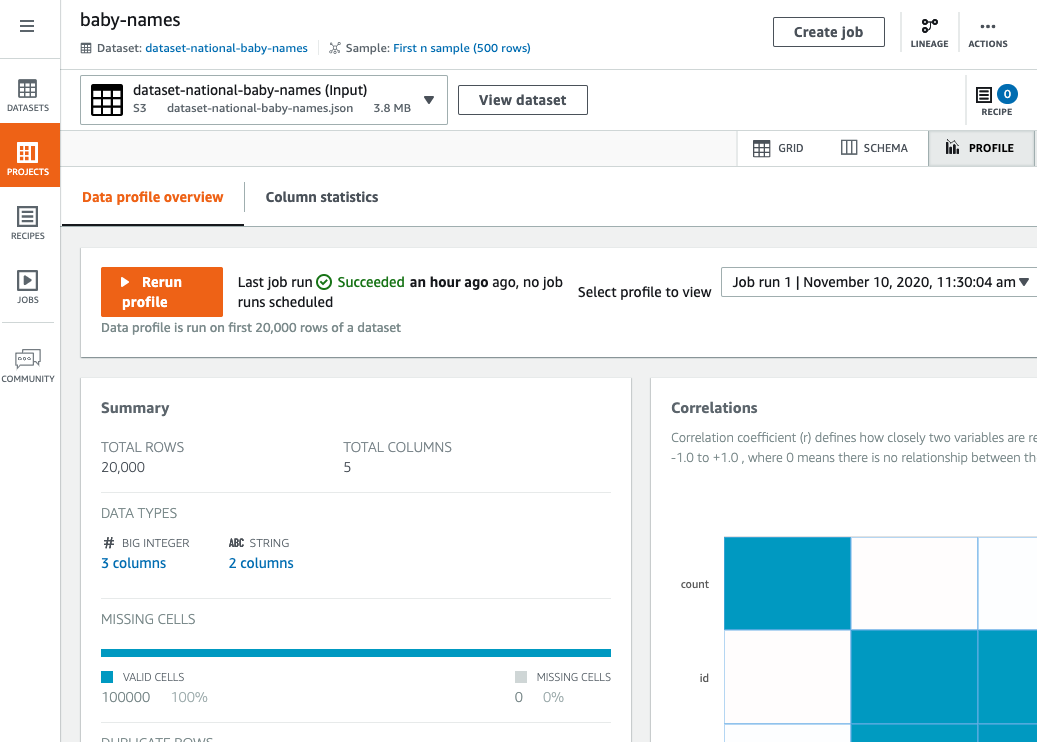
The Column statistics tab shows a column-by-column breakdown of the data values:
