Collecting data for Amazon DMS Fleet Advisor
Important
End of support notice: On May 20, 2026, Amazon will end support for Amazon Database Migration Service Fleet Advisor. After May 20, 2026, you will no longer be able to access the Amazon DMS Fleet Advisor console or Amazon DMS Fleet Advisor resources. For more information, see Amazon DMS Fleet Advisor end of support.
To start collecting data, select the objects on the Monitored objects page, and choose Run data collection. DMS data collector can collect from up to 100 databases at one time. Also, DMS data collector can use up to eight parallel threads to connect to databases in your environment. From these eight threads, DMS data collector can use up to five parallel threads to connect to a single database instance.
Important
Before starting to collect data, view the Software check section on the DMS data collector home page. Verify that all database engines that you want to monitor have the Passed status. If some database engines have the Failed status, and you have database servers with corresponding engines in your monitored objects list, fix the issue before proceeding. You can find tips next to the Failed status listed in the Software check section.
DMS data collector can work in two modes: single run or ongoing monitoring. After you start data collection, the Run data collection dialog box opens. Next, choose one of the two following options.
- Metadata and database capacity
-
DMS data collector collects information from the database or OS servers. It includes schemas, versions, editions, CPU, memory, and disk capacity. DMS data collector also collects and provides metrics such as IOPS, I/O throughput and active datbase server connections. You can compute target recommendations in DMS Fleet Advisor based on this information. If the source database is over- or underprovisioned, then the target recommendations also will be over- or underprovisioned.
This is the default option.
- Metadata, database capacity, and resource utilization
-
In addition to metadata and database capacity information, DMS data collector collects actual utilization metrics of CPU, memory, and disk capacity for the databases or OS servers. DMS data collector also collects and provides metrics such as IOPS, I/O throughput and active datbase server connections. Target recommendations provided will be more accurate because they are based on the actual database workloads.
If you choose this option, then you set the period of data collection. You can collect data during the Next 7 days or set the Custom range of 1–60 days.
After data collection begins, you're redirected to the Data collection page, where you can see how the collection queries run and monitor the live progress. Here, you can view overall collection health or on the DMS data collector home page. If overall data collection health is less than 100 percent, you might need to fix issues related to the collection.
If you run the DMS data collector in the Metadata and database capacity mode, then you can see the number of completed queries on the Data collection page.
If you run the DMS data collector in the Metadata, database capacity, and resource utilization mode, then you can see the remaining time before your DMS data collector completes the monitoring.
On the Data collection page, you can see the collection status for each object. If something isn't working properly, a message appears showing how many issues occurred. To help determine a fix to an issue, you can check details. The following tabs list potential issues:
-
Summary by query – Shows status of tests like the Ping test. You can filter results in the Status column. The Status column provides a message indicating how many failures occurred during data collection.
-
Summary by a monitored object – Shows overall status per object.
-
Summary by query type – Shows status for type of collector query, such as SQL, Secure Shell (SSH), or Windows Management Instrumentation (WMI) calls.
-
Summary by issue – Shows all unique issues that occurred, with issue names and the number of times that each issue occurs.
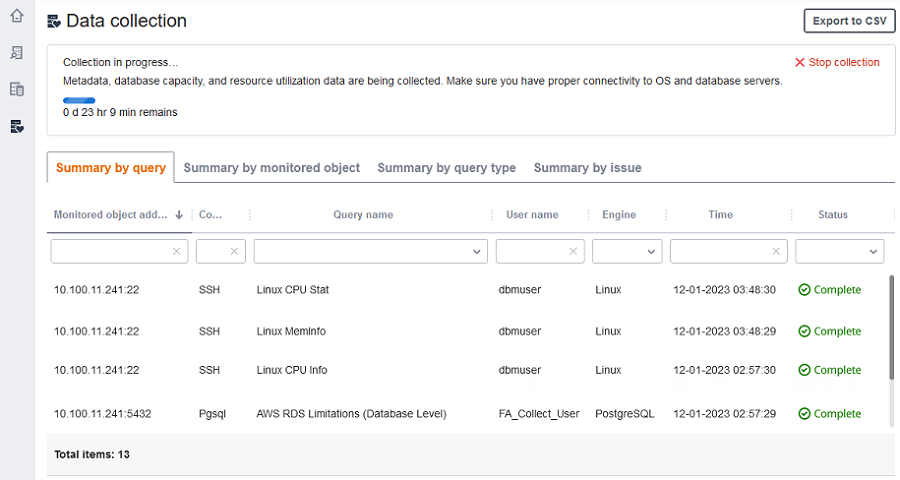
To export the collection results, choose Export to CSV.
After identifying issues and resolving them, choose Start collection and rerun the data collection process. After performing data collection, the data collector uses secure connections to upload collected data to a DMS Fleet Advisor inventory. DMS Fleet Advisor stores information in your Amazon S3 bucket. For information about configuring credentials for data forwarding, see Configuring credentials for data forwarding.
Collecting capacity and resource utilization metrics with Amazon DMS Fleet Advisor
You can collect metadata and performance metrics in two modes: single run or ongoing monitoring. Depending on the option that you select, your DMS data collector tracks different metrics in your data environment. During a single run, your DMS data collector tracks only metadata metrics from your database and OS servers. During ongoing monitoring, your DMS data collector tracks the actual utilization of your resources.
Amazon DMS gathers the following metadata and metrics during a single run of your DMS data collector.
Available memory on your OS servers
Available storage on your OS servers
Database version and edition
Number of CPUs on your OS servers
Number of schemas
Number of stored procedures
Number of tables
Number of triggers
Number of views
Schema structure
DMS Fleet Advisor uses these metrics to build an inventory of your database and OS servers. Also, DMS Fleet Advisor uses these metadata and metrics to analyze your source database schemas.
DMS Fleet Advisor can generate target recommendations using the metrics collected during a single run of the data collector. However, in this case for your overprovisioned source databases, the target recommendation is also overprovisioned. Thus, you incur additional costs on the maintenance of your resources in the Amazon Web Services Cloud. For underprovisioned source databases, the target recommendation is also underprovisioned, which might lead to performance issues. We recommend to collect the data using ongoing monitoring by choosing the metadata, database capacity, and resource utilization mode for the DMS data collector.
Amazon DMS gathers the following metrics during ongoing monitoring. You can run your DMS data collector for a period of 1 to 60 days.
I/O throughput on your database servers
Input/output operations per second (IOPS) on your database servers
Number of CPUs that your OS servers use
Memory usage on your OS servers
Number of active database and OS server connections
DMS Fleet Advisor uses these metrics to generate accurate target recommendations, so your target databases meet your performance needs. This can prevent additional cost incurred on the maintenance of your resources in the Amazon Web Services Cloud.
How does the Amazon DMS Fleet Advisor collect capacity and resource utilization metrics?
DMS Fleet Advisor collects performance metrics every minute.
For Oracle and SQL Server, DMS Fleet Advisor runs SQL queries to capture values for each database metric.
For MySQL and PostgreSQL, DMS Fleet Advisor collects performance metrics from the OS server where your database runs. In Windows, DMS Fleet Advisor runs WMI Query Language (WQL) scripts and receives WMI data. In Linux, DMS Fleet Advisor runs commands that capture the OS server metrics.
Important
Running remote SQL scripts can impact the performance of your production databases. However, the data collection queries don't contain any calculation logic. Thus, the data collection process isn't likely to use more than 1 percent of your database resources.
You can view all queries that the data collector runs to collect metrics. To do
so, open the DMSCollector.Collections.json file. You can find
this file in the etc folder located in the same folder where
you installed the data collector. The default path is
C:\ProgramData\Amazon\Amazon DMS
                    Collector\etc\DMSCollector.Collections.json
.
The DMS data collector uses the local file system as the temporary storage for all collected
data. The DMS data collector stores the collected data in JSON format. You can use the local
collector in an offline mode and manually check or verify the collected files before
you configure data forwarding. You can see all collected files in the
out folder located in the same folder where you installed
the DMS data collector. The default path is C:\ProgramData\Amazon\Amazon DMS
Collector\out.
Important
If you run your DMS data collector in an offline mode and store the collected data on your server for more that 14 days, then you can't use Amazon CloudWatch to display these metrics. However, DMS Fleet Advisor still uses this data to generate recommendations. For more information about CloudWatch charts, see Recommendation details.
You can also check or verify the collected data files in an online mode. The DMS data collector forwards all data to the Amazon S3 bucket that you specified in the DMS data collector settings.
You can use your DMS data collector to collect data from on-premises databases. Also, you can collect data from Amazon RDS and Aurora databases. However, you can't successfully run all DMS data collector queries in the cloud because of the differences between Amazon RDS or Aurora and on-premises DB instances. Because the DMS data collector gathers utilization metrics for MySQL and PostgreSQL databases from the host OS, this approach won't work with Amazon RDS and Aurora.