Monitoring Amazon DocumentDB with CloudWatch
Amazon DocumentDB (with MongoDB compatibility) integrates with Amazon CloudWatch so that you can gather and analyze operational metrics for your clusters. You can monitor these metrics using the CloudWatch console, the Amazon DocumentDB console, the Amazon Command Line Interface (Amazon CLI), or the CloudWatch API.
CloudWatch also lets you set alarms so that you can be notified if a metric value breaches a threshold that you specify. You can even set up Amazon CloudWatch Events to take corrective action if a breach occurs. For more information about using CloudWatch and alarms, see the Amazon CloudWatch documentation.
Topics
Amazon DocumentDB metrics
To monitor the health and performance of your Amazon DocumentDB cluster and instances, you can view the following metrics in the Amazon DocumentDB console.
Note
Metrics in the following tables apply to both instance-based and elastic clusters.
Topics
Resource utilization metrics
| Metric | Description |
|---|---|
BackupRetentionPeriodStorageUsed |
The total amount of backup storage in bytes used to support
the point-in-time restore feature within the Amazon DocumentDB's
retention window. Included in the total reported by the
TotalBackupStorageBilled metric. Computed
separately for each Amazon DocumentDB cluster. |
ChangeStreamLogSize |
The amount of storage used by your cluster
to store the change stream log in megabytes. This value is
a subset of the total storage for the cluster
(VolumeBytesUsed) and affects the cost of the
cluster. For storage pricing information, see the
Amazon DocumentDB product page |
CPUUtilization |
The percentage of CPU used by an instance. |
DatabaseConnections |
The number of connections (active and idle) open on an instance taken at a 1-minute frequency. |
DatabaseConnectionsMax |
The maximum number of open database connections (active and idle) on an instance in a 1-minute period. |
DatabaseConnectionsLimit |
The maximum number of concurrent database connections (active and idle) allowed on an instance at any given time. |
DatabaseConnectionsActiveMax |
The maximum number of active database connections on an instance in a 1-minute period. Active connections are those currently running an operation, as opposed to idle connections. For the active connection limits per instance type, see Instance limits. |
DatabaseCursors |
The number of cursors open on an instance taken at a 1-minute frequency. |
DatabaseCursorsMax |
The maximum number of open cursors on an instance in a 1-minute period. |
DatabaseCursorsLimit |
The maximum number of cursors allowed on an instance at any given time. |
DatabaseCursorsTimedOut |
The number of cursors that timed out in a 1-minute period. |
FreeableMemory |
The amount of available random access memory, in bytes. |
FreeLocalStorage |
This metric reports the amount of storage available to each instance for temporary tables and logs. This value depends on the instance class. You can increase the amount of free storage space for an instance by choosing a larger instance class for your instance. (This doesn't apply to DocumentDB Serverless.) |
LowMemThrottleQueueDepth |
The queue depth for requests that are throttled due to low available memory taken at a 1-minute frequency. |
LowMemThrottleMaxQueueDepth |
The maximum queue depth for requests that are throttled due to low available memory in a 1-minute period. |
LowMemNumOperationsThrottled |
The number of requests that are throttled due to low available memory in a 1-minute period. |
SnapshotStorageUsed |
The total amount of backup storage in bytes
consumed by all snapshots for a given Amazon DocumentDB cluster
outside its backup retention window. Included in the total
reported by the TotalBackupStorageBilled metric.
Computed separately for each Amazon DocumentDB cluster. |
SwapUsage |
The amount of swap space used on the instance. |
TotalBackupStorageBilled |
The total amount of backup storage in bytes for which you are billed for a given Amazon DocumentDB cluster. Includes the backup storage measured by the BackupRetentionPeriodStorageUsed and SnapshotStorageUsed metrics. Computed separately
for each Amazon DocumentDB cluster. |
TransactionsOpen |
The number of transactions open on an instance taken at a 1-minute frequency. |
TransactionsOpenMax |
The maximum number of transactions open on an instance in a 1-minute period. |
TransactionsOpenLimit |
The maximum number of concurrent transactions allowed on an instance at any given time. |
VolumeBytesUsed |
The amount of storage used by your cluster
in bytes. This value affects the cost of the cluster. For
pricing information, see the
Amazon DocumentDB product page |
Latency metrics
| Metric | Description |
|---|---|
DBClusterReplicaLagMaximum |
The maximum amount of lag, in milliseconds, between the primary instance and each Amazon DocumentDB instance in the cluster. |
DBClusterReplicaLagMinimum |
The minimum amount of lag, in milliseconds, between the primary instance and each replica instance in the cluster. |
DBInstanceReplicaLag |
The amount of lag, in milliseconds, when replicating updates from the primary instance to a replica instance. |
ReadLatency |
The average amount of time taken per disk I/O operation. |
WriteLatency |
The average amount of time, in milliseconds, taken per disk I/O operation. |
NVMe-backed instance metrics
| Metric | Description |
|---|---|
NVMeStorageCacheHitRatio |
The percentage of requests that are served by the tiered cache. |
FreeNVMeStorage |
The amount of available Ephemeral NVMe storage. |
ReadIOPSNVMeStorage |
The average number of disk read I/O operations to Ephemeral NVMe storage. |
ReadLatencyNVMeStorage |
The average amount of time taken per disk read I/O operation for Ephemeral NVMe storage. |
ReadThroughputNVMeStorage |
The average number of bytes read from disk per second for Ephemeral NVMe storage. |
WriteIOPSNVMeStorage |
The average number of disk write I/O operations to Ephemeral NVMe storage. |
WriteLatencyNVMeStorage |
The average amount of time taken per disk write I/O operation for Ephemeral NVMe storage. |
WriteThroughputNVMeStorage |
The average number of bytes written to disk per second for Ephemeral NVMe storage. |
Operations metrics
| Metric | Description |
|---|---|
DocumentsDeleted |
The number of deleted documents in a 1-minute period. |
DocumentsInserted |
The number of inserted documents in a 1-minute period. |
DocumentsReturned |
The number of returned documents in a 1-minute period. |
DocumentsUpdated |
The number of updated documents in a 1-minute period. |
OpcountersCommand |
The number of commands issued in a 1-minute period. |
OpcountersDelete |
The number of delete operations issued in a 1-minute period. |
OpcountersGetmore |
The number of getmores issued in a 1-minute period. |
OpcountersInsert |
The number of insert operations issued in a 1-minute period. |
OpcountersQuery |
The number of queries issued in a 1-minute period. |
OpcountersUpdate |
The number of update operations issued in a 1-minute period. |
TransactionsStarted |
The number of transactions started on an instance in a 1-minute period. |
TransactionsCommitted |
The number of transactions committed on an instance in a 1-minute period. |
TransactionsAborted |
The number of transactions aborted on an instance in a 1-minute period. |
TTLDeletedDocuments |
The number of documents deleted by a TTLMonitor in a 1-minute period. |
Command-level metrics
Amazon DocumentDB publishes per-command latency and concurrency metrics to CloudWatch. These metrics help you identify which operations contribute most to your workload and detect tail-latency issues or concurrency pressure.
Each command in the following table emits three metrics in a 1-minute period:
AvgDuration— The average execution time of the command, in microseconds.P100Duration— The maximum execution time of the command (100th percentile), in microseconds.MaxConcurrent— The maximum number of concurrent executions of the command.
Metric names follow the pattern
Command..
For example, commandName.metricNameCommand.find.AvgDuration or
Command.aggregate.MaxConcurrent.
| Metric | Description |
|---|---|
Command.find |
Read queries using find. |
Command.insert |
Document insert operations. |
Command.findAndModify |
Atomic find-and-modify operations. |
Command.update |
Document update operations. |
Command.delete |
Document delete operations. |
Command.aggregate |
Aggregation pipeline executions. |
Command.count |
Count operations. |
Command.distinct |
Distinct value queries. |
Command.getMore |
Cursor batch retrieval operations. |
Command.abortTransaction |
Transaction abort operations. |
Command.commitTransaction |
Transaction commit operations. |
Throughput metrics
| Metric | Description |
|---|---|
NetworkReceiveThroughput |
The amount of network throughput, in bytes per second, received from clients by each instance in the cluster. This throughput doesn't include network traffic between instances in the cluster and the cluster volume. |
NetworkThroughput |
The amount of network throughput, in bytes per second, both received from and transmitted to clients by each instance in the Amazon DocumentDB cluster. This throughput doesn't include network traffic between instances in the cluster and the cluster volume. |
NetworkTransmitThroughput |
The amount of network throughput, in bytes per second, sent to clients by each instance in the cluster. This throughput doesn't include network traffic between instances in the cluster and the cluster volume. |
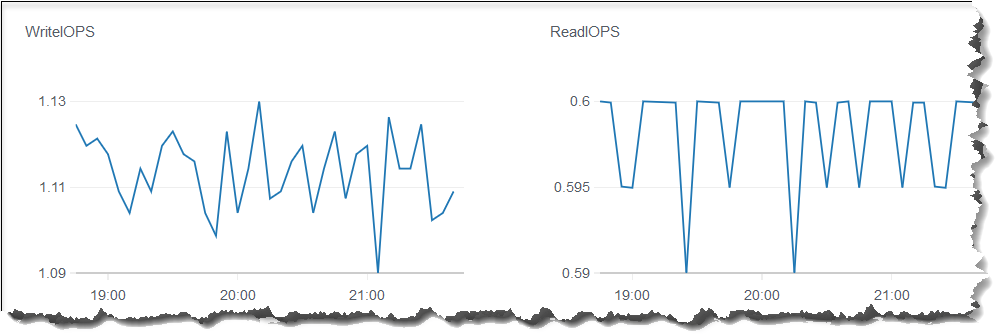
ReadIOPS |
The average number of disk read I/O operations per second. Amazon DocumentDB reports read and write IOPS separately, and on 1-minute intervals. |
ReadThroughput |
The average number of bytes read from disk per second. |
StorageNetworkReceiveThroughput |
The amount of network throughput, in bytes per second, received from the Amazon DocumentDB cluster storage volume by each instance in the cluster. |
StorageNetworkTransmitThroughput |
The amount of network throughput, in bytes per second, sent to the Amazon DocumentDB cluster storage volume by each instance in the cluster. |
StorageNetworkThroughput |
The amount of network throughput, in bytes per second, received and sent to the Amazon DocumentDB cluster storage volume by each instance in the Amazon DocumentDB cluster. |
VolumeReadIOPs |
The average number of billed read I/O operations from a cluster volume, reported at 5-minute intervals. Billed read operations are calculated at the cluster volume level, aggregated from all instances in the cluster, and then reported at 5-minute intervals. The value is calculated by taking the value of the read operations metric over a 5-minute period. You can determine the amount of billed read operations per second by taking the value of the billed read operations metric and dividing by 300 seconds. For example, if the You accrue billed read operations for queries that request database pages that are not present in the buffer cache and therefore must be loaded from storage. You might see spikes in billed read operations as query results are read from storage and then loaded into the buffer cache. |
VolumeWriteIOPs |
The average number of billed write I/O operations from a cluster volume, reported at 5-minute intervals. Billed write operations are calculated at the cluster volume level, aggregated from all instances in the cluster, and then reported at 5-minute intervals. The value is calculated by taking the value of the write operations metric over a 5-minute period. You can determine the amount of billed write operations per second by taking the value of the billed write operations metric and dividing by 300 seconds. For example, if the Note that |
WriteIOPS |
The average number of disk write I/O operations per second. When used on a cluster level, WriteIOPs are evaluated across all instances in the cluster. Read and write IOPS are reported separately, on 1-minute intervals. |
WriteThroughput |
The average number of bytes written to disk per second. |
System metrics
| Metric | Description |
|---|---|
AvailableMVCCIds |
A counter that shows the number of remaining write operations available before reaching zero. When this counter reaches zero, your cluster will enter read-only mode until IDs are reclaimed and recycled. The counter decreases with each write operation and increases as garbage collection recycles old MVCC IDs. |
BufferCacheHitRatio |
The percentage of requests that are served by the buffer cache. |
DiskQueueDepth |
The number of I/O operations that are waiting to be written to or read from disk. |
EngineUptime |
The amount of time, in seconds, that the instance has been running. |
IndexBufferCacheHitRatio |
The percentage of index requests that are served by the buffer cache. You might see a spike greater than 100 percent for the metric right after you drop an index, collection or database. This will automatically be corrected after 60 seconds. This limitation will be fixed in a future patch update. |
LongestActiveGCRuntime |
Duration in seconds of the longest active garbage collection process. Updates every minute and tracks only active operations, excluding processes that complete within the one-minute window. |
T3 instance metrics
| Metric | Description |
|---|---|
CPUCreditUsage |
The number of CPU credits spent during the measurement period. |
CPUCreditBalance |
The number of CPU credits that an instance has accrued. This balance is depleted when the CPU bursts and CPU credits are spent more quickly than they are earned. |
CPUSurplusCreditBalance |
The number of surplus CPU credits spent to sustain CPU performance when the CPUCreditBalance value is zero. |
CPUSurplusCreditsCharged |
The number of surplus CPU credits exceeding the maximum number of CPU credits that can be earned in a 24-hour period, and thus attracting an additional charge. For more information, see Monitoring your CPU credits. |
Viewing CloudWatch data
You can view Amazon CloudWatch data using the CloudWatch console, the Amazon DocumentDB console, Amazon Command Line Interface (Amazon CLI), or the CloudWatch API.

Amazon DocumentDB dimensions
The metrics for Amazon DocumentDB are qualified by the values for the account or operation. You can use the CloudWatch console to retrieve Amazon DocumentDB data filtered by any of the dimensions in the following table.
| Dimension | Description |
|---|---|
DBClusterIdentifier |
Filters the data that you request for a specific Amazon DocumentDB cluster. |
DBClusterIdentifier, Role |
Filters the data that you request for a specific Amazon DocumentDB cluster, aggregating the metric by instance role (WRITER/READER). For example, you can aggregate metrics for all READER instances that belong to a cluster. |
DBInstanceIdentifier |
Filters the data that you request for a specific database instance. |
Monitoring opcounter metrics
Opcounter metrics have a non-zero value (usually ~50) for idle clusters. This is because Amazon DocumentDB performs periodic health checks, internal operations, and metrics collection tasks.
Monitoring database connections
When you view the number of connections by using database engine
commands such as db.runCommand( { serverStatus: 1 }), you
might see up to 10 more connections than you see in
DatabaseConnections through CloudWatch.
This occurs because Amazon DocumentDB performs periodic health checks and metrics
collection tasks that don't get accounted for in DatabaseConnections.
DatabaseConnections represents customer-initiated
connections only.