Help improve this page
To contribute to this user guide, choose the Edit this page on GitHub link that is located in the right pane of every page.
Deploy Prometheus using Helm
As an alternative to using Amazon Managed Service for Prometheus, you can deploy Prometheus into your cluster with Helm. If you already have Helm installed, you can check your version with the helm version command. Helm is a package manager for Kubernetes clusters. For more information about Helm and how to install it, see Deploy applications with Helm on Amazon EKS.
After you configure Helm for your Amazon EKS cluster, you can use it to deploy Prometheus with the following steps.
-
Create a Prometheus namespace.
kubectl create namespace prometheus -
Add the
prometheus-communitychart repository.helm repo add prometheus-community https://prometheus-community.github.io/helm-charts -
Deploy Prometheus.
helm upgrade -i prometheus prometheus-community/prometheus \
    --namespace prometheus \
    --set alertmanager.persistence.storageClass="gp2" \
    --set server.persistentVolume.storageClass="gp2"
Note
If you get the error
Error: failed to download "stable/prometheus" (hint: running helm repo update may help)when executing this command, runhelm repo update prometheus-community, and then try running the Step 2 command again.If you get the error
Error: rendered manifests contain a resource that already exists, runhelm uninstall, then try running the Step 3 command again.your-release-name-nnamespace -
Verify that all of the Pods in the
prometheusnamespace are in theREADYstate.kubectl get pods -n prometheusAn example output is as follows.
NAME READY STATUS RESTARTS AGE prometheus-alertmanager-59b4c8c744-r7bgp 1/2 Running 0 48s prometheus-kube-state-metrics-7cfd87cf99-jkz2f 1/1 Running 0 48s prometheus-node-exporter-jcjqz 1/1 Running 0 48s prometheus-node-exporter-jxv2h 1/1 Running 0 48s prometheus-node-exporter-vbdks 1/1 Running 0 48s prometheus-pushgateway-76c444b68c-82tnw 1/1 Running 0 48s prometheus-server-775957f748-mmht9 1/2 Running 0 48s -
Use
kubectlto port forward the Prometheus console to your local machine.kubectl --namespace=prometheus port-forward deploy/prometheus-server 9090 -
Point a web browser to
http://localhost:9090to view the Prometheus console. -
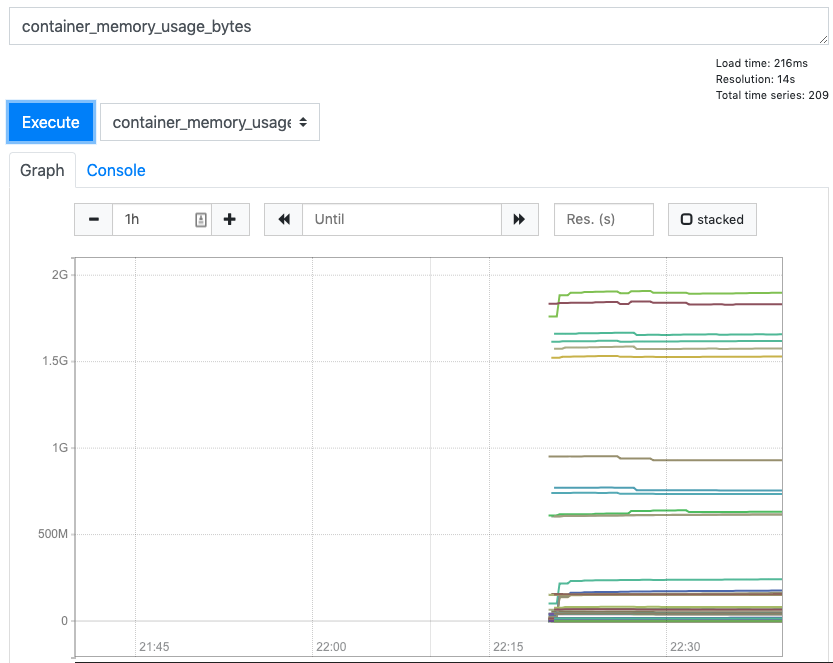
Choose a metric from the - insert metric at cursor menu, then choose Execute. Choose the Graph tab to show the metric over time. The following image shows
container_memory_usage_bytesover time.
-
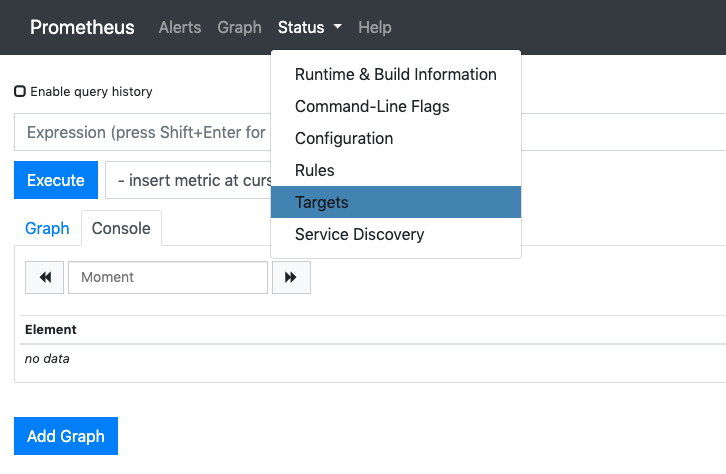
From the top navigation bar, choose Status, then Targets.

All of the Kubernetes endpoints that are connected to Prometheus using service discovery are displayed.