Monitoring with Amazon CloudWatch
You can monitor Amazon FSx for Lustre using CloudWatch, which collects and processes raw data from Amazon FSx for Lustre into readable, near real-time metrics. These statistics are retained for a period of 15 months, so that you can access historical information and gain a better perspective on how your application or service is performing. For more information about CloudWatch, see What is Amazon CloudWatch? in the Amazon CloudWatch User Guide.
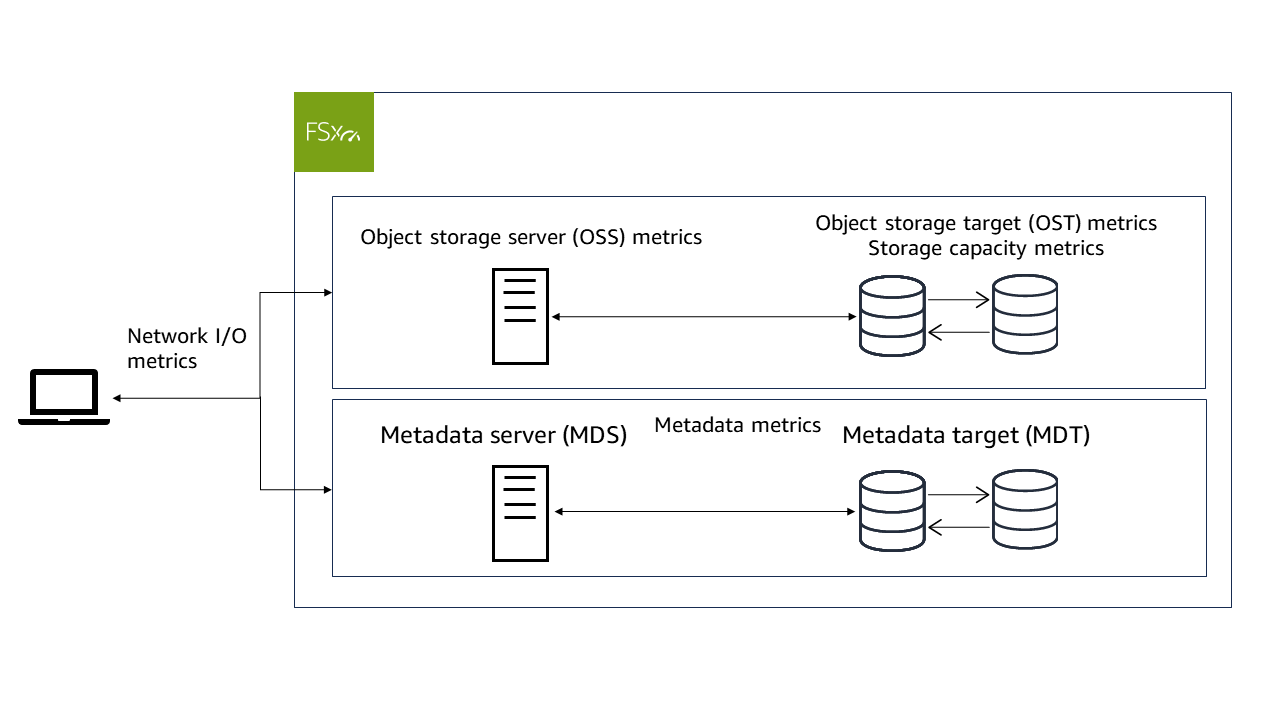
CloudWatch metrics for FSx for Lustre are organized into six categories:
Network I/O metrics – Measure activity between clients and your file system.
Object storage server metrics – Measure object storage server (OSS) network throughput and disk throughput utilization.
Object storage target metrics – Measure object storage target (OST) disk throughput and disk IOPS utilization.
Metadata metrics – Measure metadata server (MDS) CPU utilization, metadata target (MDT) IOPS utilization, and client metadata operations.
Storage capacity metrics – Measure storage capacity utilization.
S3 data repository metrics – Measure age of oldest message waiting to be imported or exported, and renames processed by the file system.
The following diagram illustrates an FSx for Lustre file system, its components, and its metric categories.

FSx for Lustre sends metric data to CloudWatch at 1-minute intervals.
Note
Metrics may not be published during file system maintenance windows for your Amazon FSx for Lustre file system.