Visualizing Amazon Glue streaming metrics
To plot visual metrics:
Go to Metrics in the Amazon CloudWatch console and then choose the Browse tab. Then choose Glue under "Custom namespaces".

Choose Job Metrics to show you the metrics for all your jobs.
Filter the metrics based on your JobName=glue-feb-monitoring and then JobRunId=ALL. You can click on the "+" sign as shown in the figure below to add it to the search filter.
Select the checkbox for the metrics that you are interested in. In the below figure we have selected
numberAllExecutorsandnumberMaxNeededExecutors.
Once you have selected these metrics, you can go to the Graphed metrics tab and apply your statistics.
Since the metrics are emitted every min, you can apply the "average" over a minute for
batchProcessingTimeInMsandmaxConsumerLagInMs. For thenumRecordsyou can apply the "sum" over every minute.You can add a horizontal
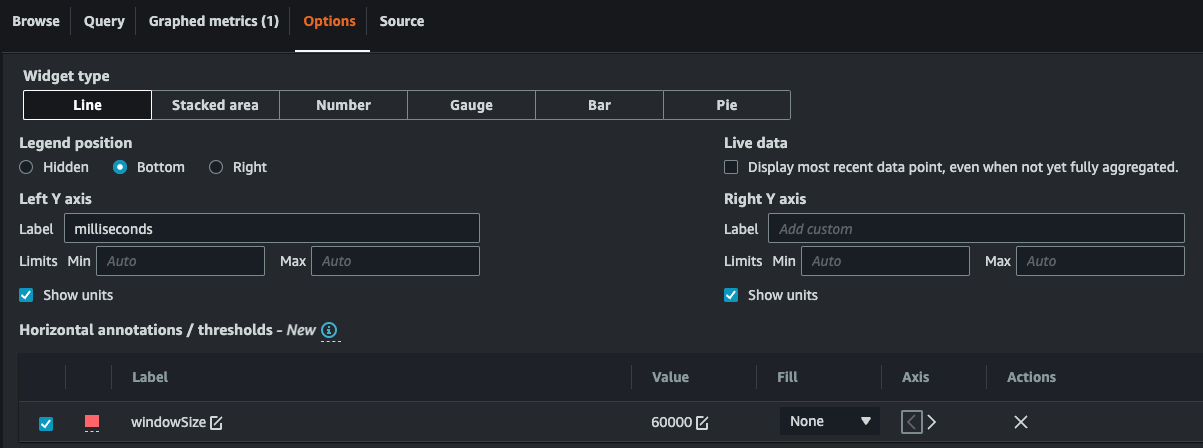
windowSizeannotation to your graph using the Options tab.
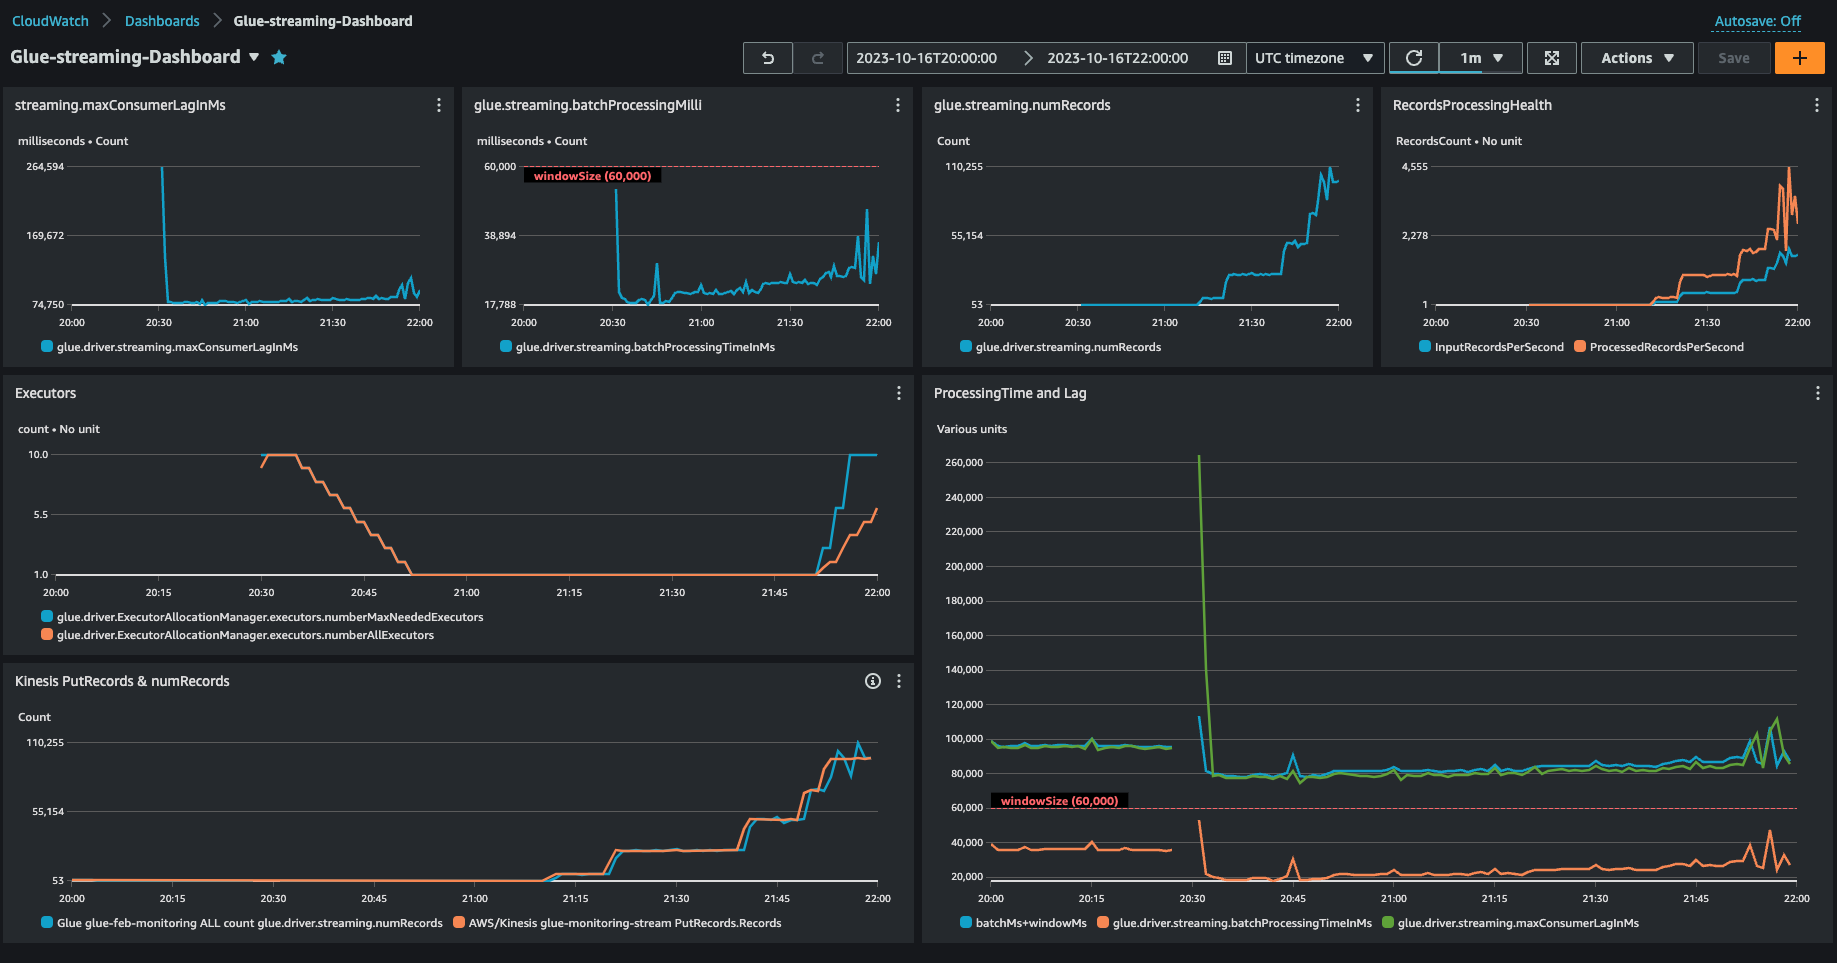
Once you have your metrics selected, create a dashboard and add it. Here is a sample dashboard.
