Debugging OOM exceptions and job abnormalities
You can debug out-of-memory (OOM) exceptions and job abnormalities in Amazon Glue. The following sections describe scenarios for debugging out-of-memory exceptions of the Apache Spark driver or a Spark executor.
Debugging a driver OOM exception
In this scenario, a Spark job is reading a large number of small files from Amazon Simple Storage Service (Amazon S3). It converts the files to Apache Parquet format and then writes them out to Amazon S3. The Spark driver is running out of memory. The input Amazon S3 data has more than 1 million files in different Amazon S3 partitions.
The profiled code is as follows:
data = spark.read.format("json").option("inferSchema", False).load("s3://input_path")
data.write.format("parquet").save(output_path)
Visualize the profiled metrics on the Amazon Glue console
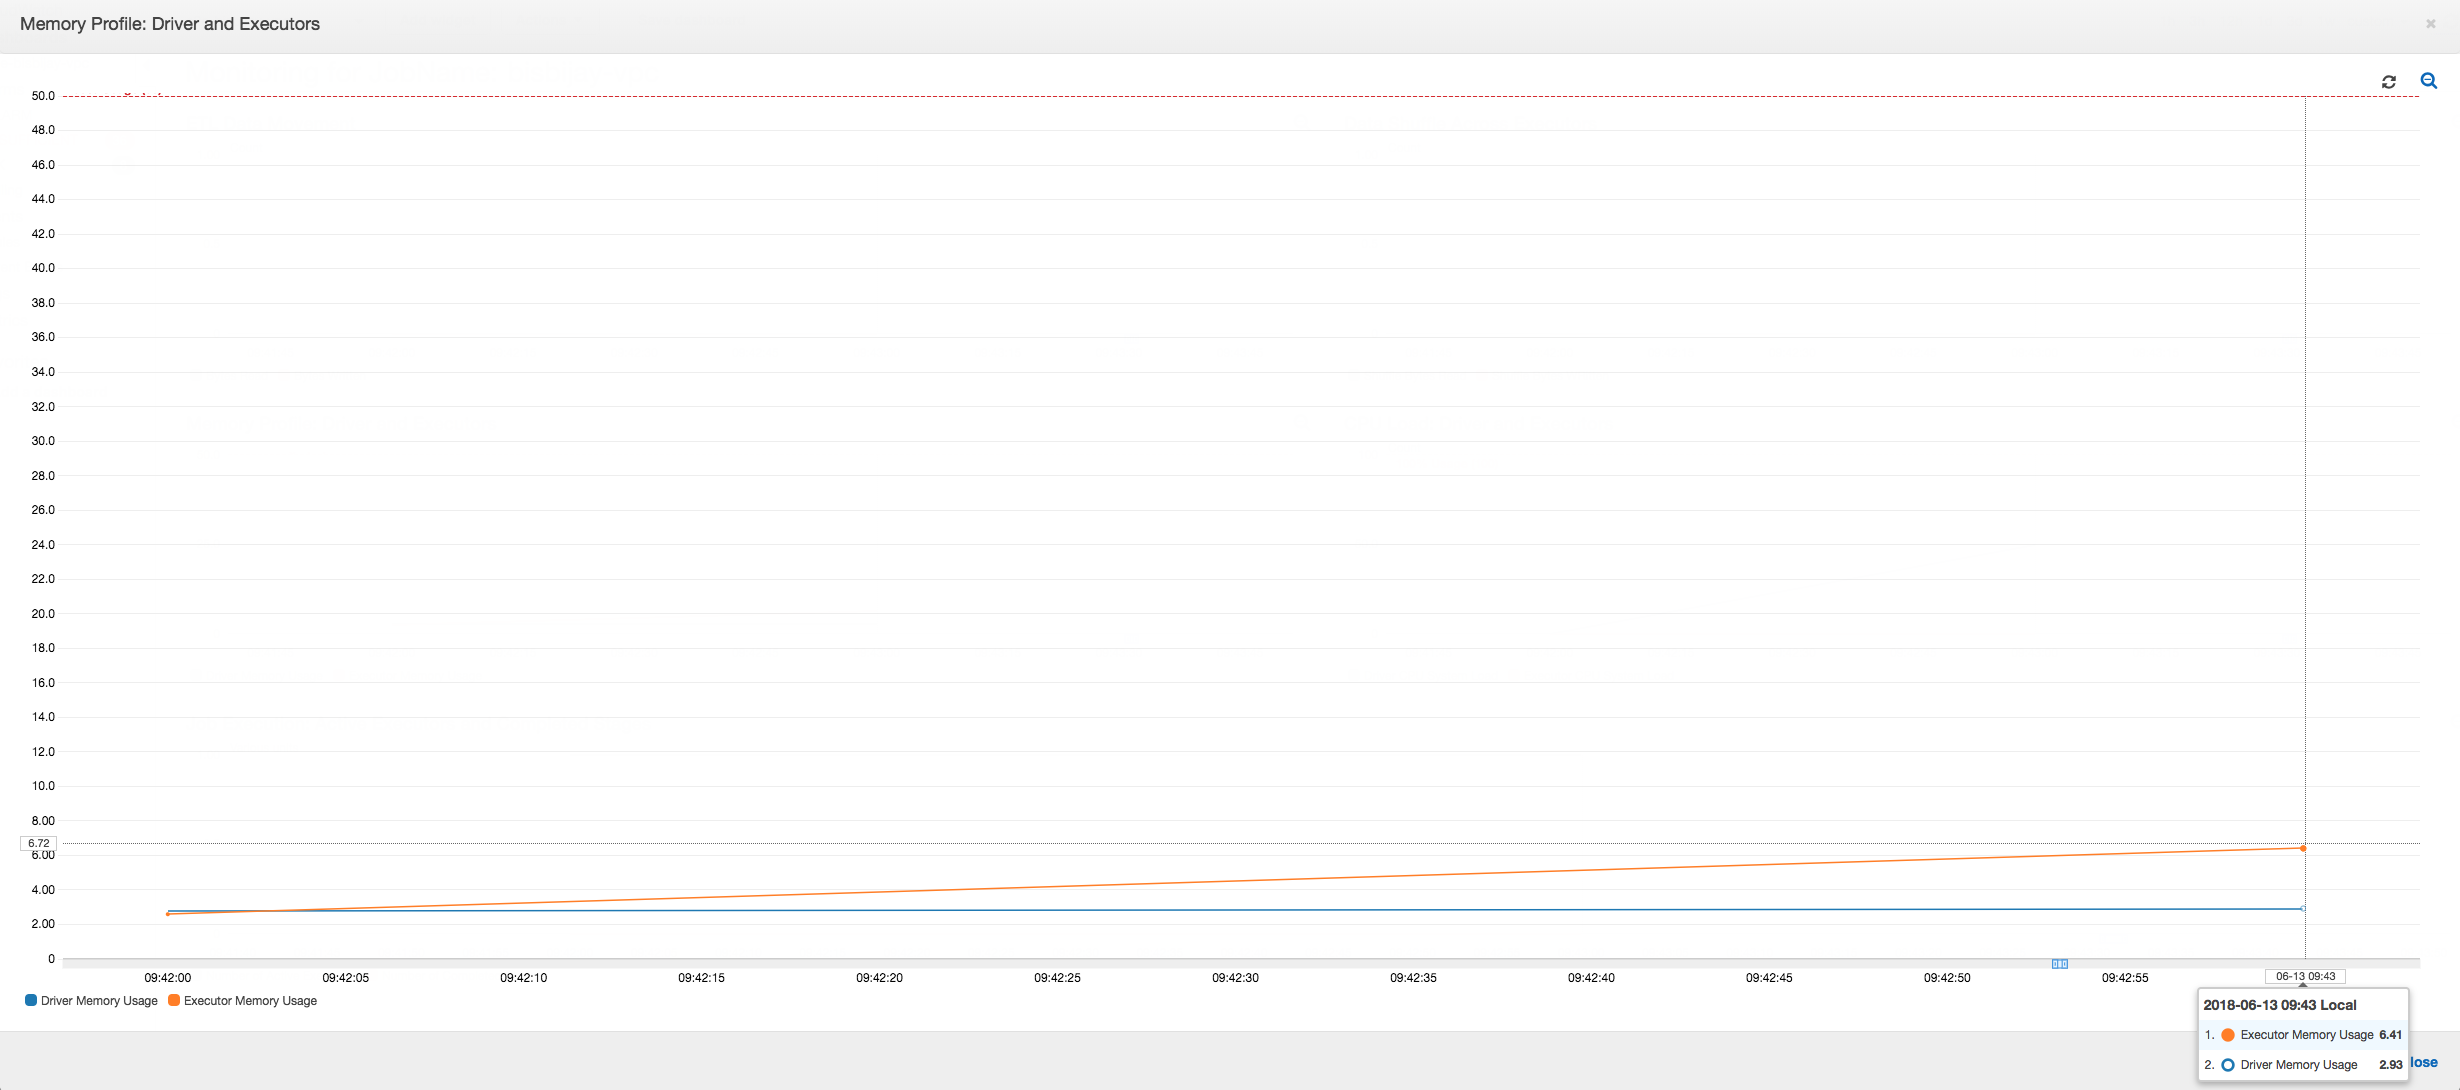
The following graph shows the memory usage as a percentage for the driver and executors. This usage is plotted as one data point that is averaged over the values reported in the last minute. You can see in the memory profile of the job that the driver memory crosses the safe threshold of 50 percent usage quickly. On the other hand, the average memory usage across all executors is still less than 4 percent. This clearly shows abnormality with driver execution in this Spark job.
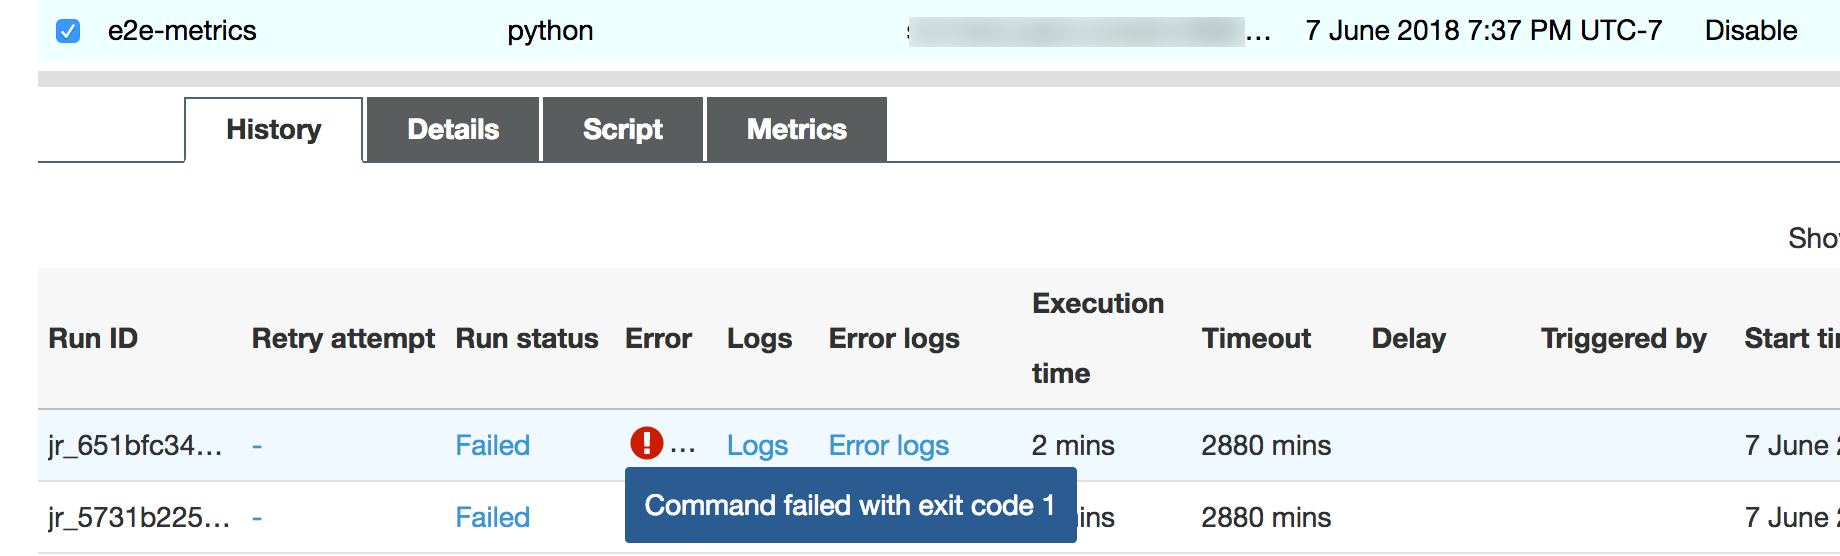
The job run soon fails, and the following error appears in the
History tab on the Amazon Glue console: Command Failed with Exit
Code 1. This error string means that the job failed due to a systemic
error—which in this case is the driver running out of memory.
On the console, choose the Error logs link on the
History tab to confirm the finding about driver OOM from the CloudWatch Logs.
Search for "Error" in the job's error logs to confirm that it was
indeed an OOM exception that failed the job:
# java.lang.OutOfMemoryError: Java heap space
# -XX:OnOutOfMemoryError="kill -9 %p"
# Executing /bin/sh -c "kill -9 12039"...
On the History tab for the job, choose Logs. You can find the following trace of driver execution in the CloudWatch Logs at the
beginning of the job. The Spark driver tries to list all the files in all the directories,
constructs an InMemoryFileIndex, and launches one task per file. This in turn
results in the Spark driver having to maintain a large amount of state in memory to track
all the tasks. It caches the complete list of a large number of files for the in-memory
index, resulting in a driver OOM.
Fix the processing of multiple files using grouping
You can fix the processing of the multiple files by using the grouping feature in Amazon Glue. Grouping is automatically enabled when you use dynamic frames and when the input dataset has a large number of files (more than 50,000). Grouping allows you to coalesce multiple files together into a group, and it allows a task to process the entire group instead of a single file. As a result, the Spark driver stores significantly less state in memory to track fewer tasks. For more information about manually enabling grouping for your dataset, see Reading input files in larger groups.
To check the memory profile of the Amazon Glue job, profile the following code with grouping enabled:
df = glueContext.create_dynamic_frame_from_options("s3", {'paths': ["s3://input_path"], "recurse":True, 'groupFiles': 'inPartition'}, format="json")
datasink = glueContext.write_dynamic_frame.from_options(frame = df, connection_type = "s3", connection_options = {"path": output_path}, format = "parquet", transformation_ctx = "datasink")
You can monitor the memory profile and the ETL data movement in the Amazon Glue job profile.
The driver runs below the threshold of 50 percent memory usage over the entire duration of the Amazon Glue job. The executors stream the data from Amazon S3, process it, and write it out to Amazon S3. As a result, they consume less than 5 percent memory at any point in time.

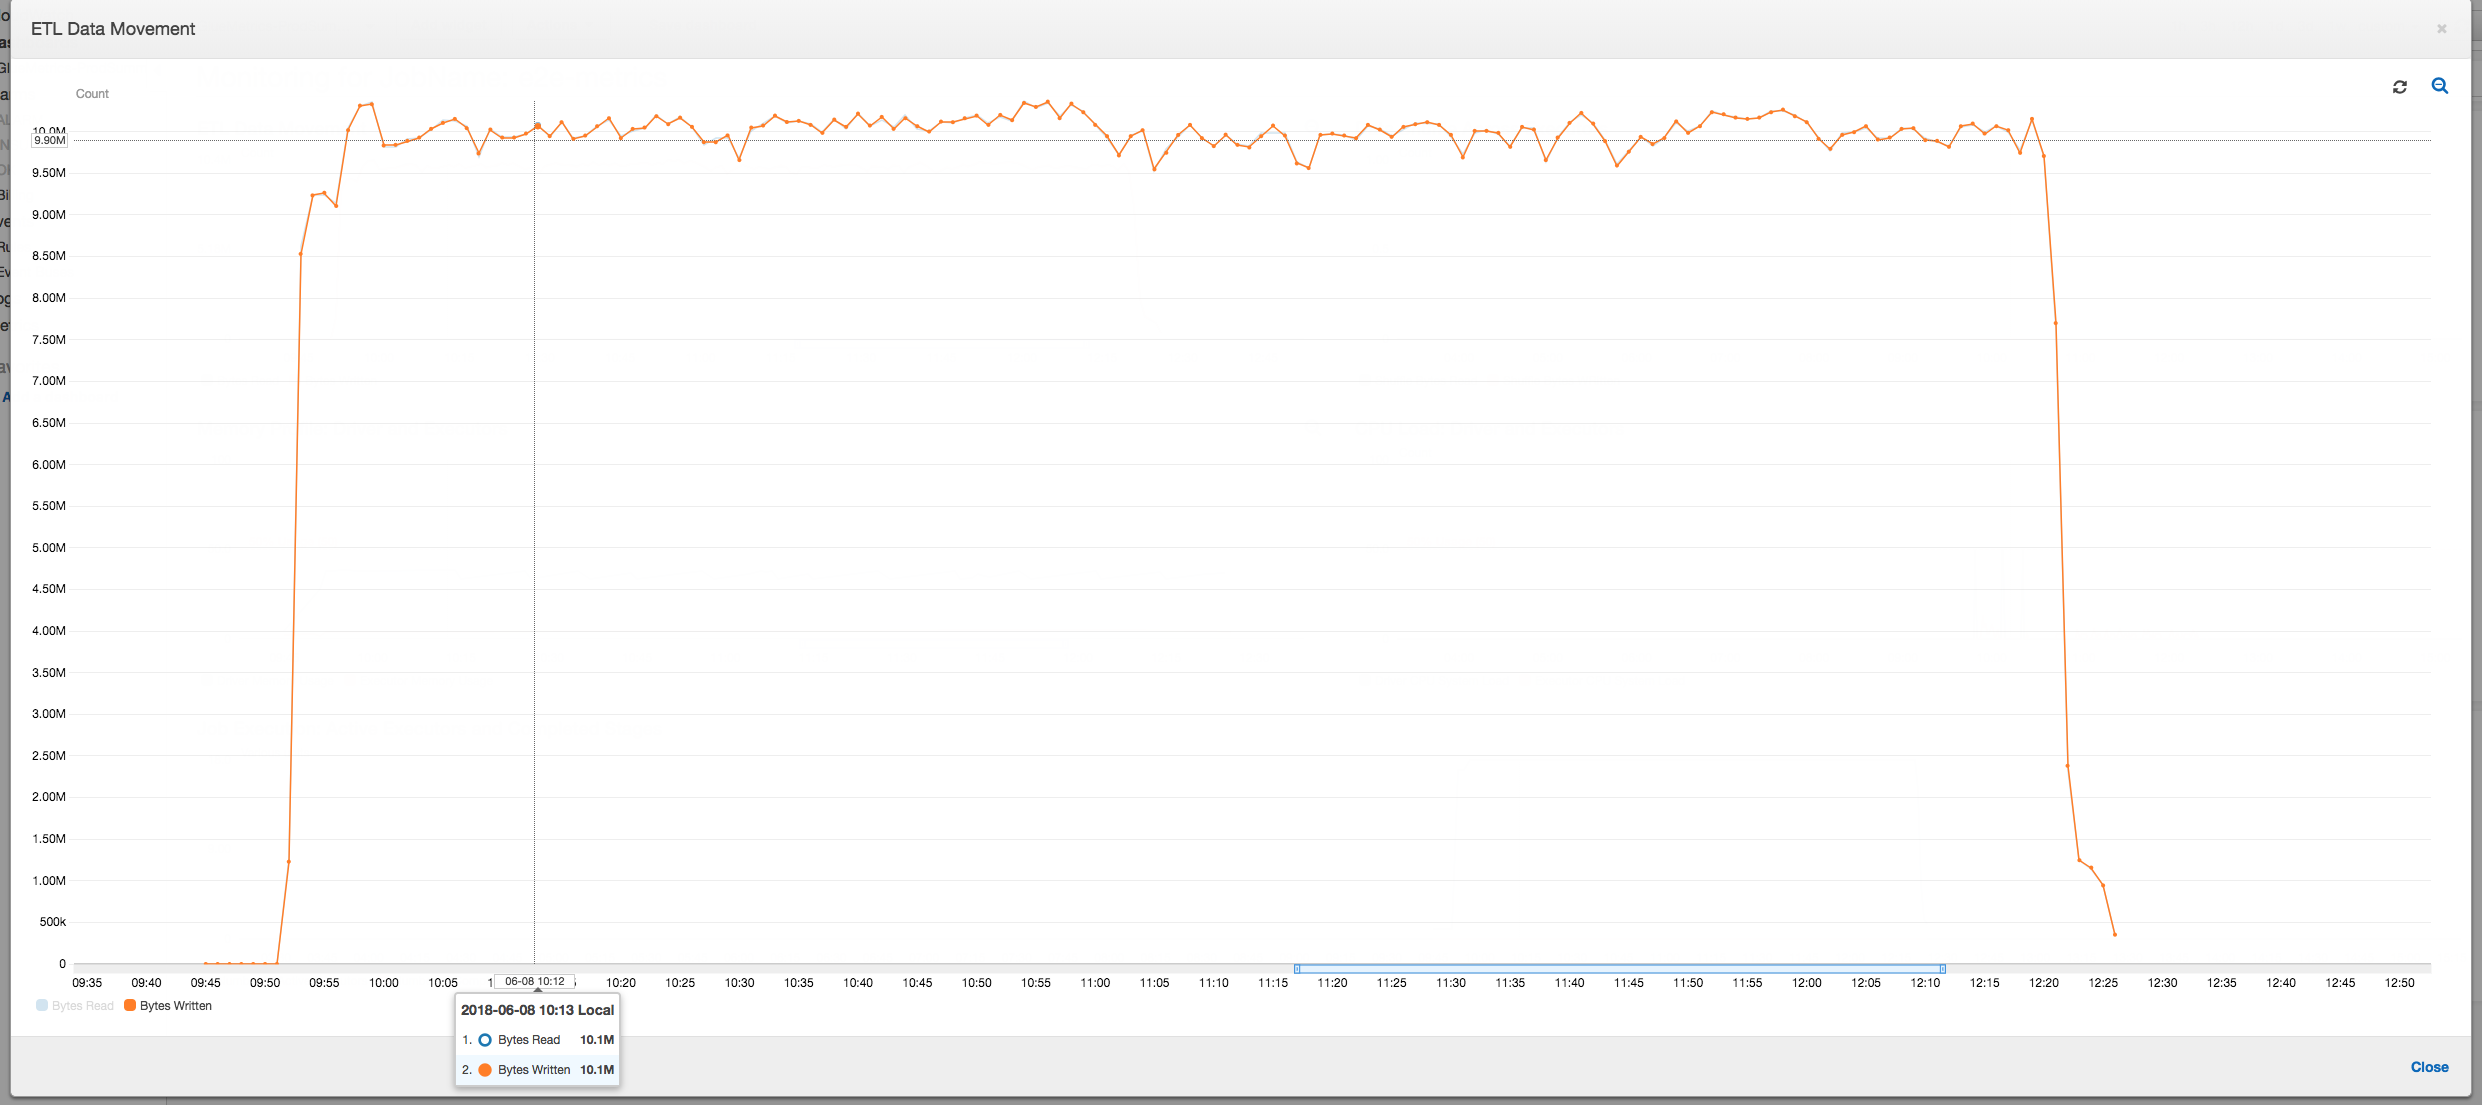
The data movement profile below shows the total number of Amazon S3 bytes that are read and written in the last minute by all executors as the job progresses. Both follow a similar pattern as the data is streamed across all the executors. The job finishes processing all one million files in less than three hours.
Debugging an executor OOM exception
In this scenario, you can learn how to debug OOM exceptions that could occur in Apache Spark executors. The following code uses the Spark MySQL reader to read a large table of about 34 million rows into a Spark dataframe. It then writes it out to Amazon S3 in Parquet format. You can provide the connection properties and use the default Spark configurations to read the table.
val connectionProperties = new Properties()
connectionProperties.put("user", user)
connectionProperties.put("password", password)
connectionProperties.put("Driver", "com.mysql.jdbc.Driver")
val sparkSession = glueContext.sparkSession
val dfSpark = sparkSession.read.jdbc(url, tableName, connectionProperties)
dfSpark.write.format("parquet").save(output_path)
Visualize the profiled metrics on the Amazon Glue console
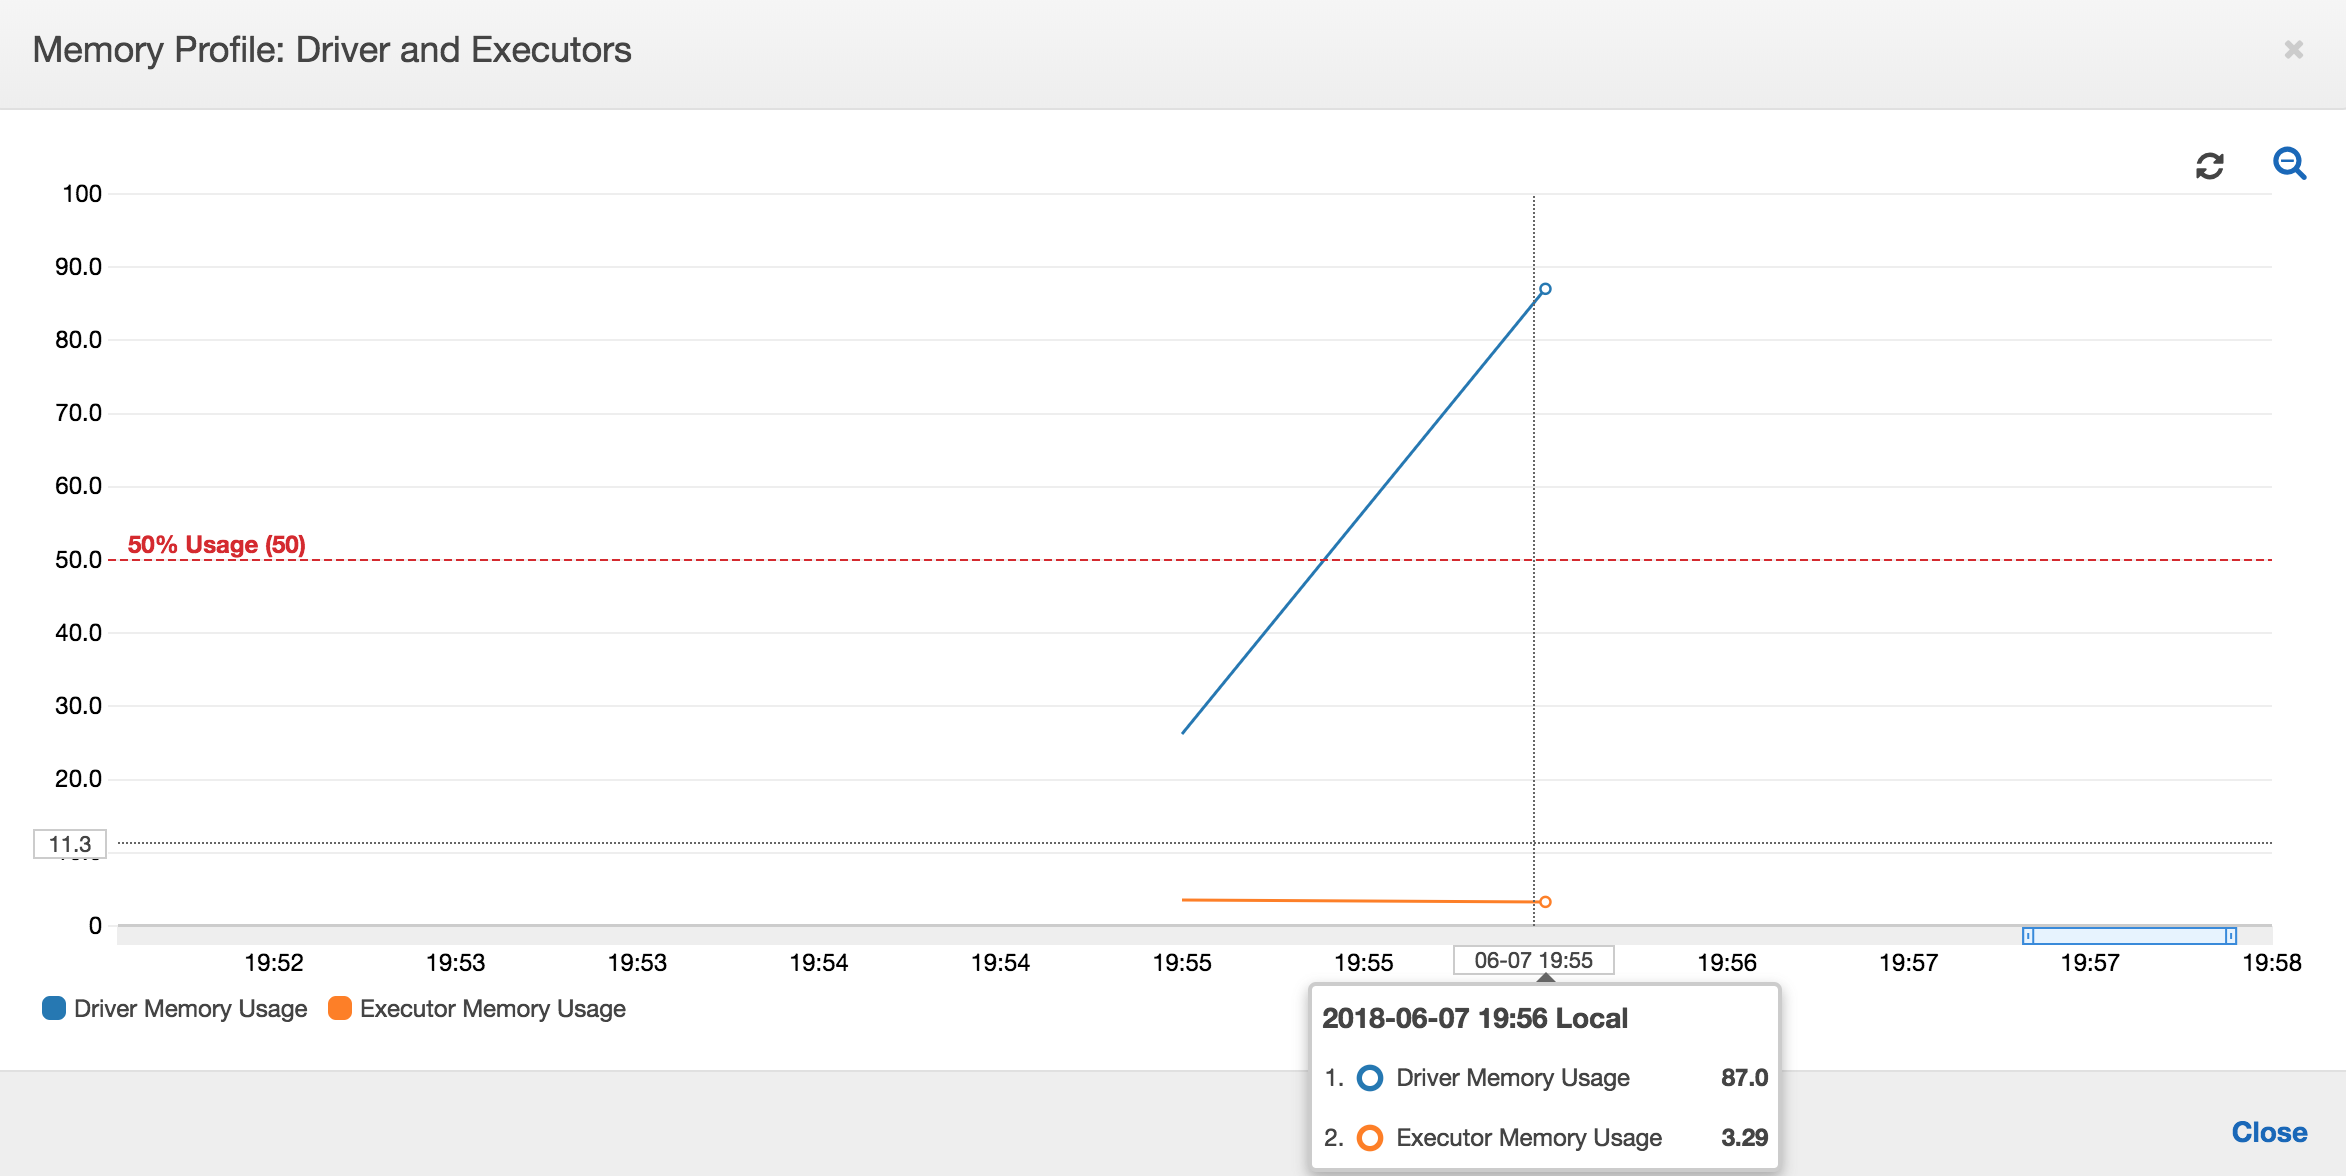
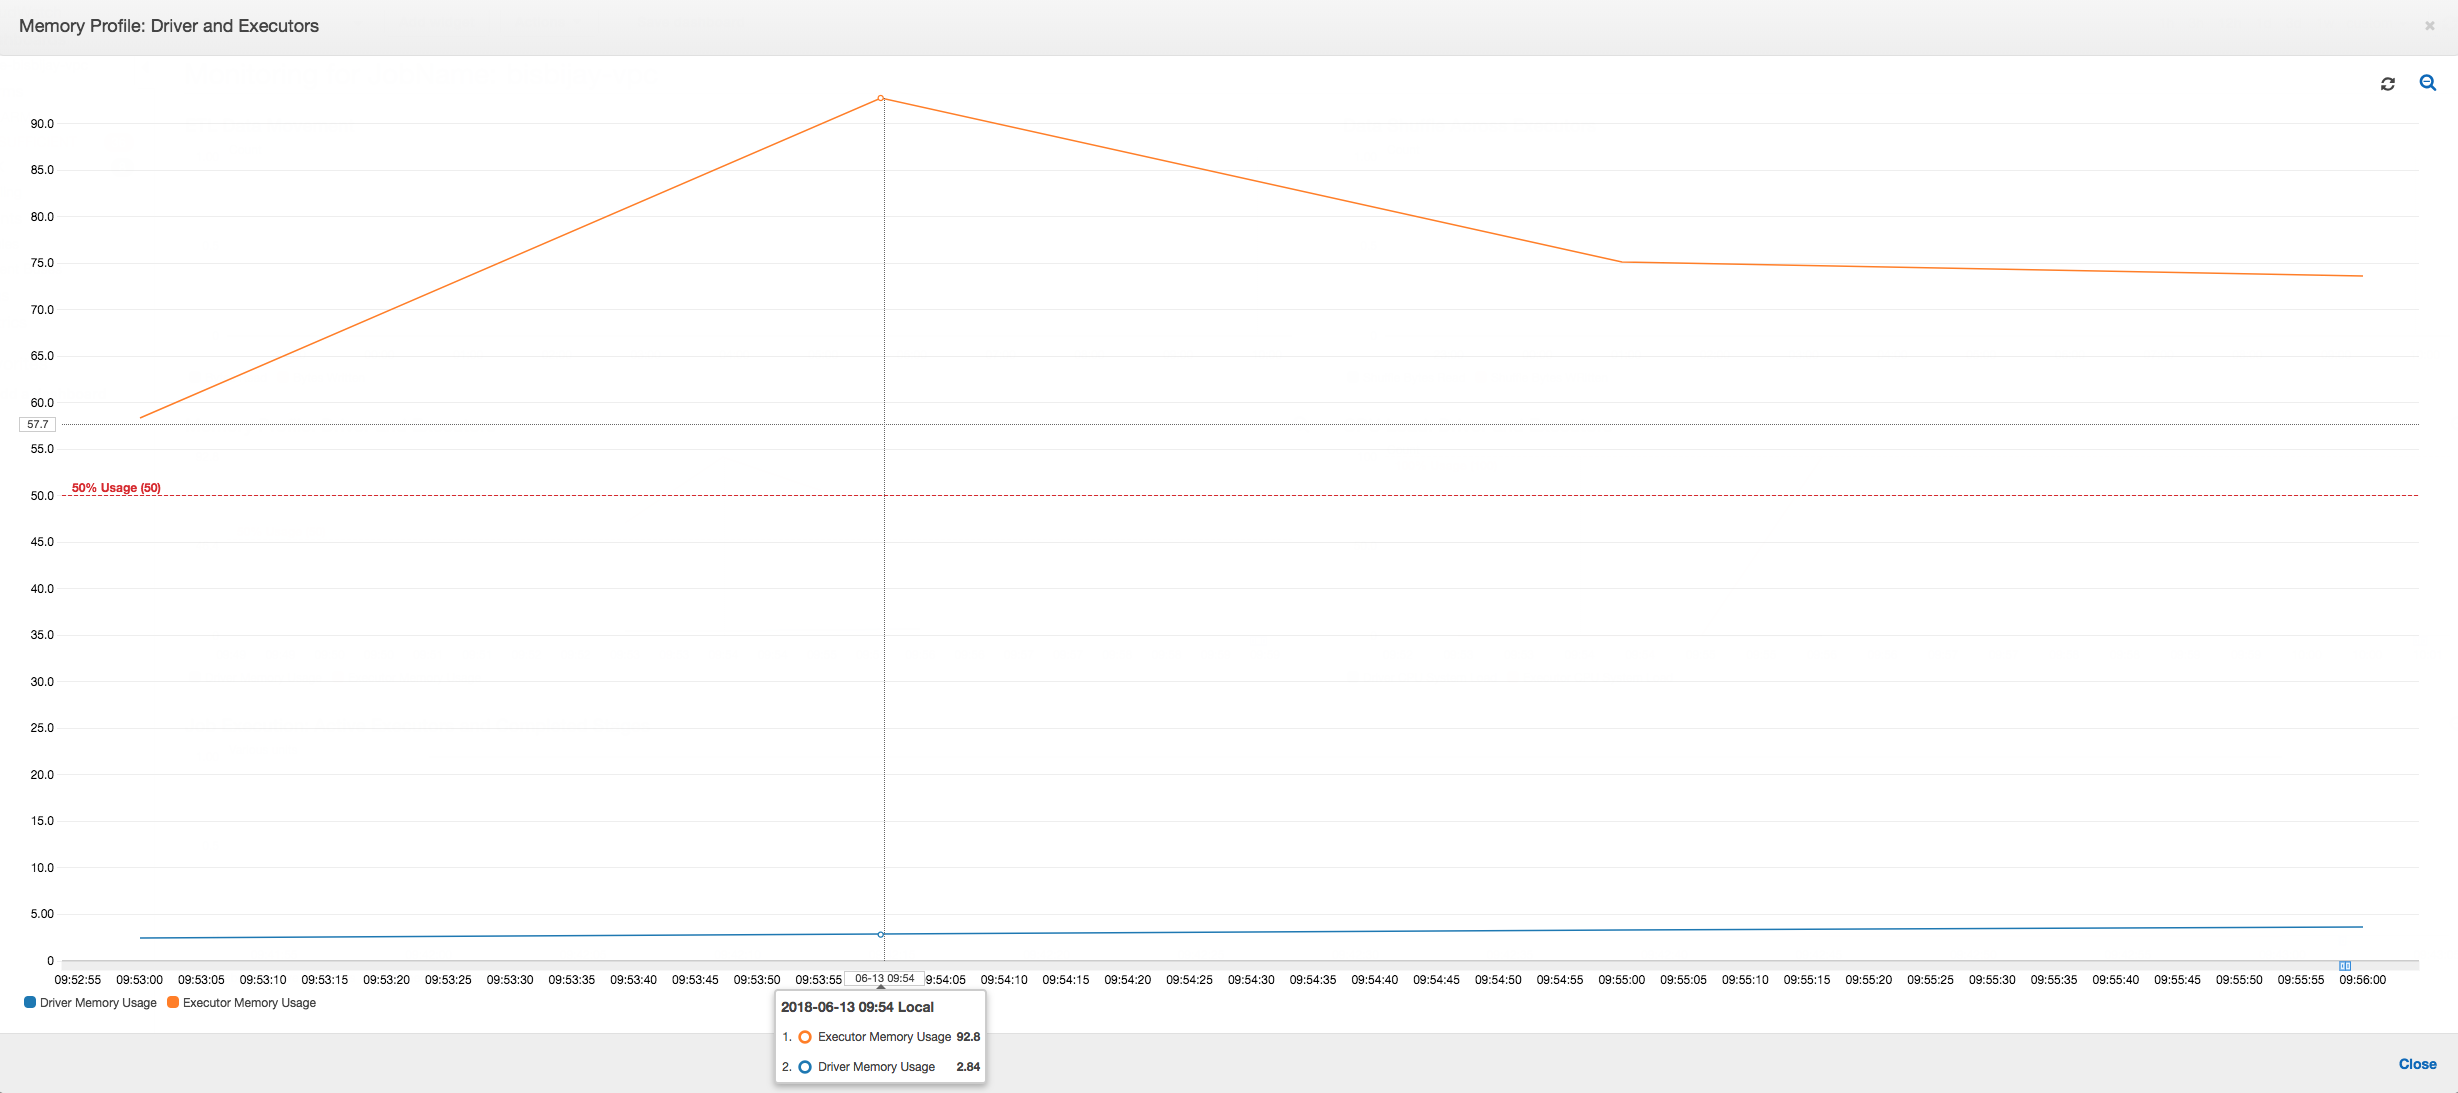
If the slope of the memory usage graph is positive and crosses 50 percent, then if the job fails before the next metric is emitted, then memory exhaustion is a good candidate for the cause. The following graph shows that within a minute of execution, the average memory usage across all executors spikes up quickly above 50 percent. The usage reaches up to 92 percent and the container running the executor is stopped by Apache Hadoop YARN.
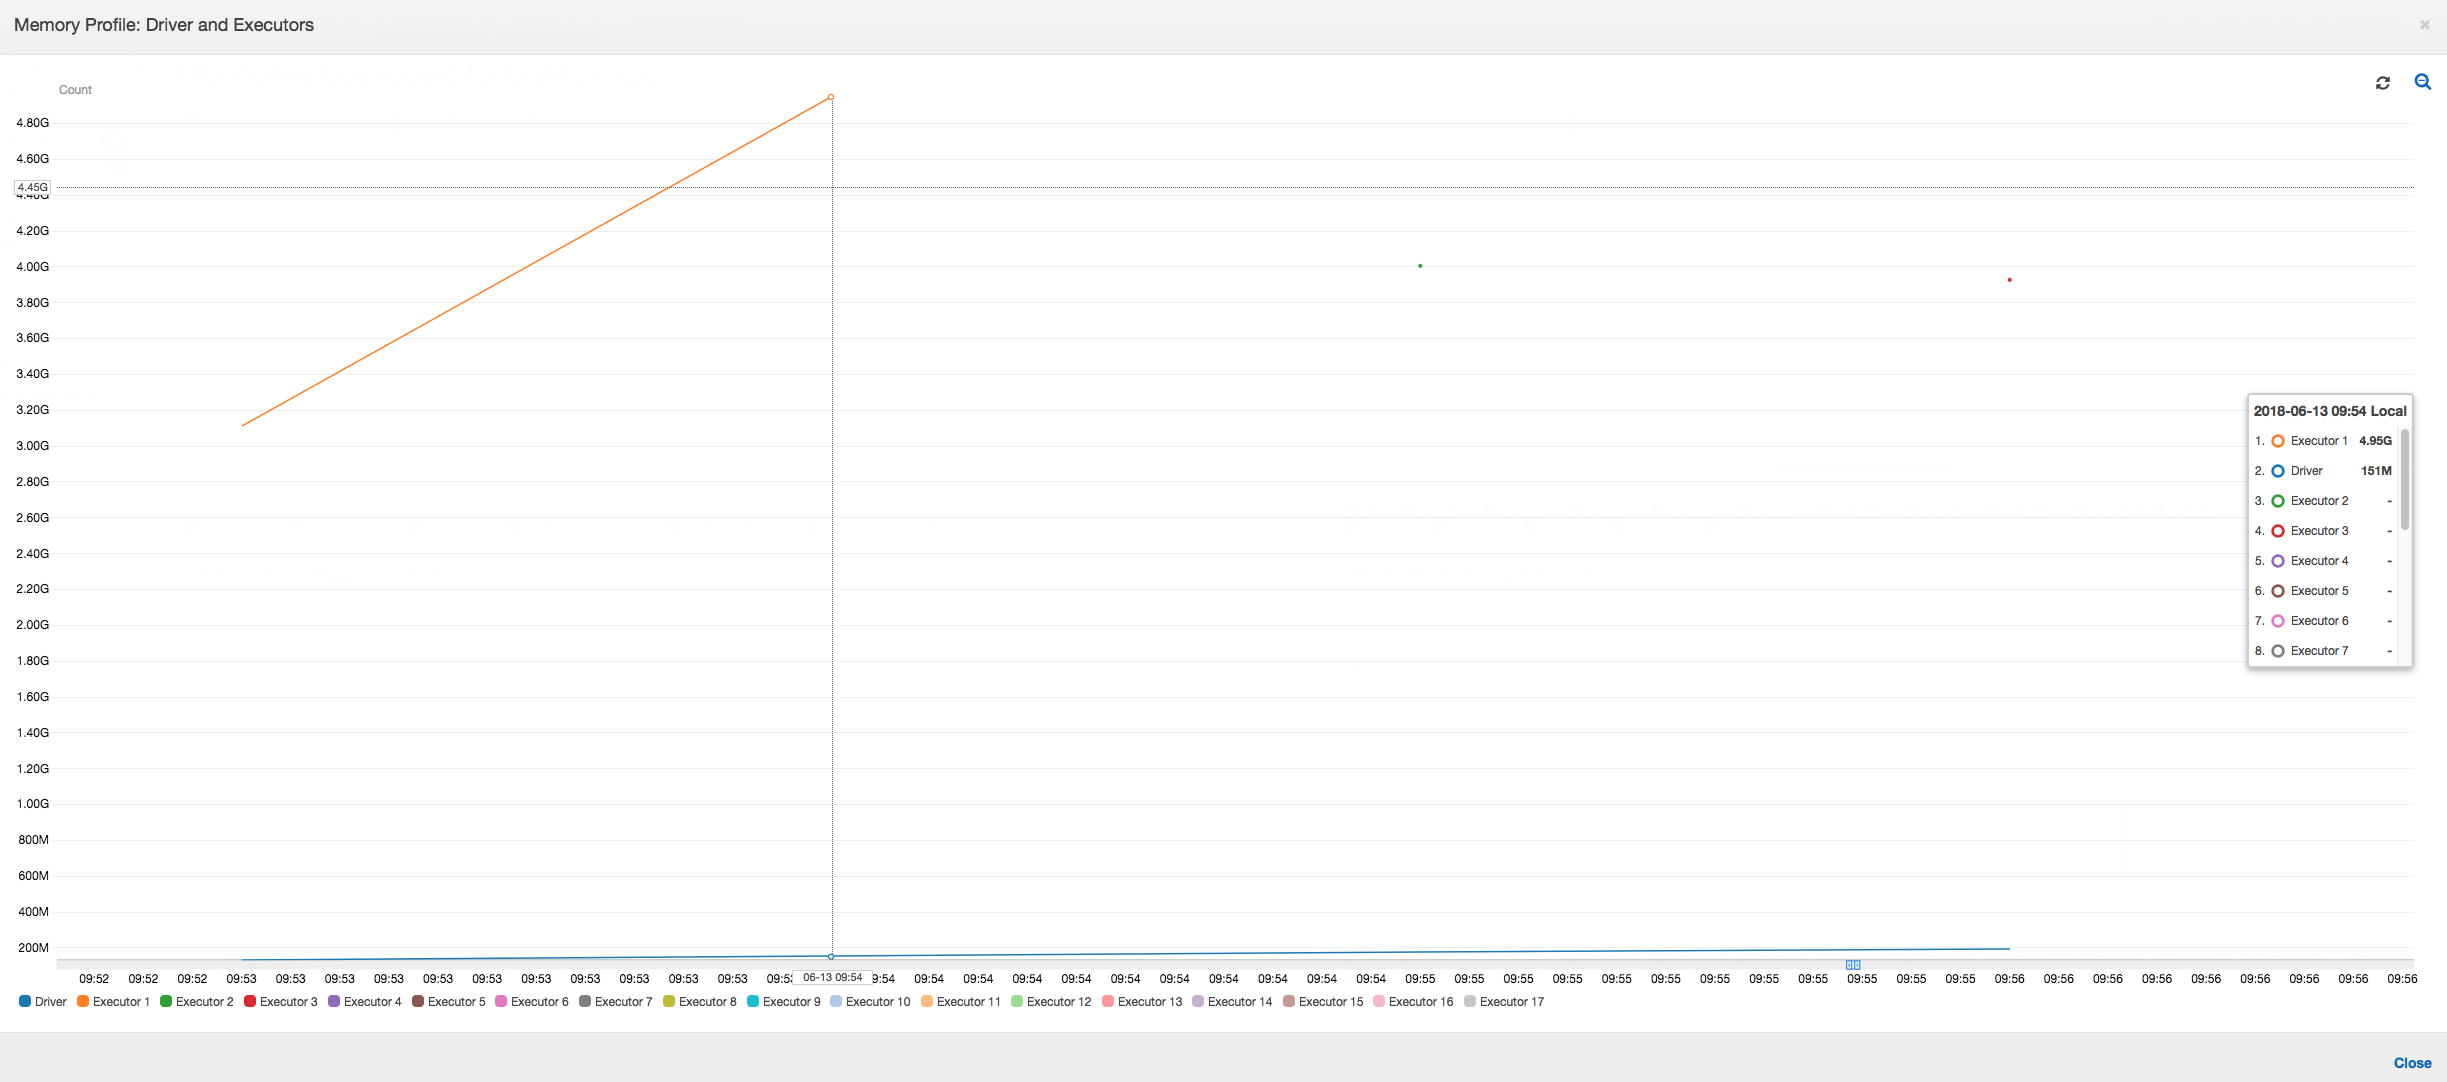
As the following graph shows, there is always a single executor running until the job fails. This is because a new executor is launched to replace the stopped executor. The JDBC data source reads are not parallelized by default because it would require partitioning the table on a column and opening multiple connections. As a result, only one executor reads in the complete table sequentially.

As the following graph shows, Spark tries to launch a new task four times before failing the job. You can see the memory profile of three executors. Each executor quickly uses up all of its memory. The fourth executor runs out of memory, and the job fails. As a result, its metric is not reported immediately.
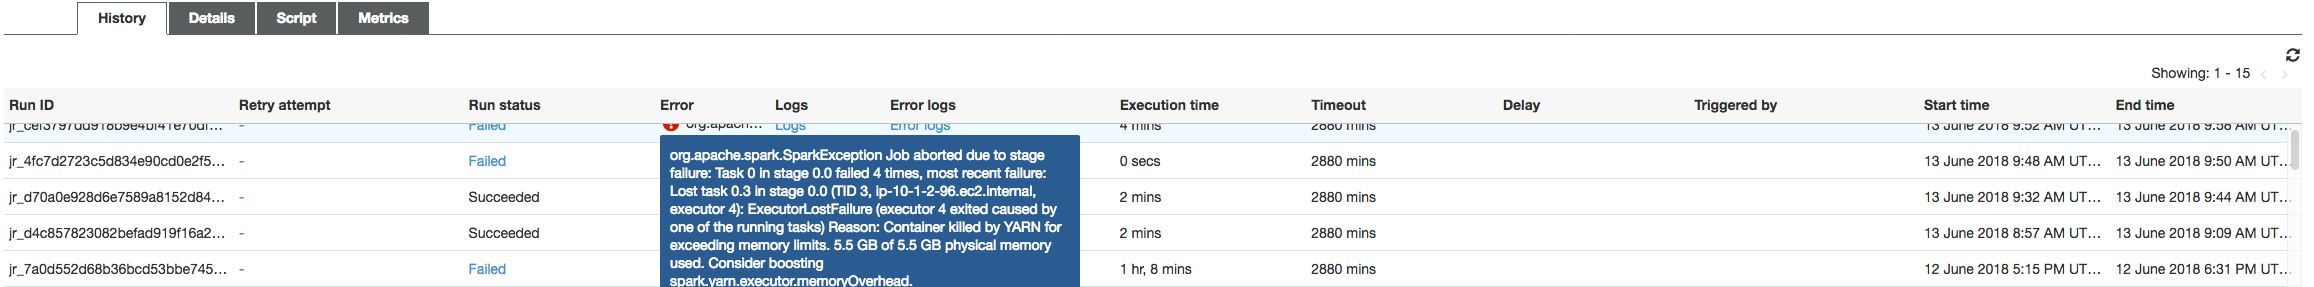
You can confirm from the error string on the Amazon Glue console that the job failed due to OOM exceptions, as shown in the following image.
Job output logs: To further confirm your finding of an
executor OOM exception, look at the CloudWatch Logs. When you search for Error,
you find the four executors being stopped in roughly the same time windows as shown on the
metrics dashboard. All are terminated by YARN as they exceed their memory limits.
Executor 1
18/06/13 16:54:29 WARN YarnAllocator: Container killed by YARN for exceeding memory limits. 5.5 GB of 5.5 GB physical memory used. Consider boosting spark.yarn.executor.memoryOverhead.
18/06/13 16:54:29 WARN YarnSchedulerBackend$YarnSchedulerEndpoint: Container killed by YARN for exceeding memory limits. 5.5 GB of 5.5 GB physical memory used. Consider boosting spark.yarn.executor.memoryOverhead.
18/06/13 16:54:29 ERROR YarnClusterScheduler: Lost executor 1 on ip-10-1-2-175.ec2.internal: Container killed by YARN for exceeding memory limits. 5.5 GB of 5.5 GB physical memory used. Consider boosting spark.yarn.executor.memoryOverhead.
18/06/13 16:54:29 WARN TaskSetManager: Lost task 0.0 in stage 0.0 (TID 0, ip-10-1-2-175.ec2.internal, executor 1): ExecutorLostFailure (executor 1 exited caused by one of the running tasks) Reason: Container killed by YARN for exceeding memory limits. 5.5 GB of 5.5 GB physical memory used. Consider boosting spark.yarn.executor.memoryOverhead.
Executor 2
18/06/13 16:55:35 WARN YarnAllocator: Container killed by YARN for exceeding memory limits. 5.8 GB of 5.5 GB physical memory used. Consider boosting spark.yarn.executor.memoryOverhead.
18/06/13 16:55:35 WARN YarnSchedulerBackend$YarnSchedulerEndpoint: Container killed by YARN for exceeding memory limits. 5.8 GB of 5.5 GB physical memory used. Consider boosting spark.yarn.executor.memoryOverhead.
18/06/13 16:55:35 ERROR YarnClusterScheduler: Lost executor 2 on ip-10-1-2-16.ec2.internal: Container killed by YARN for exceeding memory limits. 5.8 GB of 5.5 GB physical memory used. Consider boosting spark.yarn.executor.memoryOverhead.
18/06/13 16:55:35 WARN TaskSetManager: Lost task 0.1 in stage 0.0 (TID 1, ip-10-1-2-16.ec2.internal, executor 2): ExecutorLostFailure (executor 2 exited caused by one of the running tasks) Reason: Container killed by YARN for exceeding memory limits. 5.8 GB of 5.5 GB physical memory used. Consider boosting spark.yarn.executor.memoryOverhead.
Executor 3
18/06/13 16:56:37 WARN YarnAllocator: Container killed by YARN for exceeding memory limits. 5.8 GB of 5.5 GB physical memory used. Consider boosting spark.yarn.executor.memoryOverhead.
18/06/13 16:56:37 WARN YarnSchedulerBackend$YarnSchedulerEndpoint: Container killed by YARN for exceeding memory limits. 5.8 GB of 5.5 GB physical memory used. Consider boosting spark.yarn.executor.memoryOverhead.
18/06/13 16:56:37 ERROR YarnClusterScheduler: Lost executor 3 on ip-10-1-2-189.ec2.internal: Container killed by YARN for exceeding memory limits. 5.8 GB of 5.5 GB physical memory used. Consider boosting spark.yarn.executor.memoryOverhead.
18/06/13 16:56:37 WARN TaskSetManager: Lost task 0.2 in stage 0.0 (TID 2, ip-10-1-2-189.ec2.internal, executor 3): ExecutorLostFailure (executor 3 exited caused by one of the running tasks) Reason: Container killed by YARN for exceeding memory limits. 5.8 GB of 5.5 GB physical memory used. Consider boosting spark.yarn.executor.memoryOverhead.
Executor 4
18/06/13 16:57:18 WARN YarnAllocator: Container killed by YARN for exceeding memory limits. 5.5 GB of 5.5 GB physical memory used. Consider boosting spark.yarn.executor.memoryOverhead.
18/06/13 16:57:18 WARN YarnSchedulerBackend$YarnSchedulerEndpoint: Container killed by YARN for exceeding memory limits. 5.5 GB of 5.5 GB physical memory used. Consider boosting spark.yarn.executor.memoryOverhead.
18/06/13 16:57:18 ERROR YarnClusterScheduler: Lost executor 4 on ip-10-1-2-96.ec2.internal: Container killed by YARN for exceeding memory limits. 5.5 GB of 5.5 GB physical memory used. Consider boosting spark.yarn.executor.memoryOverhead.
18/06/13 16:57:18 WARN TaskSetManager: Lost task 0.3 in stage 0.0 (TID 3, ip-10-1-2-96.ec2.internal, executor 4): ExecutorLostFailure (executor 4 exited caused by one of the running tasks) Reason: Container killed by YARN for exceeding memory limits. 5.5 GB of 5.5 GB physical memory used. Consider boosting spark.yarn.executor.memoryOverhead.
Fix the fetch size setting using Amazon Glue dynamic frames
The executor ran out of memory while reading the JDBC table because the default configuration for the Spark JDBC fetch size is zero. This means that the JDBC driver on the Spark executor tries to fetch the 34 million rows from the database together and cache them, even though Spark streams through the rows one at a time. With Spark, you can avoid this scenario by setting the fetch size parameter to a non-zero default value.
You can also fix this issue by using Amazon Glue dynamic frames instead. By default, dynamic frames
use a fetch size of 1,000 rows that is a typically sufficient value. As a result, the executor does not take more than 7 percent
of its total memory. The Amazon Glue job finishes in less than two minutes with only a single
executor. While using Amazon Glue dynamic frames is the recommended approach, it is also possible to set the fetch size using the Apache Spark fetchsize property. See the Spark SQL, DataFrames and Datasets Guide
val (url, database, tableName) = {
 ("jdbc_url", "db_name", "table_name")
 }
val source = glueContext.getSource(format, sourceJson)
val df = source.getDynamicFrame
glueContext.write_dynamic_frame.from_options(frame = df, connection_type = "s3", connection_options = {"path": output_path}, format = "parquet", transformation_ctx = "datasink")
Normal profiled metrics: The executor memory with Amazon Glue dynamic frames never exceeds the safe threshold, as shown in the following image. It streams in the rows from the database and caches only 1,000 rows in the JDBC driver at any point in time. An out of memory exception does not occur.