Debugging demanding stages and straggler tasks
You can use Amazon Glue job profiling to identify demanding stages and straggler tasks in your extract, transform, and load (ETL) jobs. A straggler task takes much longer than the rest of the tasks in a stage of an Amazon Glue job. As a result, the stage takes longer to complete, which also delays the total execution time of the job.
Coalescing small input files into larger output files
A straggler task can occur when there is a non-uniform distribution of work across the different tasks, or a data skew results in one task processing more data.
You can profile the following code—a common pattern in Apache Spark—to coalesce a large number of small files into larger output files. For this example, the input dataset is 32 GB of JSON Gzip compressed files. The output dataset has roughly 190 GB of uncompressed JSON files.
The profiled code is as follows:
datasource0 = spark.read.format("json").load("s3://input_path")
df = datasource0.coalesce(1)
df.write.format("json").save(output_path)
Visualize the profiled metrics on the Amazon Glue console
You can profile your job to examine four different sets of metrics:
-
ETL data movement
-
Data shuffle across executors
-
Job execution
-
Memory profile
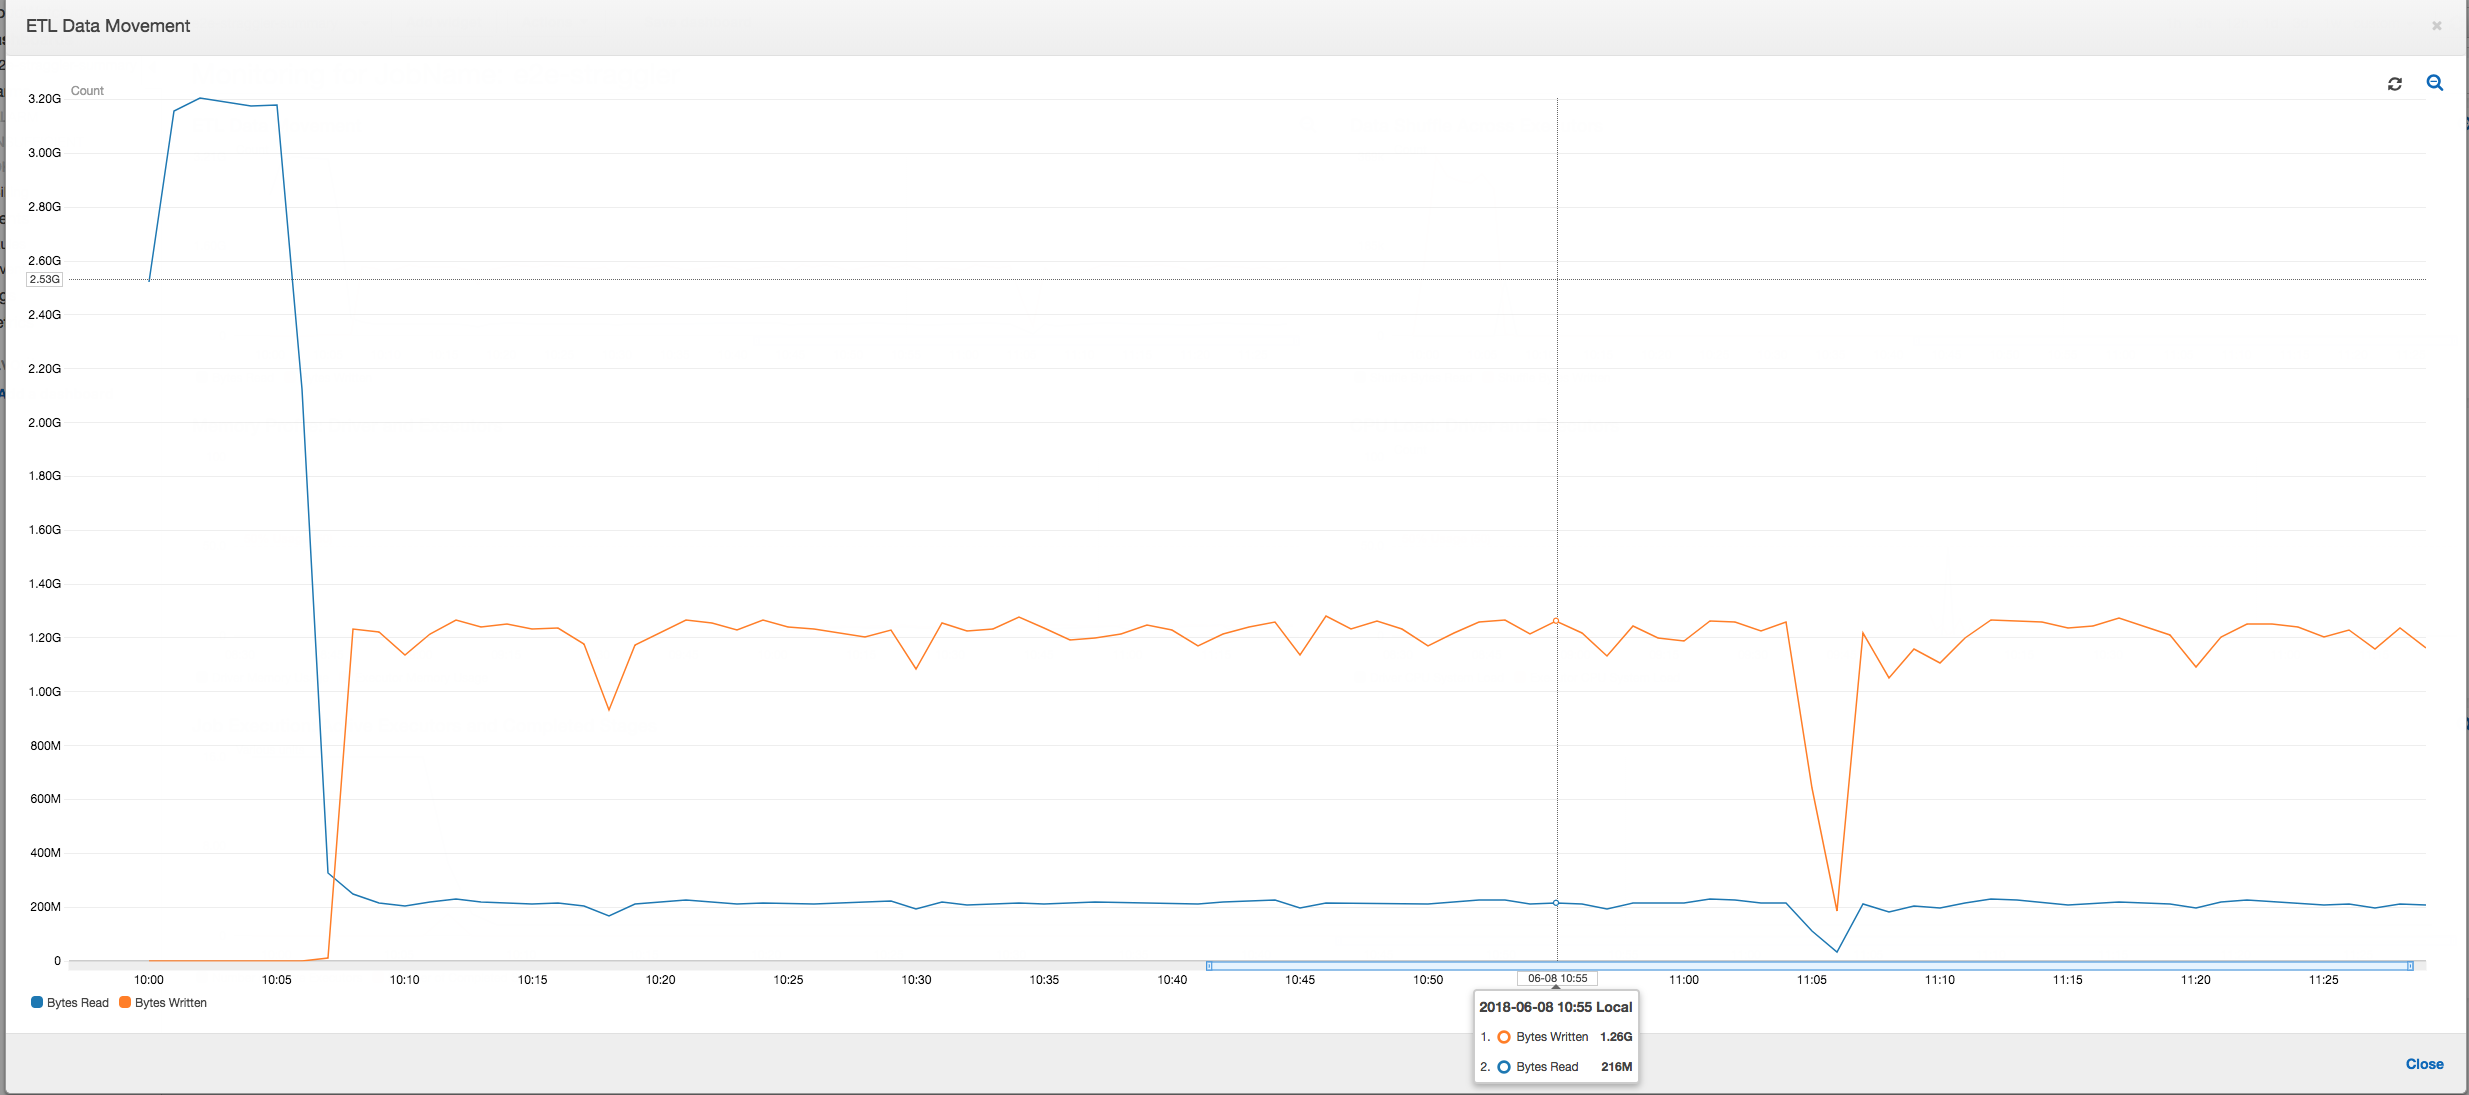
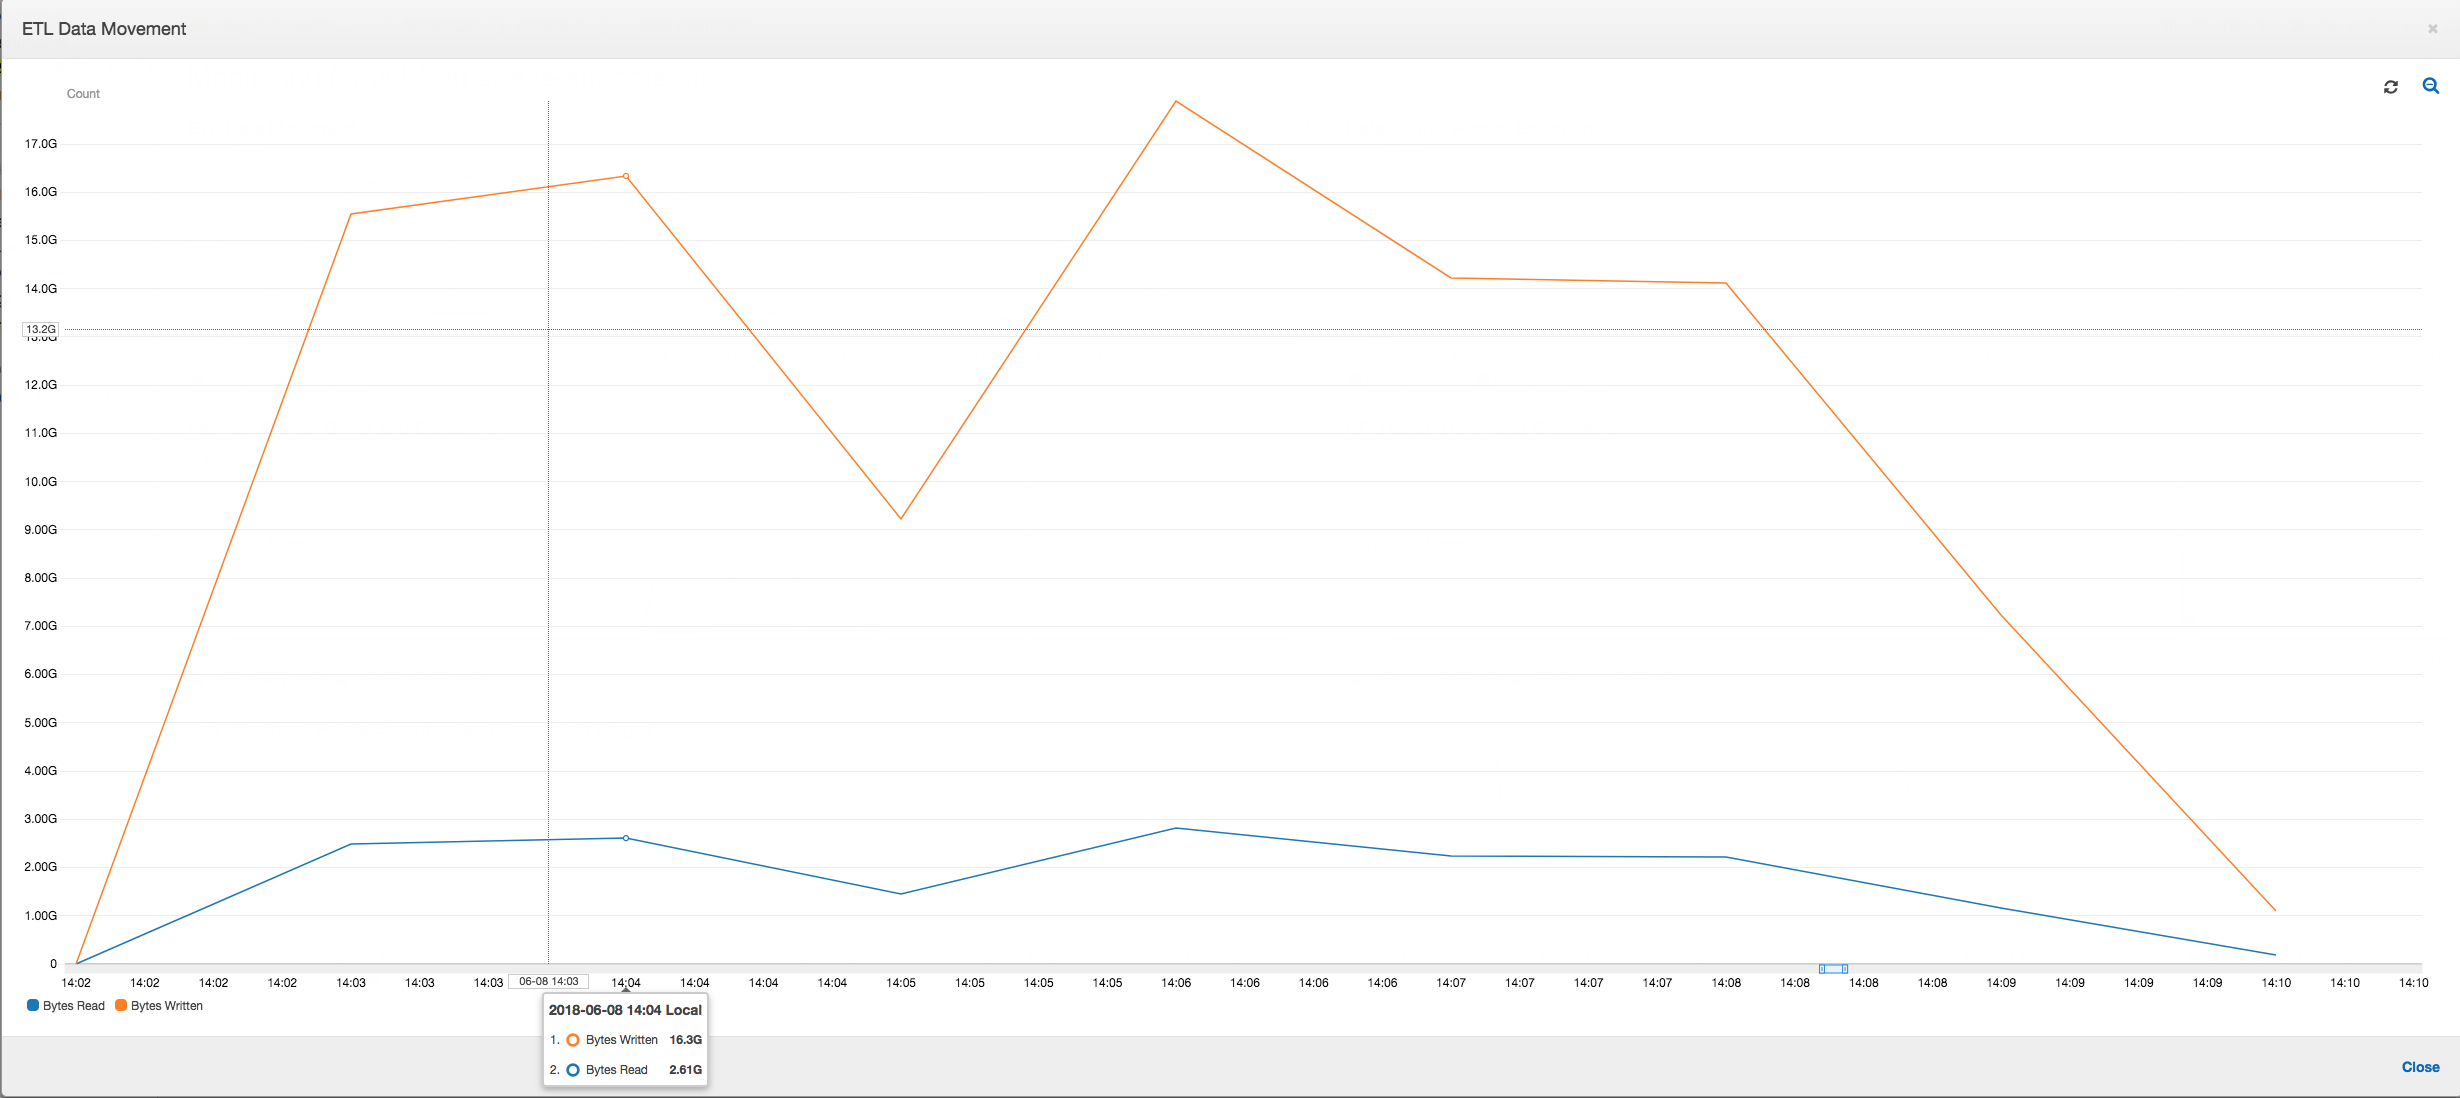
ETL data movement: In the ETL Data Movement profile, the bytes are read fairly quickly by all the executors in the first stage that completes within the first six minutes. However, the total job execution time is around one hour, mostly consisting of the data writes.
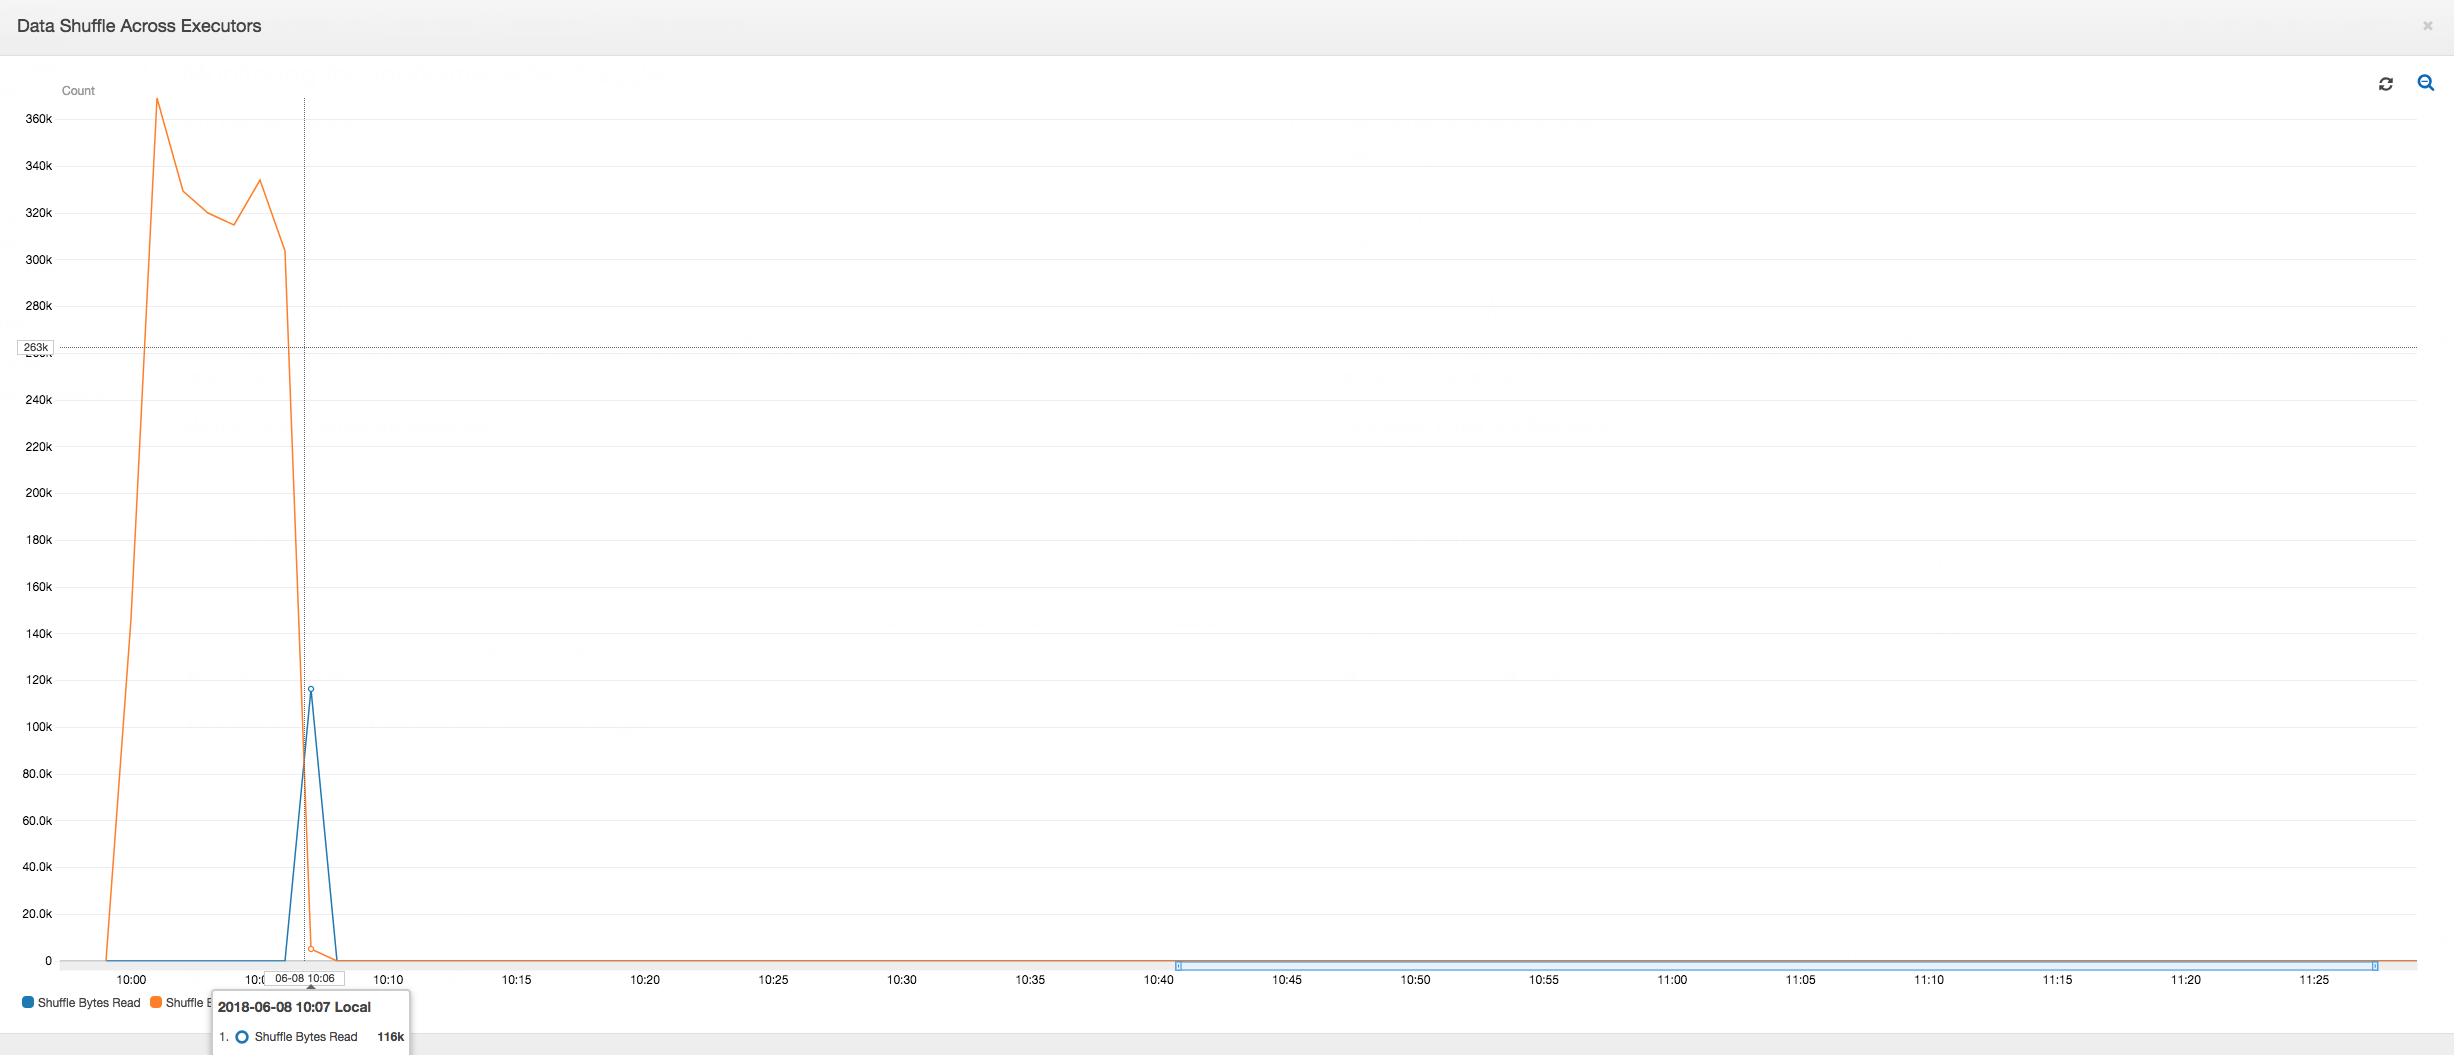
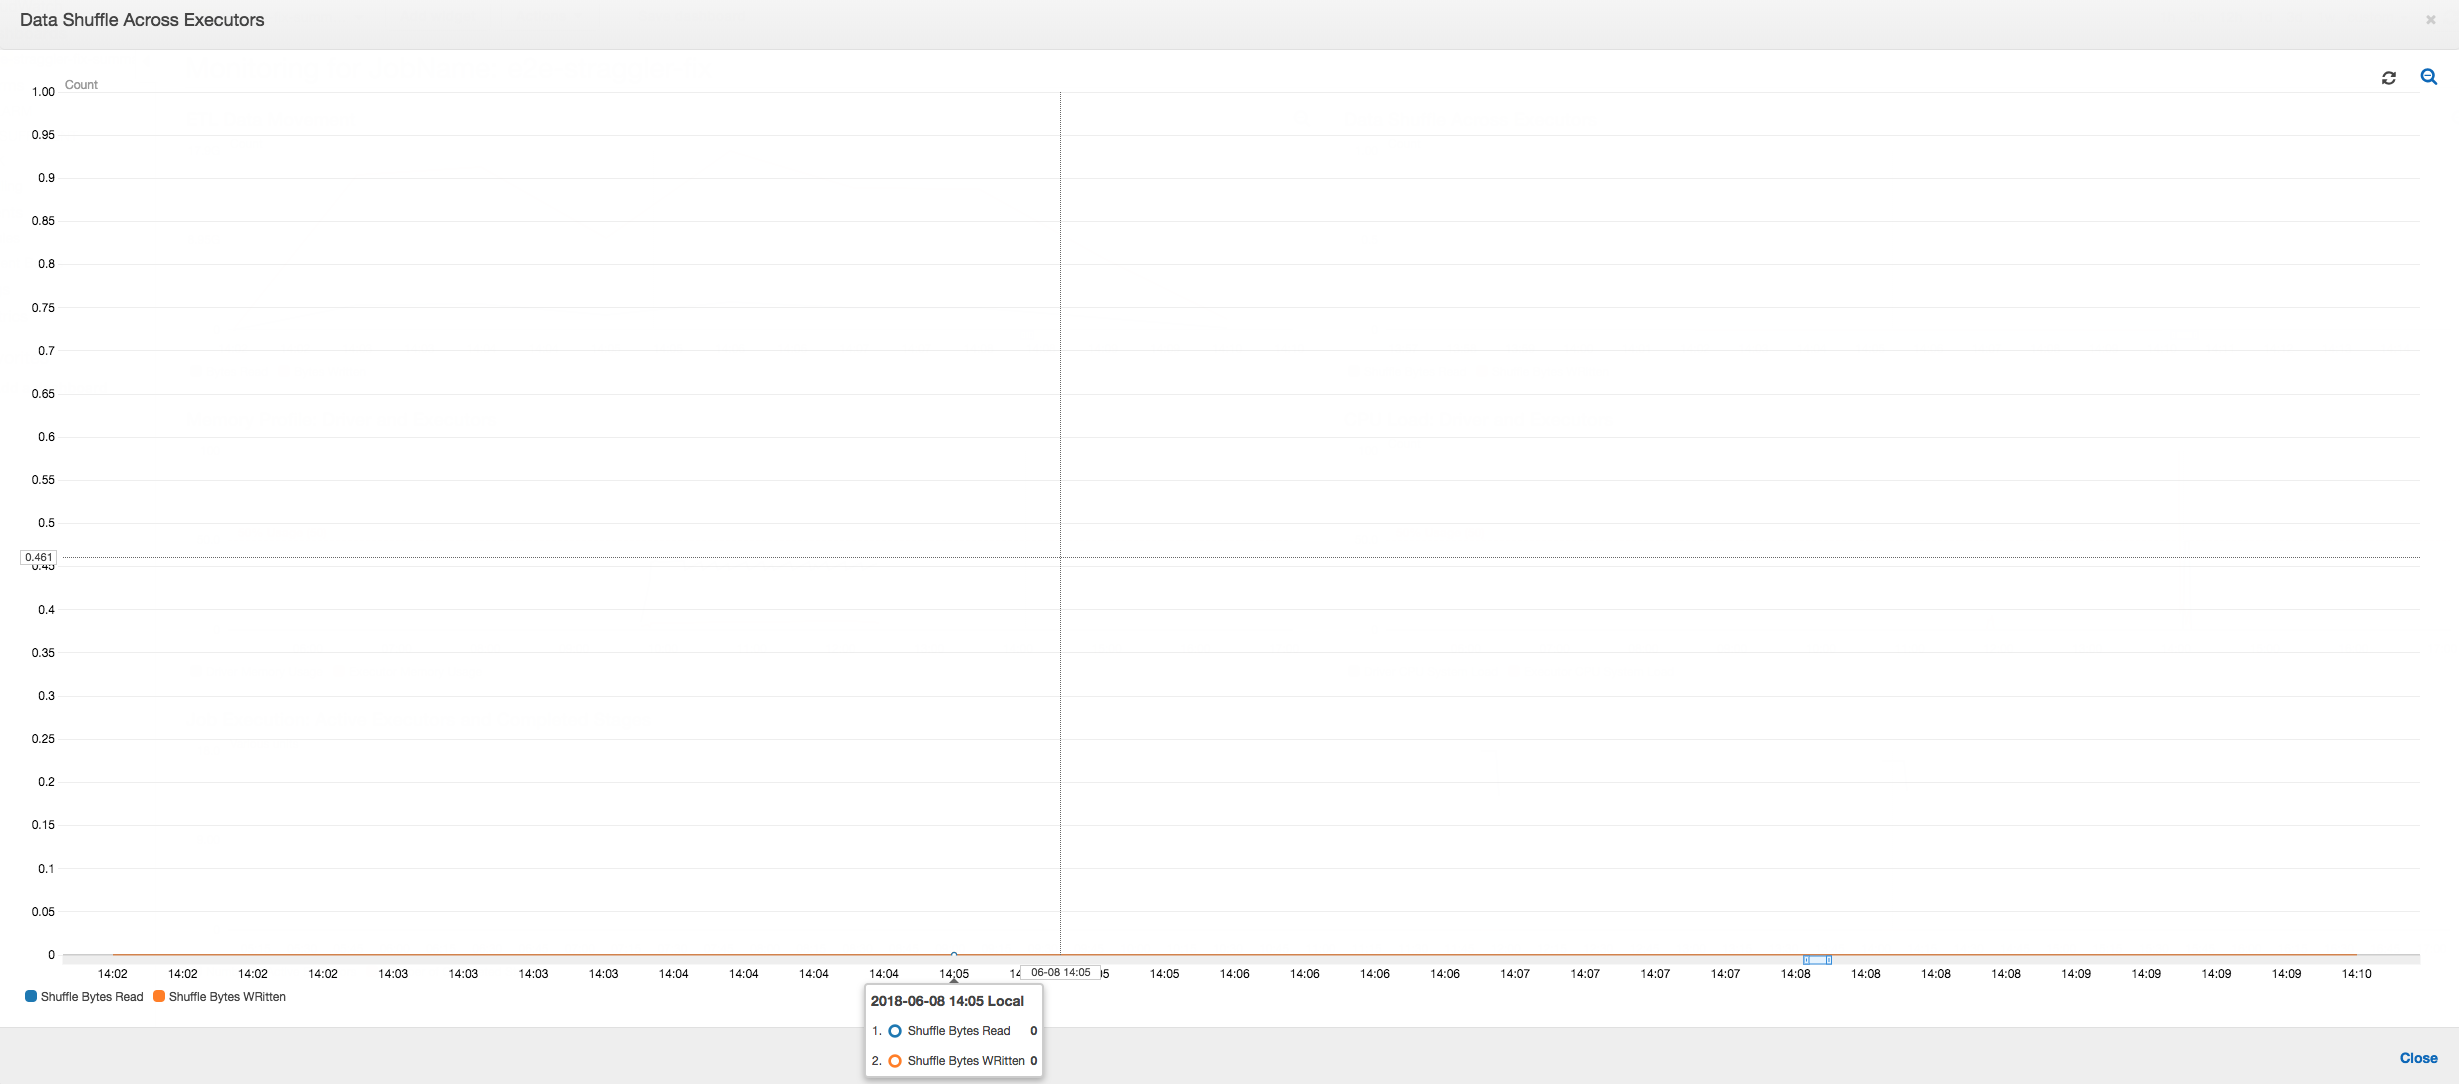
Data shuffle across executors: The number of bytes read and written during shuffling also shows a spike before Stage 2 ends, as indicated by the Job Execution and Data Shuffle metrics. After the data shuffles from all executors, the reads and writes proceed from executor number 3 only.
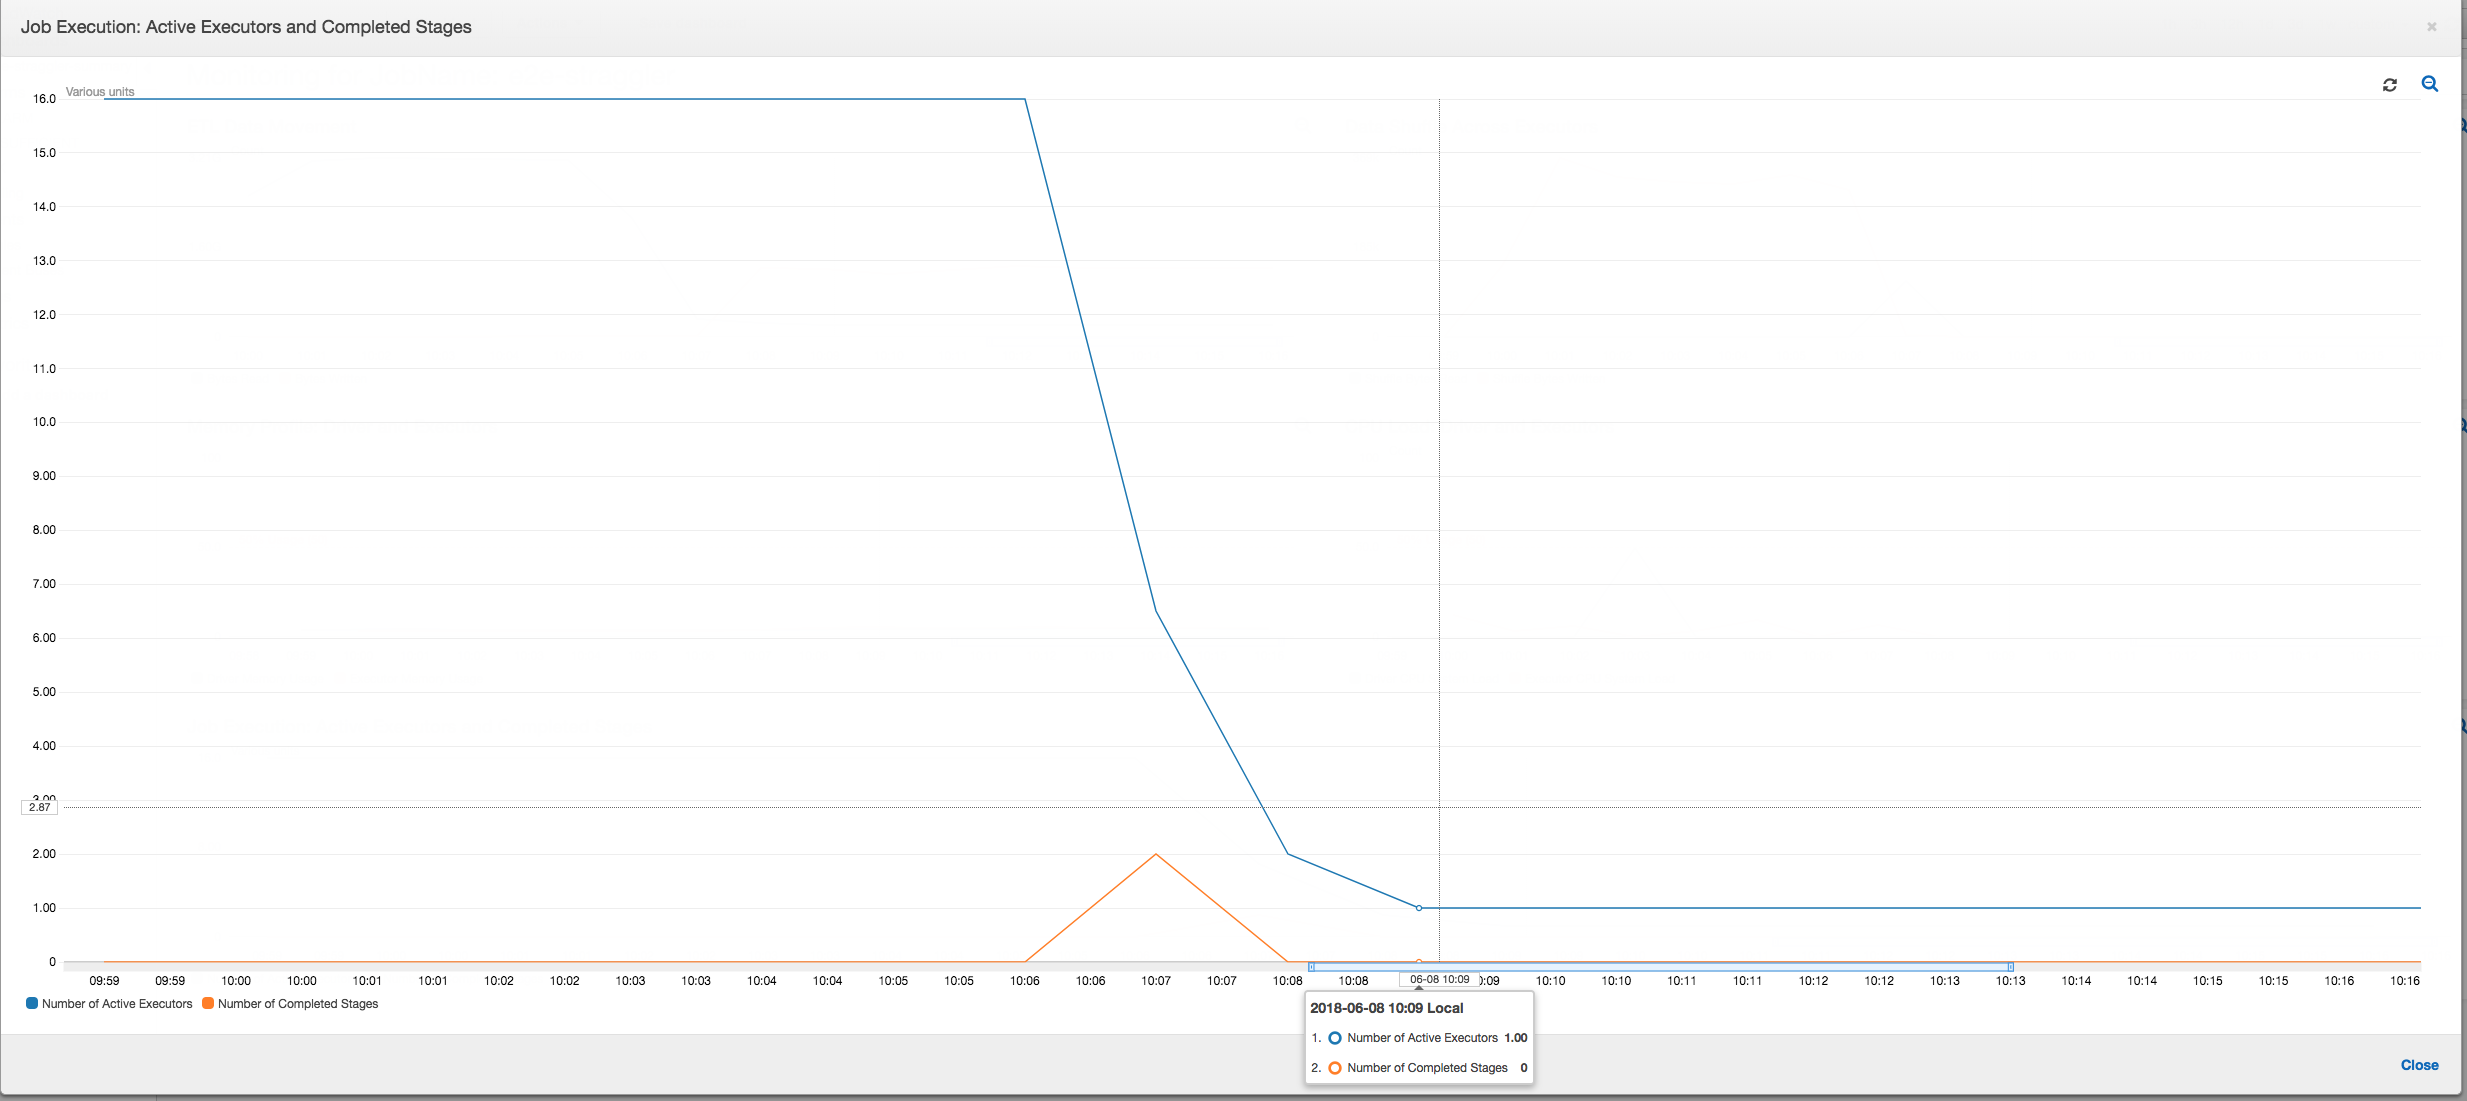
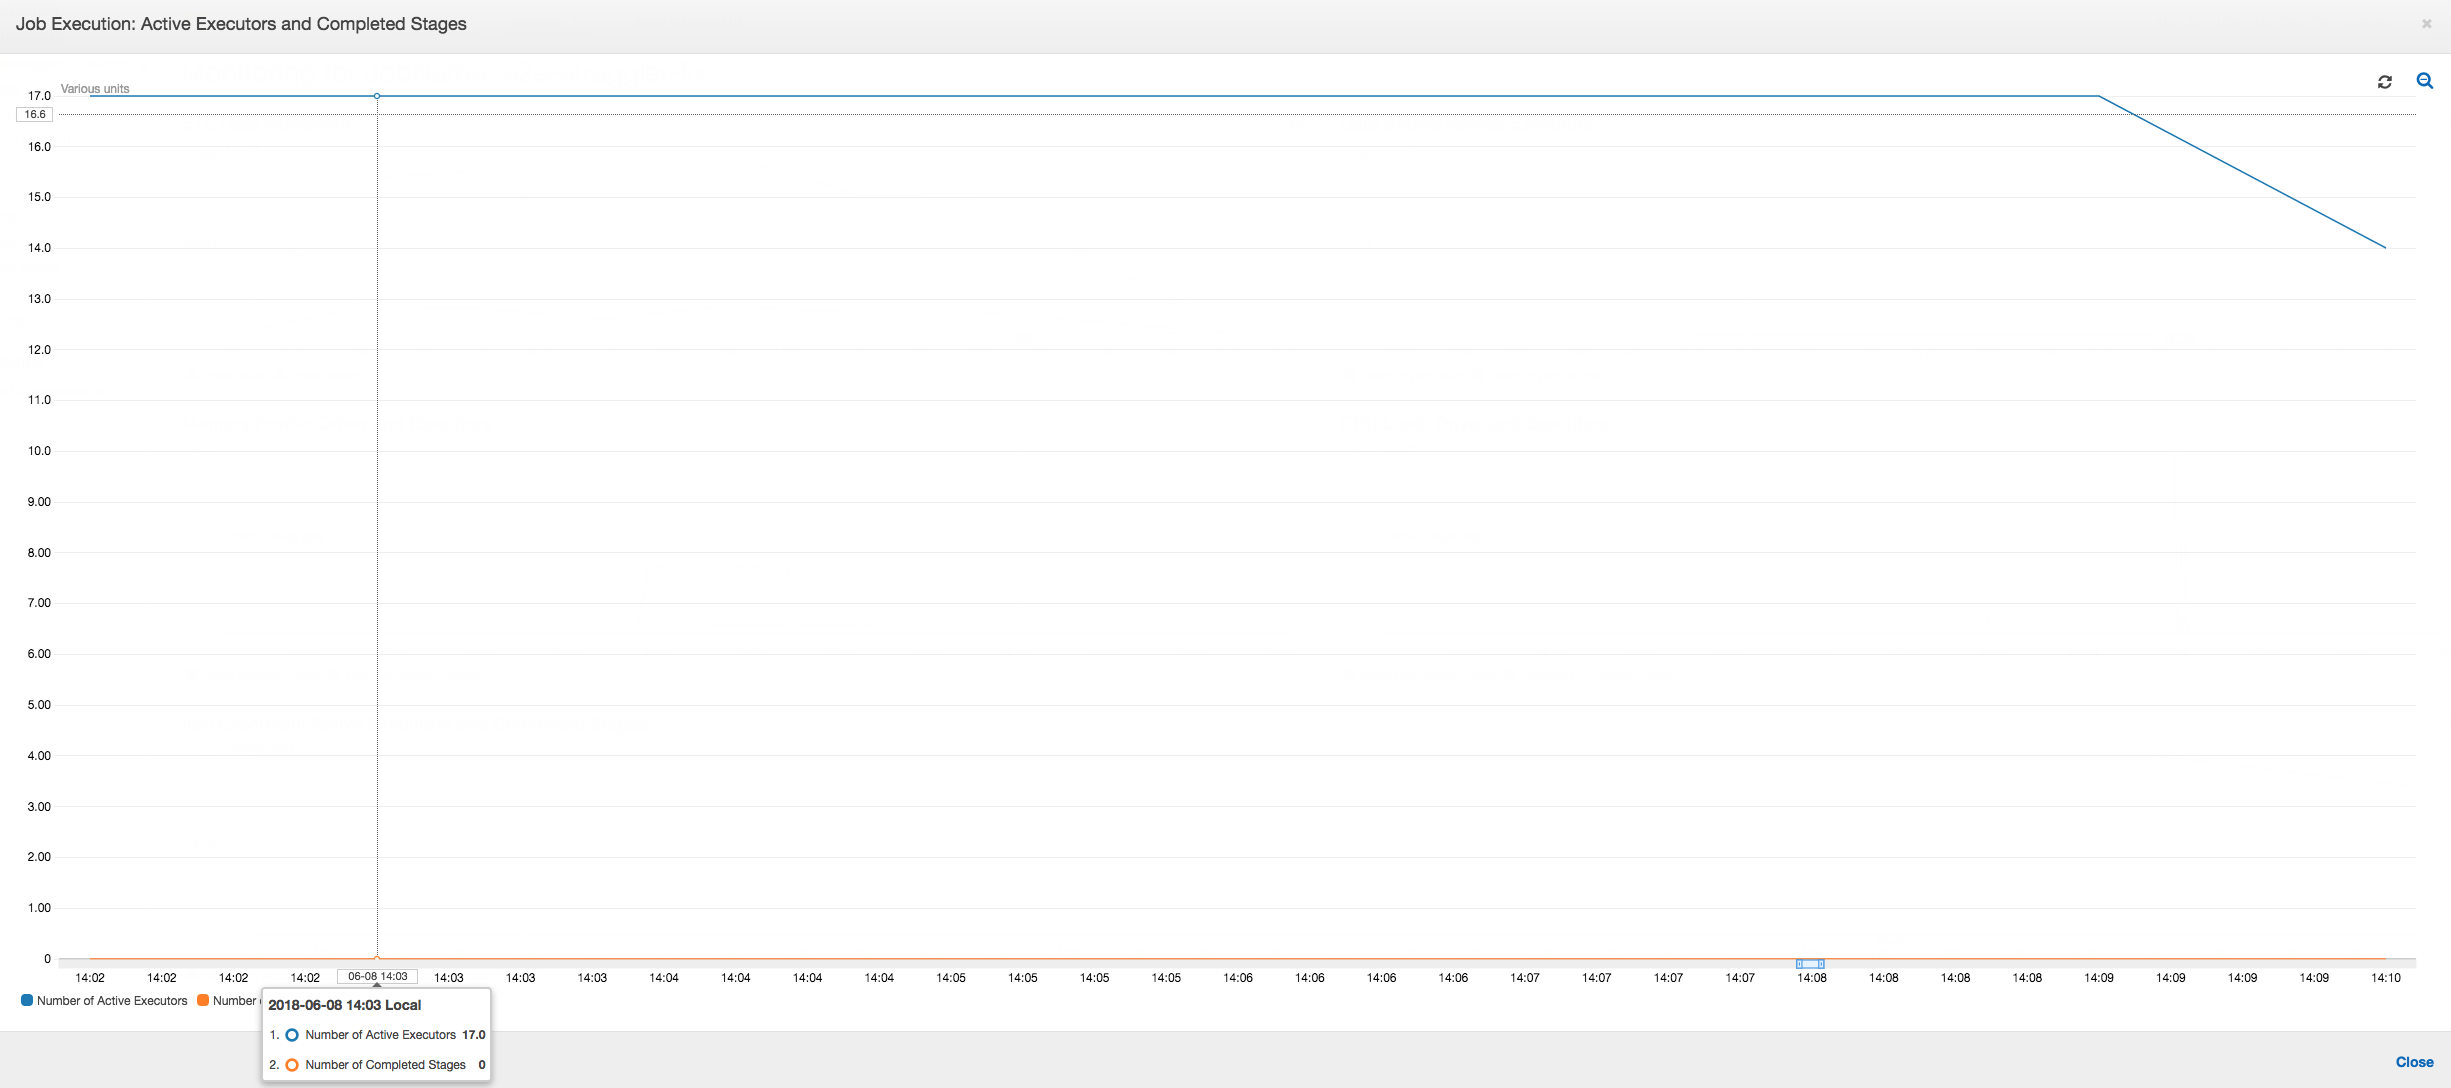
Job execution: As shown in the graph below, all other executors are idle and are eventually relinquished by the time 10:09. At that point, the total number of executors decreases to only one. This clearly shows that executor number 3 consists of the straggler task that is taking the longest execution time and is contributing to most of the job execution time.
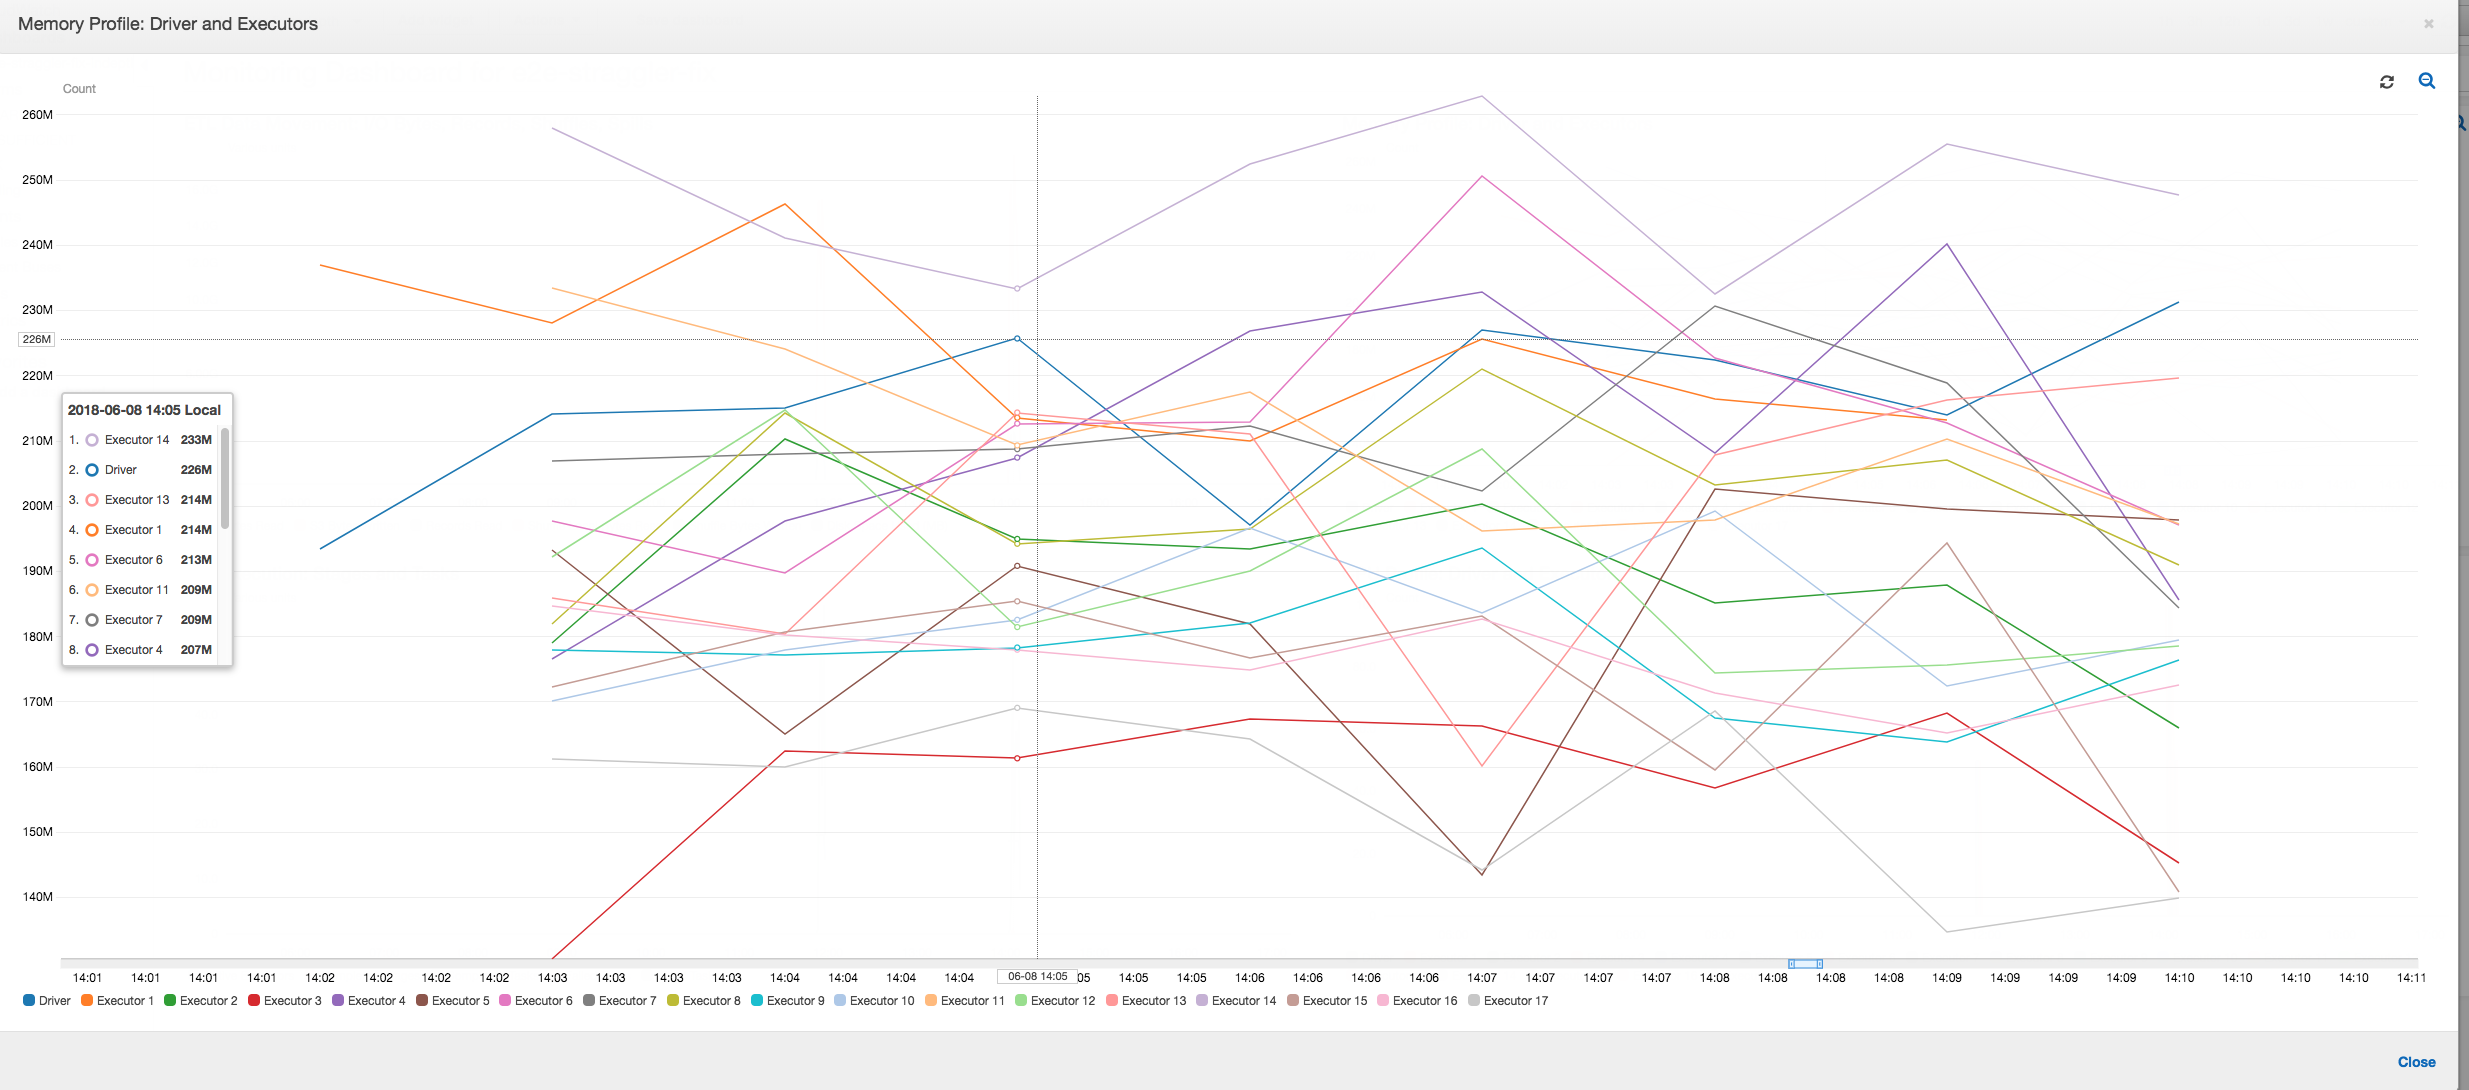
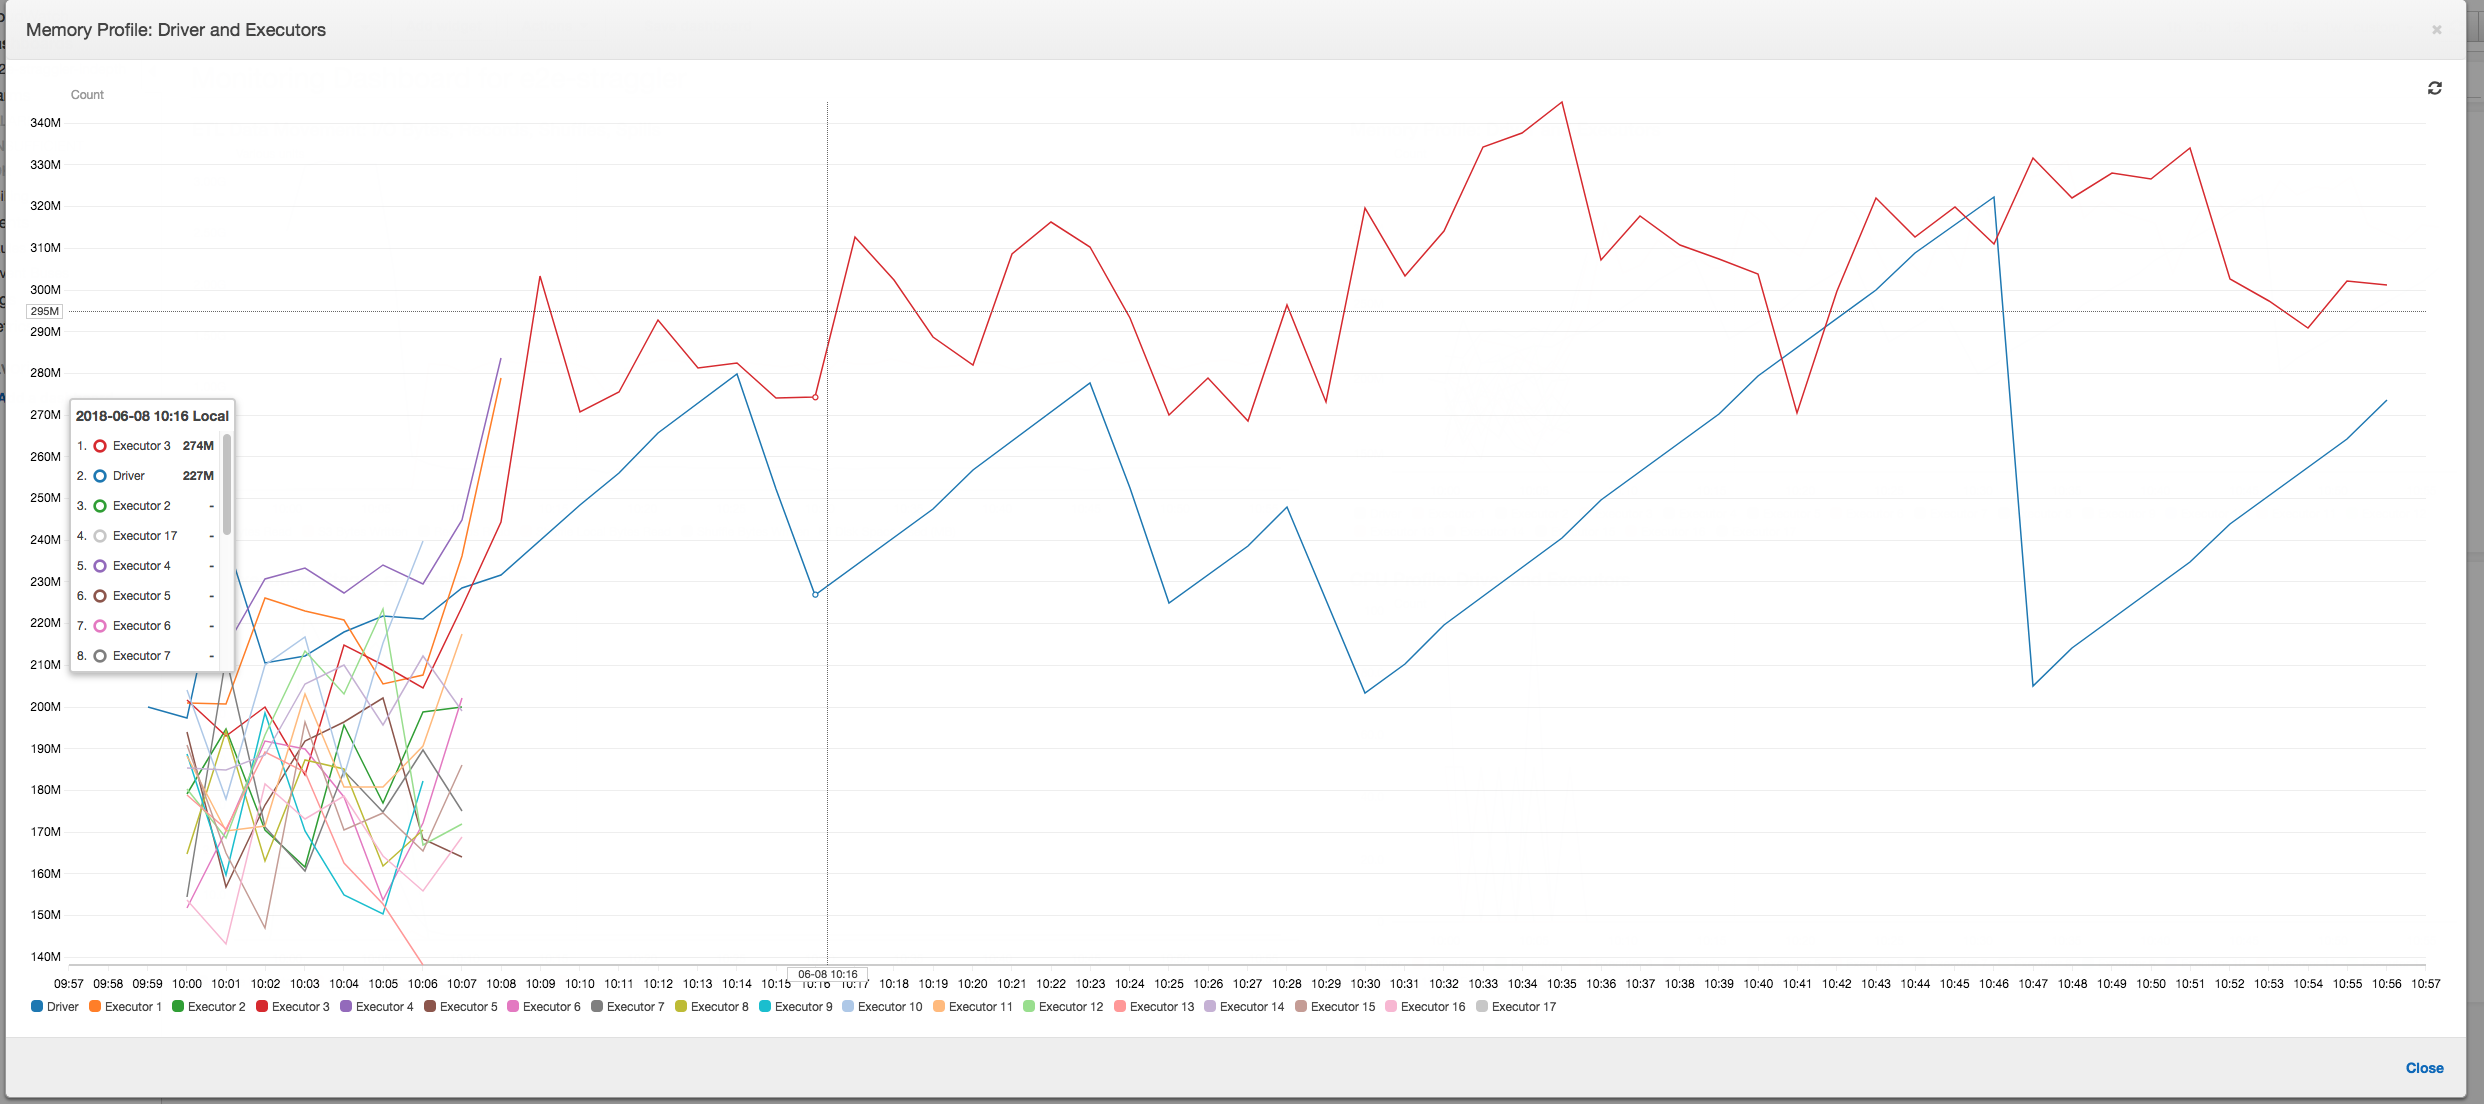
Memory profile: After the first two stages, only executor number 3 is actively consuming memory to process the data. The remaining executors are simply idle or have been relinquished shortly after the completion of the first two stages.
Fix straggling executors using grouping
You can avoid straggling executors by using the grouping feature in Amazon Glue. Use grouping to distribute the data uniformly across all the executors and coalesce files into larger files using all the available executors on the cluster. For more information, see Reading input files in larger groups.
To check the ETL data movements in the Amazon Glue job, profile the following code with grouping enabled:
df = glueContext.create_dynamic_frame_from_options("s3", {'paths': ["s3://input_path"], "recurse":True, 'groupFiles': 'inPartition'}, format="json")
datasink = glueContext.write_dynamic_frame.from_options(frame = df, connection_type = "s3", connection_options = {"path": output_path}, format = "json", transformation_ctx = "datasink4")
ETL data movement: The data writes are now streamed in parallel with the data reads throughout the job execution time. As a result, the job finishes within eight minutes—much faster than previously.
Data shuffle across executors: As the input files are coalesced during the reads using the grouping feature, there is no costly data shuffle after the data reads.
Job execution: The job execution metrics show that the total number of active executors running and processing data remains fairly constant. There is no single straggler in the job. All executors are active and are not relinquished until the completion of the job. Because there is no intermediate shuffle of data across the executors, there is only a single stage in the job.
Memory profile: The metrics show the active memory consumption across all executors—reconfirming that there is activity across all executors. As data is streamed in and written out in parallel, the total memory footprint of all executors is roughly uniform and well below the safe threshold for all executors.