Summary dashboard in Amazon GuardDuty
The GuardDuty Summary dashboard provides an aggregated view of the GuardDuty findings generated in your Amazon Web Services account in the current Amazon Web Services Region.
If you're using a GuardDuty administrator account, the dashboard provides aggregated statistics and data for your account and member accounts in your organization.
Viewing Summary dashboard
Open the GuardDuty console at https://console.amazonaws.cn/guardduty/
. GuardDuty displays the Summary dashboard by default when you open the console.
-
On the Summary page, choose the desired Amazon Web Services Region from the Region selector in the top-right corner of the console.
-
From the date range selector menu, choose the date range for which you want to view the summary. By default, the dashboard displays the data for the present day, Today.
Note
If no findings were generated during the selected date range, the dashboard will not have any data to display. You can refresh the dashboard, or adjust the date range.
Topics
Overview
This section provides the following data:
-
Attack sequences: Indicates the number of attack sequence findings that GuardDuty generated in your account in the current Region.
GuardDuty detects potential multi-stage attacks in your account. You can select the number under Attack sequences to view its details on the Findings page.
-
Total findings: Indicates the total number of findings generated in your account in the current Region. This includes both individual findings and attack sequence findings.
-
Resources with findings: Indicates the number of resources that are associated to a finding, and have been potentially compromised.
-
Accounts with findings: Indicates the number of accounts in which at least one finding was generated. If you're a standalone account, the value in this field is 1.
For the time ranges Last 7 days and Last 30 days, the Overview pane may show the percentage difference in the findings generated week over week (WoW) or month over month (MoM), respectively. If no findings were generated in the week or the month before, then with no data to compare, the percentage difference may not be available.

If you're a GuardDuty administrator account, all of these fields provide the summarized data across all the member accounts in your organization.
Findings
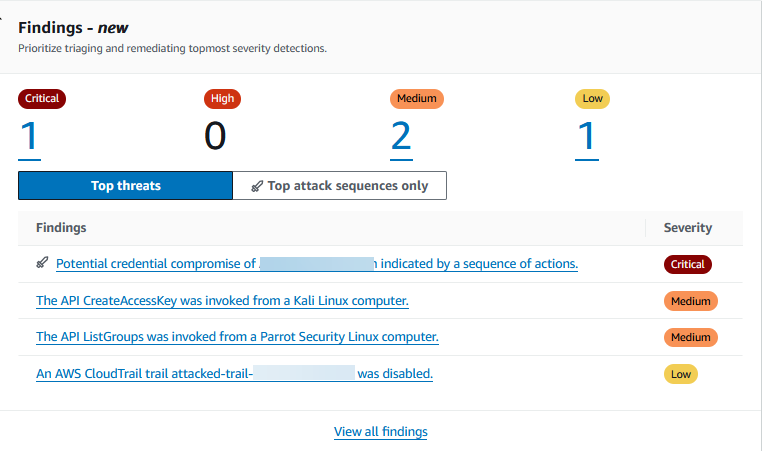
The Findings widget displays up to eight top findings. These findings are listed on the basis of their severity level, with Critical findings displayed first.
By default, you can view all the findings. To view only attack sequence findings data, turn on Top attack sequences only.
In this list, you can select any finding to view its details.

Most common finding types
This section provides a pie chart illustrating the top five most common finding types generated in the current Region. When hovering over each sector of the pie chart, you can observe the following:
-
Findings count: Indicates the number of times this finding has been generated in the chosen date range.
-
Severity: Indicates the severity level of the finding.
-
Percentage: Indicates proportion of this finding type relative to the total.
-
Last generated: Indicates how much time has passed since this finding type was last detected.
Findings by severity
This section displays a bar chart showing the total number of findings over the selected date range. The chart breaks down findings by severity (Critical, High, Medium, and Low), and helps you view the number of findings for specific dates within the range.
To view the counts for each severity level on a specific date, hover over the corresponding bar in the chart.
Accounts with most findings
This section provides the following data:
-
Account: Indicates the Amazon Web Services account ID where the finding was generated.
-
Finding count: Indicates the number of times a finding was generated for this account ID.
-
Last generated: Indicates how much time has passed since a finding type was last generated for this account ID.
-
Severity filter: By default, the data is shown for the high severity finding types. Possible options for this field are All severity, Critical severity, High severity, and Medium severity.
Resources with findings
This section provides the following data:
-
Resource: Shows the potentially impacted resource type and if this resource belongs to your account, you can access the quick link to view the resource details. If you're a GuardDuty administrator account, you can view the details of the potentially impacted resource by accessing the GuardDuty console with the credentials of the owner member account.
-
Account: Indicates the Amazon Web Services account ID to which this resource belongs.
-
Finding count: Indicates the number of times that this resource was associated to a finding.
-
Last generated: Indicates how much time has passed since a finding type associated to this resource was last generated.
-
Resource type filter: By default, the data is shown for all the resource types. By using this filter, you can choose to view the data for a specific resource type, such as Instance, AccessKey, Lambda, and others.
-
Severity filter: By default, the data is shown for All severity. By using this filter, you can choose to view the data for other severity levels. Possible options are Critical severity, High severity, Medium severity, and All severity.
Least occurring findings
This section highlights finding types that occur infrequently in your Amazon environment. This widget is designed to help you identify and investigate potential emergent threat patterns.
This widget displays the following data:
-
Finding type: Shows the finding type name.
-
Finding count: Indicates the number of times that this finding type was generated in the chosen time range.
-
Last generated: Indicates how much time has passed since this finding type was last generated.
-
Severity filter: By default, the data is shown for the high severity finding types. Possible options for this field are Critical severity, High severity, Medium severity, and All severity.
Protection plans coverage
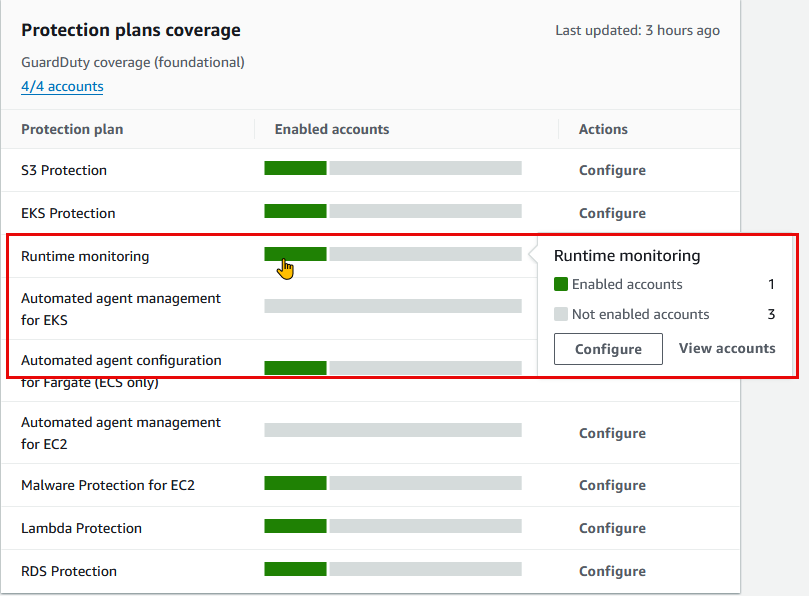
This section displays statistics for the member accounts in your organization. It shows the number of member accounts that have enabled GuardDuty (foundational threat detection) in the current Region. Only a delegated GuardDuty administrator can view the statistics for the member accounts within their organization. When you create a new Amazon organization, it might take up to 24 hours to generate the statistics for the entire organization.
How to use this widget
-
Configuration: If a protection plan is not configured, choose Configure under the Actions column.
-
Viewing enabled accounts: Hover over the bar in the Enabled accounts column to view how many accounts have enabled each protection plan. To further view account details, select the green bar, and choose View accounts.
