The SiteWise Monitor feature is not available to new customers. Existing customers can continue to use the service as normal. For more information, see SiteWise Monitor availability change
Configure trend lines
As a project owner, you can configure trend lines to display statistical analyses on your data. When you add a trend line, you choose the type of analysis and the property to analyze. This lets you and your team identify trends in your data to better understand your operation.
The following visualization types support trend lines:
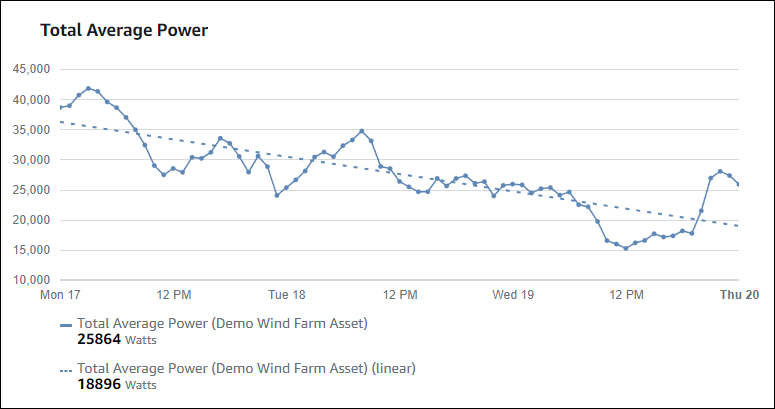
The following is an example visualization with a linear trend line.
Note
The dashboard uses only data from the selected time range to compute trend lines. This means that trend lines only show trends for visible data.
Add a trend line to a visualization
As a project owner, you can define trend lines for each visualization.
Note
You can add one of each type of trend line to each property in a visualization.
To add a trend line to a visualization
-
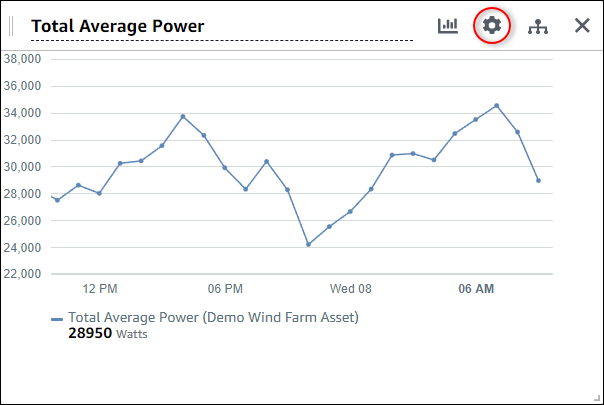
Choose the Configuration icon for the visualization to change.
-
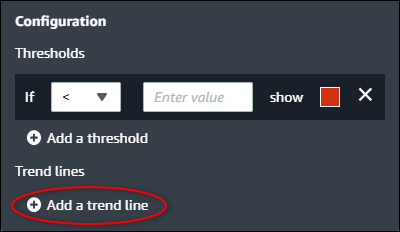
Choose Add a trend line.
-
Choose the type of trend line to display from the following option:
-
Linear – A linear regression line. SiteWise Monitor uses the least squares
method to calculate the linear regression.
-
-
Choose the property for which the trend line displays.
The trend line displays in the same color as the property data.
-
After you finish editing the dashboard, choose Save dashboard to save your changes. The dashboard editor closes. If you try to close a dashboard that has unsaved changes, you're prompted to save them.
Remove a trend line from a visualization
As a project owner, you can remove a trend line from a visualization if you no longer need it.
To remove a trend line from a visualization
-
Choose the Configuration icon for the visualization to change.
-
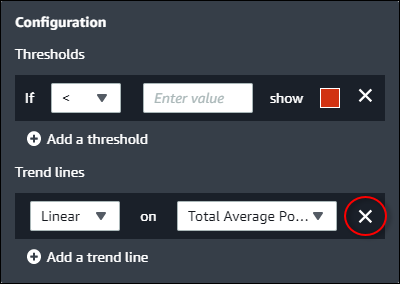
Choose the X icon for the trend line to remove.
-
After you finish editing the dashboard, choose Save dashboard to save your changes. The dashboard editor closes. If you try to close a dashboard that has unsaved changes, you're prompted to save them.