Configure widgets
Note
The SiteWise Monitor feature is no longer available to new customers. Existing customers can continue to use the service as normal. For more information, see SiteWise Monitor availability change.
Once the widget is added to the dashboard, you can configure the widget by choosing the Configuration icon in the right panel.
-
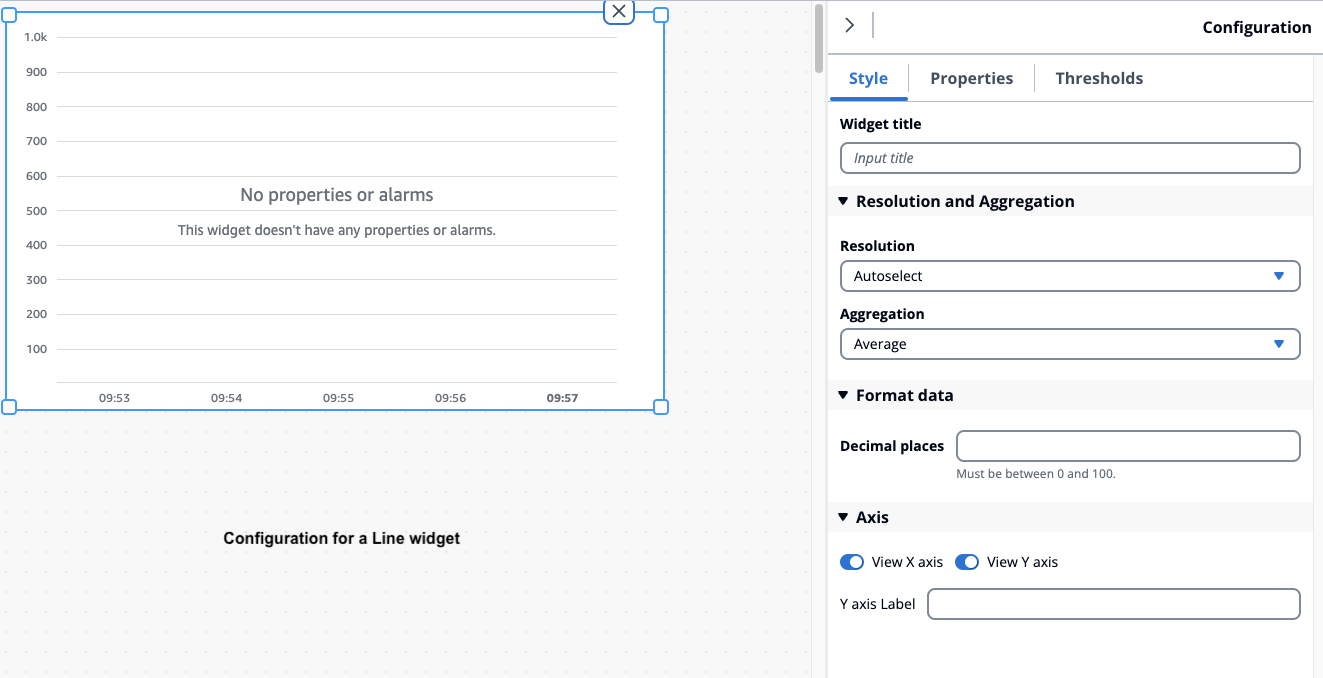
Style – Add a title in the Widget title. Different widgets have different configurations. A few examples are listed below.
-
Bar widget :
Resolution and Aggregation – Set values for resolution and aggregation here.
Format data – Set Decimal places to the number of decimals to display.
Display style – Select values to display.
Axis – Choose to display the axis.
-
Line widget :
Resolution and Aggregation – Set values for resolution and aggregation here.
Format data – Set Decimal places to the number of decimals to display.
Y-axis – Add a Label, and Min and Maxvalues.
Widget style – Select Line type, Line style, Line thickness, and Data point shapevalues.
Legend – Choose Alignment, and Display.
-
Gauge widget :
Resolution and Aggregation – Set values for resolution and aggregation here.
Format data – Set Decimal places to the number of decimals to display.
Display style – Select values to display.
Y-axis – Add a Label, and Min and Max values.
Fonts – Select Font size, Unit font size, and Label font size values.
-
-
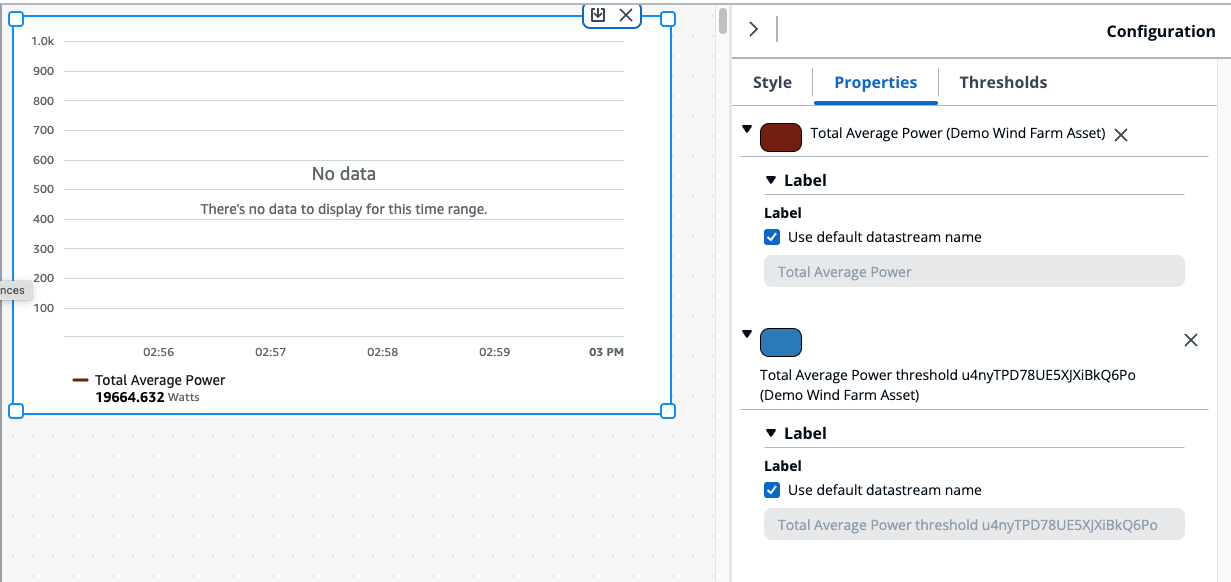
Properties – All the properties of widgets are listed in this section. Different widgets have different properties. A few examples are listed below.
-
Line widget :
Label – Choose to use the default datastream name or give a new name.
Style – Set Line type, Line style to the number of decimals to display.
Y-axis – Select values to default style, show Y-axis controls and set the Min and Max values.
-
Table widget :
Label – Choose to use the default datastream name or give a new name.
-
Table widget :
Label – Choose to use the default datastream name or give a new name.
-
-
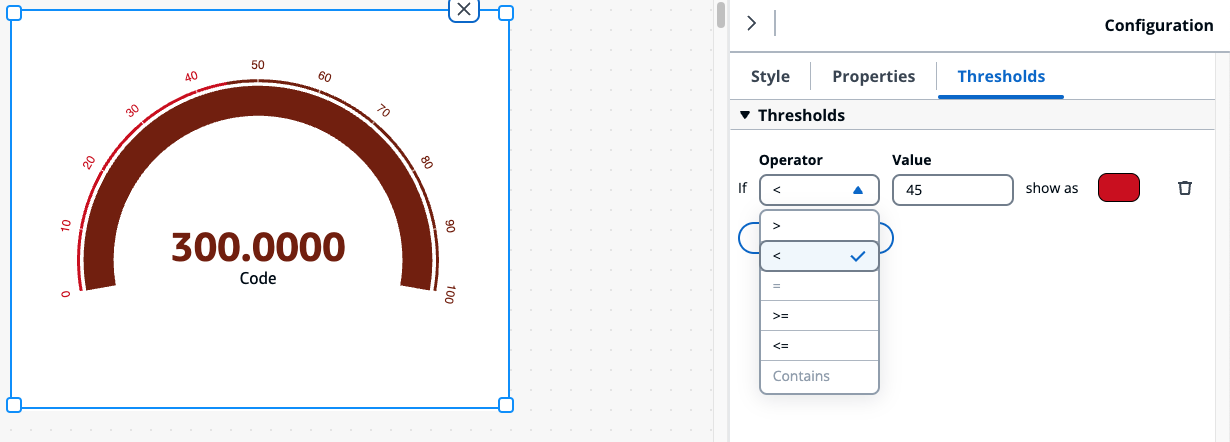
Thresholds – Add a Threshold for a widget. Different widgets have different configurations. A few examples are listed below.
-
Bar chart widget :
Choose Add a threshold to add to the widget.
Choose Operator and give a Value for the threshold. Customize the threshold with a color from the color palette.
You can choose to apply the threshold across all data.
-
Line widget :
Choose Add a threshold to add to the widget.
Choose Operator and give a Value for the threshold. Customize the threshold with a color from the color palette.
Choose how to Show thresholds from the drop down menu.
-
Gauge widget :
Choose Add a threshold to add to the widget.
Choose Operator and give a Value for the threshold. Customize the threshold with a color from the color palette.
-