Integrate Amazon IoT SiteWise with Grafana
Grafana is a data visualization platform used to visualize and monitor data in dashboards. In Grafana version 10.4.0 and later, use the Amazon IoT SiteWise plugin to visualize your Amazon IoT SiteWise asset data in Grafana dashboards. Users can visualize data from multiple Amazon sources (such as Amazon IoT SiteWise, Amazon Timestream, and Amazon CloudWatch) and other data sources with a single Grafana dashboard.
You have two options to use the Amazon IoT SiteWise plugin:
-
Local Grafana servers
You can set up the Amazon IoT SiteWise plugin on a Grafana server that you manage. For more information about how to add and use the plugin, see the Amazon IoT SiteWise Datasource README
file on the GitHub website. -
Amazon Managed Service for Grafana
You can use the Amazon IoT SiteWise plugin in the Amazon Managed Service for Grafana (AMG). AMG manages Grafana servers for you so that you can visualize your data without having to build, package, or deploy any hardware or any other Grafana infrastructure. For more information, see the following topics in the Amazon Managed Service for Grafana User Guide:
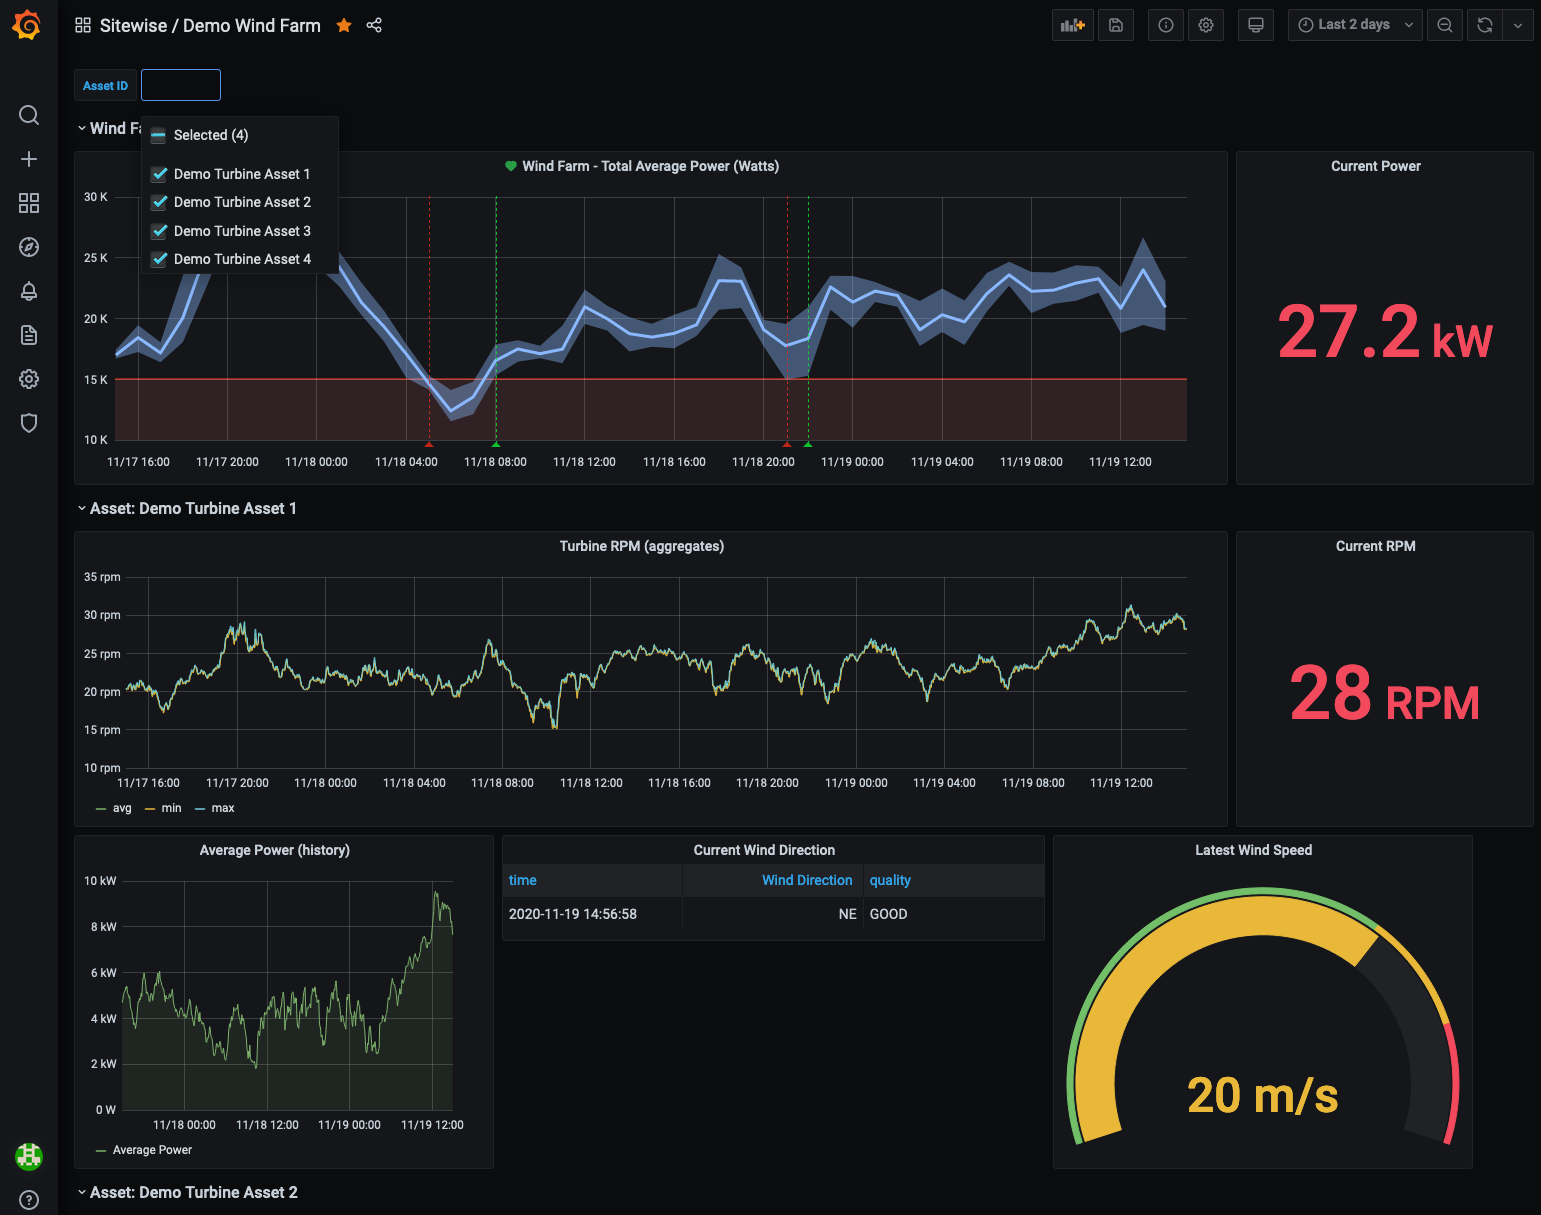
Example Grafana dashboard
The following Grafana dashboard visualizes the demo
wind farm. You can access this demo dashboard on the Grafana Play
