# How to use Amazon IoT TwinMaker knowledge graph with Grafana
This section shows you how to add a query editor panel to your Amazon IoT TwinMaker Grafana dashboard to run and display queries.
## Amazon IoT TwinMaker query editor prerequisites
Before you use the Amazon IoT TwinMaker knowledge graph in Grafana, complete the following prerequisites:
+ Create an Amazon IoT TwinMaker workspace. You can create a workspace in the [Amazon IoT TwinMaker console](https://console.amazonaws.cn/iottwinmaker/).
+ Configure Amazon IoT TwinMaker for use with Grafana. For instructions, see [Amazon IoT TwinMaker Grafana dashboard integration](grafana-integration.md).
**Note**
To use the Amazon IoT TwinMaker knowledge graph, you need to be in either the **standard** or **tiered bundle** pricing modes. For more information, see [Switch Amazon IoT TwinMaker pricing modes](tm-pricing-mode.md).
## Amazon IoT TwinMaker query editor permissions
To use the Amazon IoT TwinMaker query editor in Grafana, you must have an IAM role with permission for the action `iottwinmaker:ExecuteQuery`. Add that permission to your workspace dashboard role, as shown in this example:
------
#### [ JSON ]
****
```
{
"Version":"2012-10-17",
"Statement": [
{
"Effect": "Allow",
"Action": [
"s3:GetObject"
],
"Resource": [
"arn:aws-cn:s3:::{{amzn-s3-demo-bucket}}",
"arn:aws-cn:s3:::{{amzn-s3-demo-bucket}}/*"
]
},
{
"Effect": "Allow",
"Action": [
"iottwinmaker:GetEntity",
"iottwinmaker:ListEntities",
"iottwinmaker:ExecuteQuery"
],
"Resource": [
"arn:aws-cn:iottwinmaker:{{us-west-2}}:{{111122223333}}:workspace/{{workspaceId}}",
"arn:aws-cn:iottwinmaker:{{us-west-2}}:{{111122223333}}:workspace/{{workspaceId}}/*"
]
},
{
"Effect": "Allow",
"Action": "iottwinmaker:ListWorkspaces",
"Resource": "*"
}
]
}
```
------
**Note**
When you configure your Amazon IoT TwinMaker Grafana data source, make sure to use the role with this permission for the **Assume role ARN** field. After you add it, you can select your workspace from the dropdown next to **Workspace**.
For more information, see [Creating a dashboard IAM role](dashboard-IAM-role.md#dashboard-IAM-role.title).
### Set up the Amazon IoT TwinMaker query editor panel
**To set up a new Grafana dashboard panel for knowledge graph**
1. Open your Amazon IoT TwinMaker Grafana dashboard.
1. Create a new **dashboard panel**. For detailed steps on how to create a panel, see [ Create a dashboard](https://grafana.com/docs/grafana/latest/dashboards/build-dashboards/create-dashboard/) in the Grafana documentation.
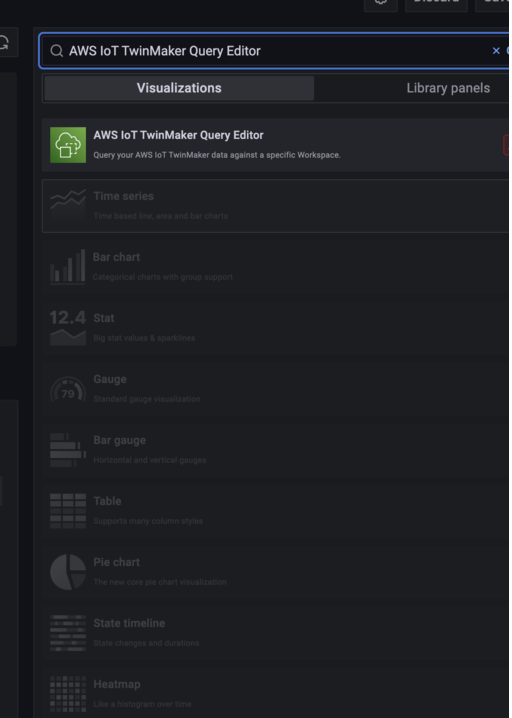
1. From the list of visualizations, select **Amazon IoT TwinMaker Query Editor**.
1. Select the data source to run queries against.
1. **(Optional)** Add a name for the new panel in the provided field.
1. Select **Apply** to save and confirm your new panel.
The knowledge graph panel works in a similar way as the query editor provided in the Amazon IoT TwinMaker console. You can run, write, and clear queries you make in the panel. For more information on how to write queries, see [Amazon IoT TwinMaker knowledge graph additional resources](tm-knowledge-graph-resources.md).
#### How to use the Amazon IoT TwinMaker query editor
The results of your queries are displayed in three ways, as shown in the following images: visualized in a graph, listed in a table, or presented as a run summary.
+ **Graph visualization:**
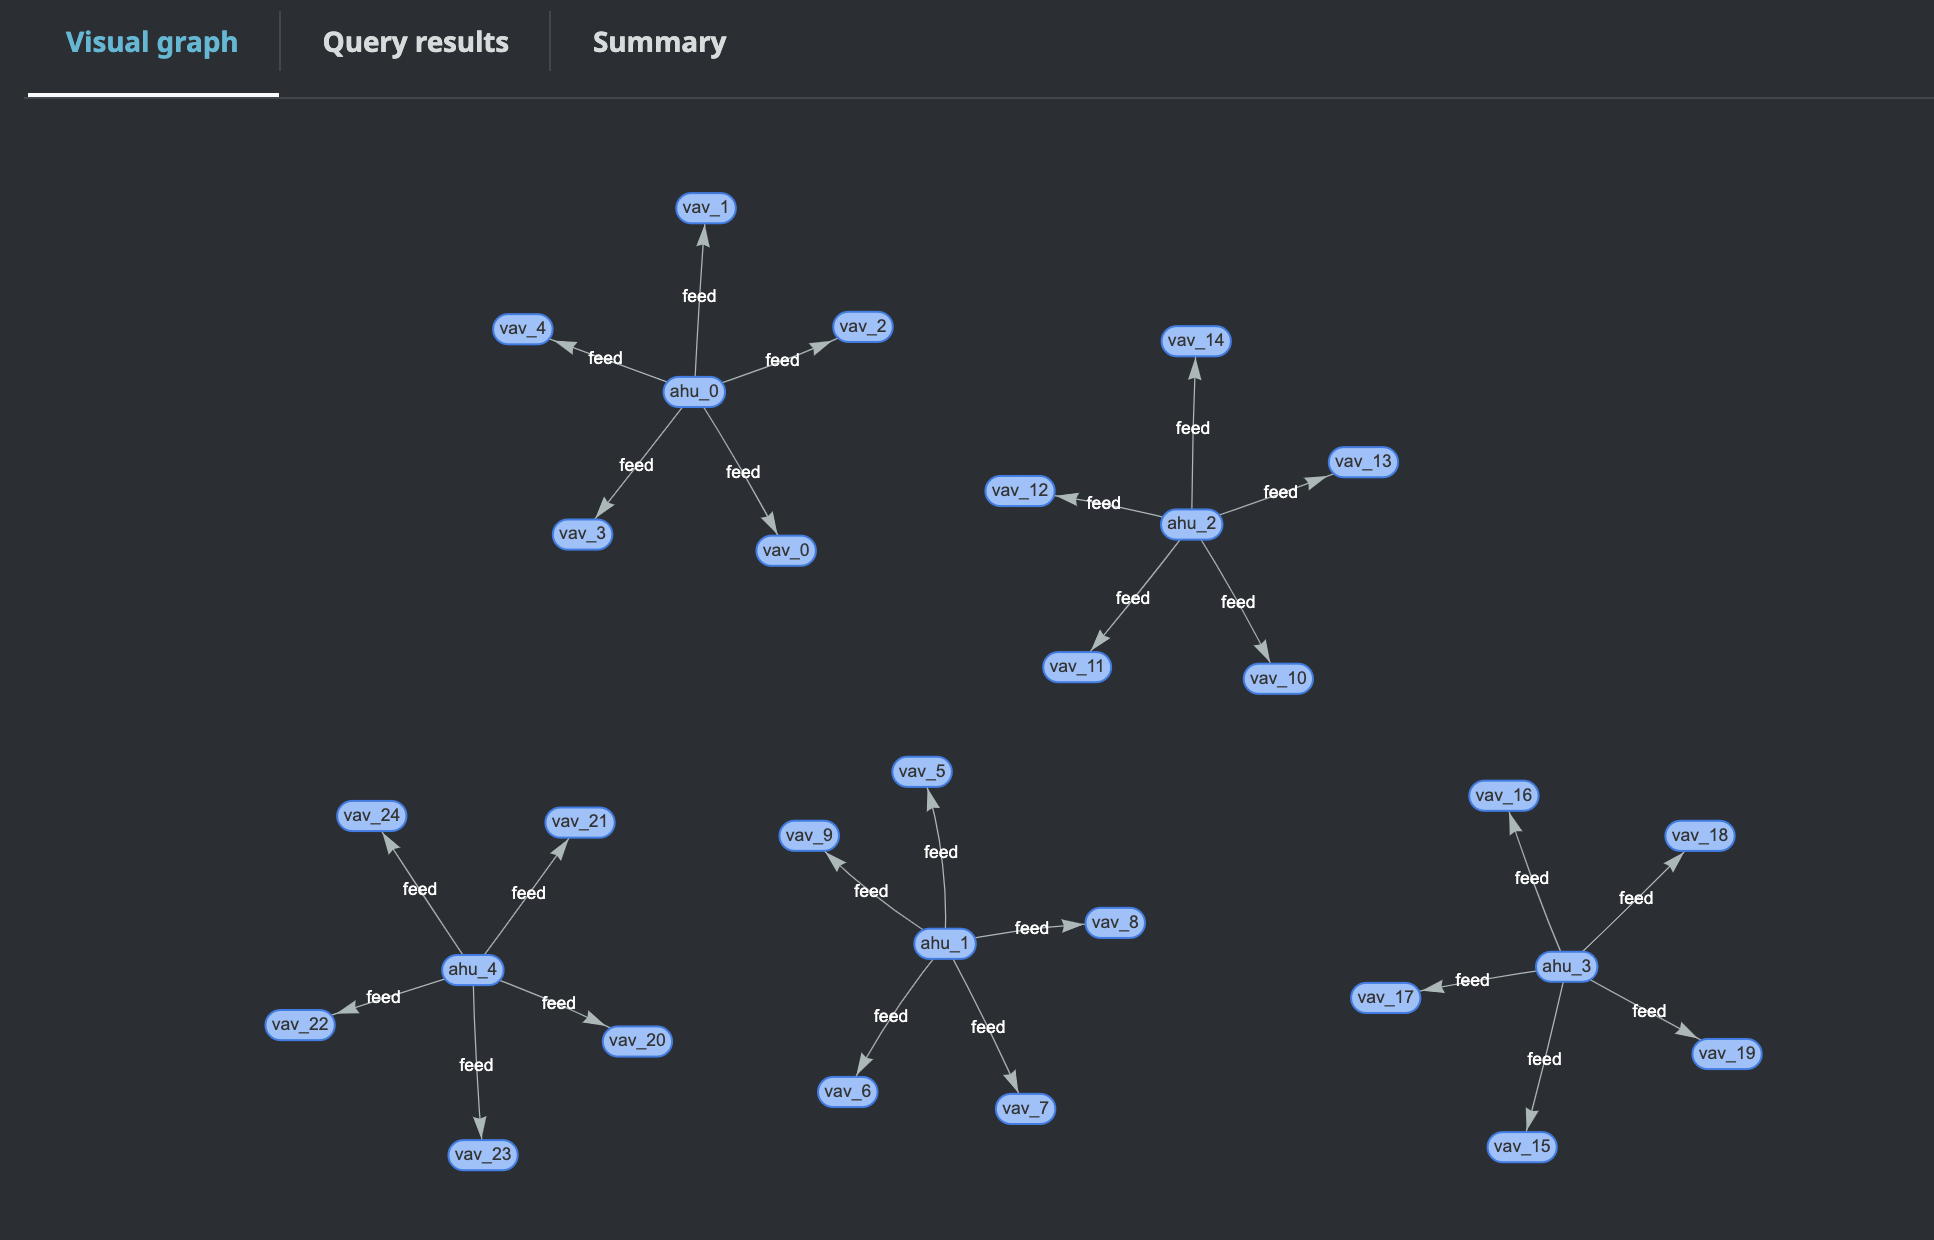
The visual graph only displays data for queries that have at least one relation in the result. The graph displays entities as nodes and relationships as directed edges in the graph.
+ **Tabular data:**
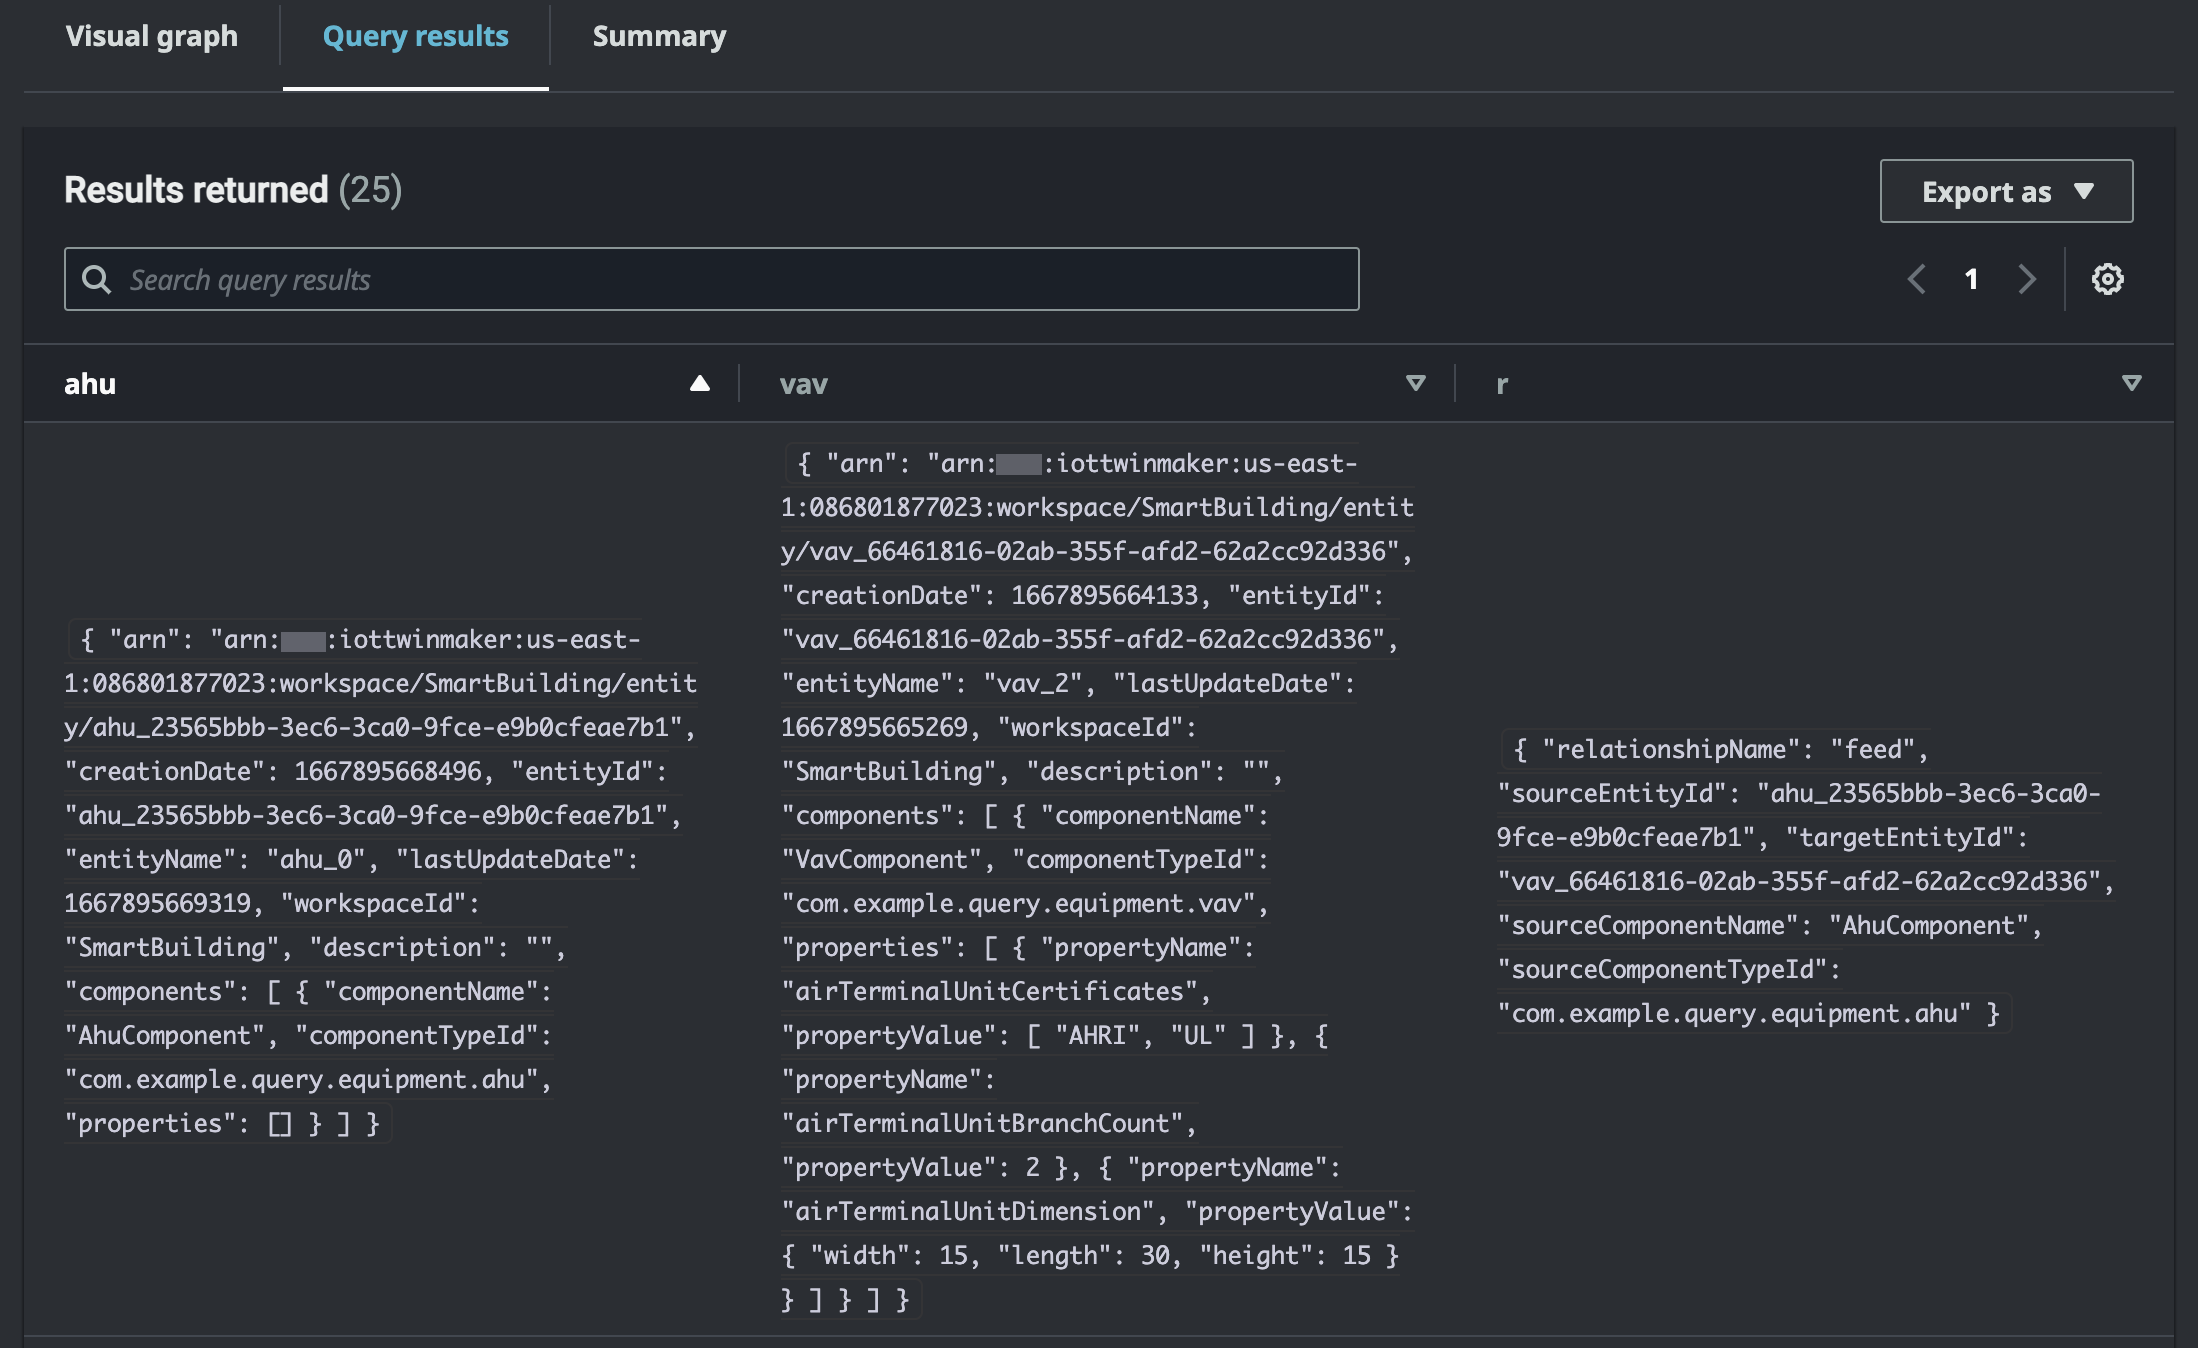
The tabular data format displays the data for all queries. You can search the table for specific results or subsets of the results. The data can be exported in JSON or CSV format.
+ **Run summary**
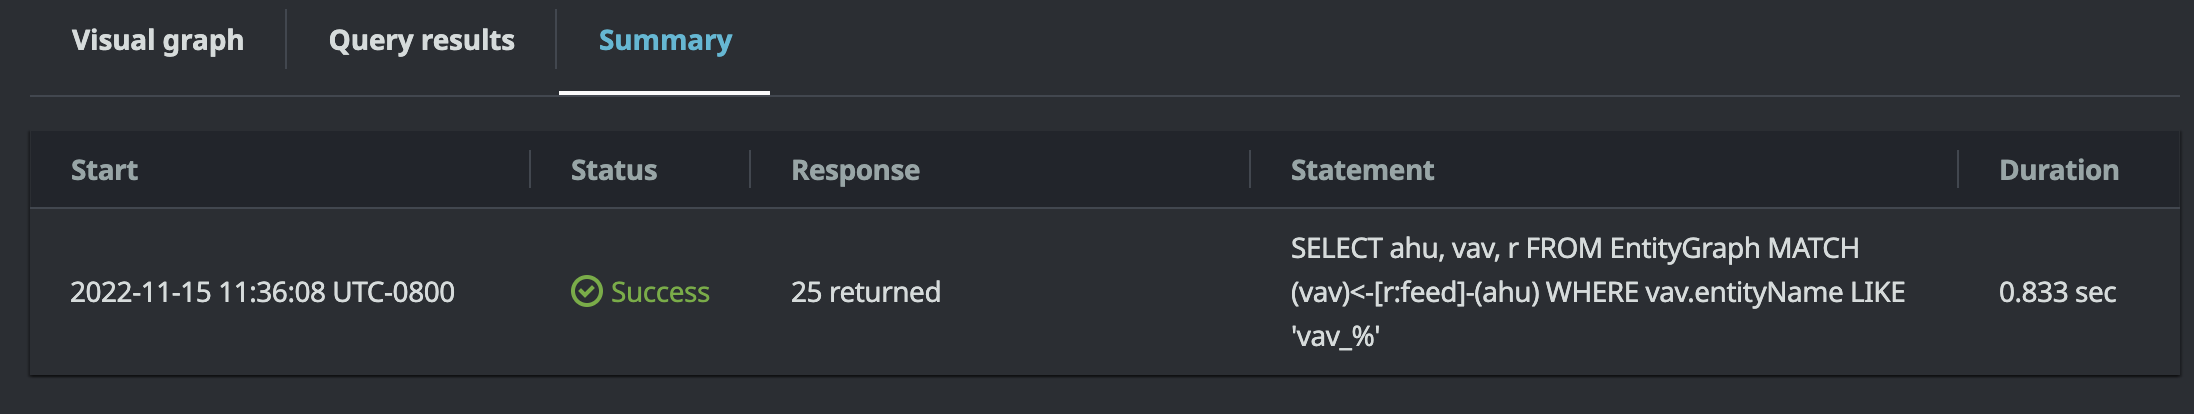
The run summary displays the query and metadata about the status of the query.