Connect Amazon IoT SiteWise Alarms to Amazon IoT TwinMaker Grafana dashboards
Note
This feature is in public preview and is subject to change.
Amazon IoT TwinMaker is able import Amazon IoT SiteWise and Events alarms into Amazon IoT TwinMaker components. This allows you to be able to query alarm status and configure alarm thresholds without implementing a custom data connector for Amazon IoT SiteWise data migration. You can use the Amazon IoT TwinMaker Grafana plugin to visualize the alarm status and configure the alarm threshold in Grafana, without making API calls to Amazon IoT TwinMaker or interacting directly with Amazon IoT SiteWise alarms.
Note
End of support notice: On May 20, 2026, Amazon will end support for Amazon IoT Events. After May 20, 2026, you will no longer be able to access the Amazon IoT Events console or Amazon IoT Events resources. For more information, see Amazon IoT Events end of support.
Amazon IoT SiteWise alarm configuration prerequisites
Before creating alarms and integrating them into your Grafana dashboard, make sure you have reviewed the following prerequisites:
Become familiar with Amazon IoT SiteWise's model and asset system. For more information, see Creating asset models and Creating assets in the Amazon IoT SiteWise User Guide.
Become familiar with the IoT Events alarm models and how to attach them to an Amazon IoT SiteWise model. For more information, see Defining Amazon IoT Events alarms in the Amazon IoT SiteWise User Guide.
Integrate Amazon IoT TwinMaker with Grafana so you can access your Amazon IoT TwinMaker resources in Grafana. For more information see, Amazon IoT TwinMaker Grafana dashboard integration.
Define the Amazon IoT SiteWise alarm component IAM role
Amazon IoT TwinMaker uses the workspace IAM role to query and configure the alarm threshold in Grafana. The following permissions are required in the Amazon IoT TwinMaker workspace role, in order to interact with Amazon IoT SiteWise alarms in Grafana:
{
"Effect": "Allow",
    "Action": [
        "iotevents:DescribeAlarmModel",
    ],
    "Resource": ["{IoTEventsAlarmModelArn}"]
},{
"Effect": "Allow",
    "Action": [
        "iotsitewise:BatchPutAssetPropertyValue"
    ],
    "Resource": ["{IoTSitewiseAssetArn}"]
}
In the Amazon IoT TwinMaker consolecom.amazon.iotsitewise.alarm as the
component type, and pick the corresponding asset and alarm models.
.png)
The above screenshot is example of creating this entity with the type com.amazon.iotsitewise.alarm.
When you create this component, Amazon IoT TwinMaker automatically imports the related alarm properties from Amazon IoT SiteWise and Amazon IoT Events. You can the repeat this alarm component type pattern to create alarm components for all the assets needed in your workspace.
Query and update through the Amazon IoT TwinMaker API
After creating alarm components, you can query the alarm status, threshold, and update alarm thresholds through the Amazon IoT TwinMaker API.
Below is a sample request to query alarm status:
aws iottwinmaker get-property-value-history --cli-input-json \
'{
    "workspaceId": "{workspaceId}",
    "entityId": "{entityId}",
    "componentName": "{componentName}",
    "selectedProperties": ["alarm_status"],
    "startTime": "{startTimeIsoString}",
    "endTime": "{endTimeIsoString}"
}'
Below is a sample request to query the alarm threshold.
aws iottwinmaker get-property-value-history --cli-input-json \
'{
    "workspaceId": "{workspaceId}",
    "entityId": "{entityId}",
    "componentName": "{componentName}",
    "selectedProperties": ["alarm_threshold"],
    "startTime": "{startTimeIsoString}",
    "endTime": "{endTimeIsoString}"
}'
Below is a sample request to update the alarm threshold:
aws iottwinmaker batch-put-property-values --cli-input-json \
'{
    "workspaceId": "{workspaceId}",
    "entries": [
        {
            "entityPropertyReference": {
                "entityId": "{entityId}",
                "componentName": "{componentName}",
                "propertyName": "alarm_threshold"
            },
            "propertyValues": [
                {
                    "value": {
                        "doubleValue": "{newThreshold}"
                    },
                    "time": "{effectiveTimeIsoString}"
                }
            ]
        }
    ]
}'
Configure your Grafana dashboard for alarms
A second write enabled dashboard IAM role needs to be created , that is a normal role but with permission for the action iottwinmaker:BatchPutPropertyValues to add to the TwinMaker workspace arn like in the example below.
Alternatively you can add this statement at the end of your IAM role instead:
{
    "Effect": "Allow",
    "Action": [
        "iottwinmaker:BatchPutPropertyValues"
    ],
    "Resource": [
        "{workspaceArn}",
        "{workspaceArn}/*"
    ]
}
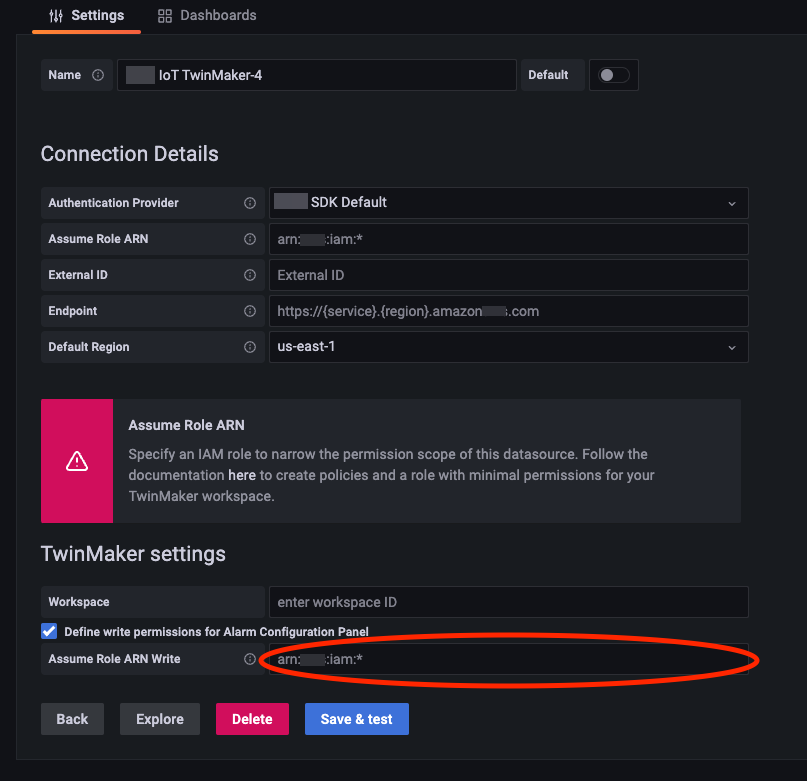
The datasource needs to have it’s write arn set with the dashboard write role you created.
After you modify your IAM role, login into your Grafana dashboard to assume the updated role arn. Select the checkbox for Define write permissions for Alarm Configuration Panel and copy in the arn for the Write role.

Use Grafana dashboard for alarm visualization
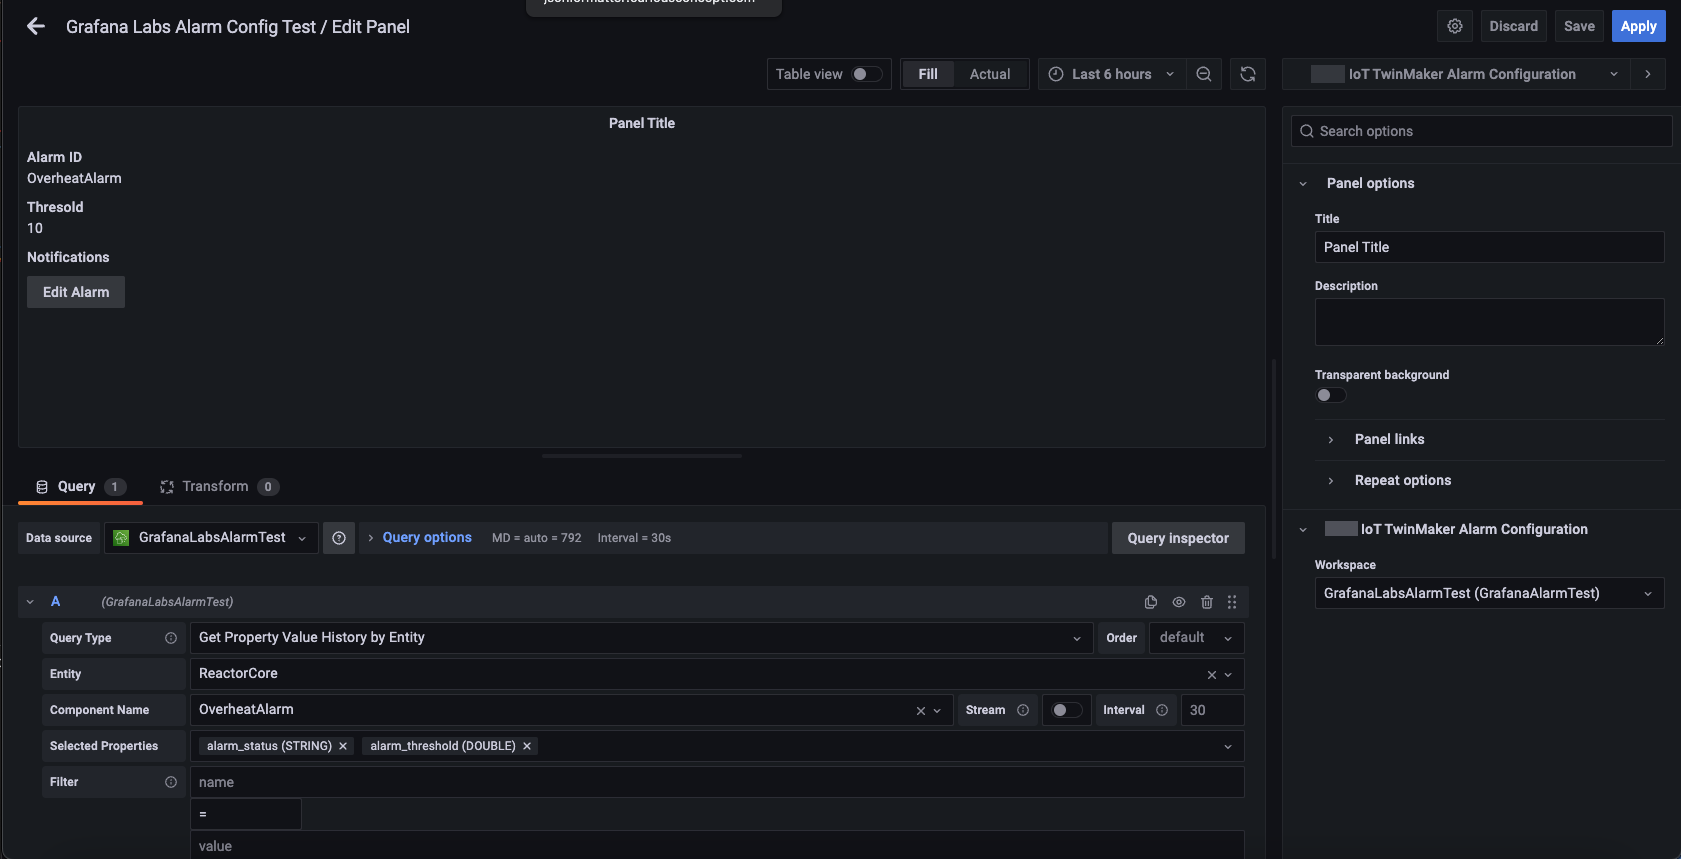
Use the following procedure to add an alarm configuration panel to your dashboard and configure it: :
Select the workspace in the panel options.
Set your datasource in the query configuration.
Use the following query type:
Get Property Value History by Entity.Select an entity or entity variable, you wish to add an alarm to.
Once you have selected the entity, select a component or component variable, to apply a property to.
For the property, choose:
alarm_statusandalarm_threshold.When it's connected you should see the Id for the alarm Id and it’s current threshold.
Note
For the public preview, no notifications are shown. You should review your alarm status and threshold to make sure the properties were applied correctly.
The default Query Order of Ascending should be used so the latest value shows.
The filter section of the Query can be left empty. A complete configuration is pictured below:

By using the Edit Alarm button you can bring up a dialog to change the current alarm threshold.
Select Save to set the new threshold value.

Note
This panel should only be used with a live time range that includes the present. Using it with time ranges that end and start in the past may show unexpected values when editing alarm thresholds as the current threshold always.