终止支持通知: Amazon 将于 2025 年 12 月 15 日终止对的支持 Amazon IoT Analytics。2025 年 12 月 15 日之后,您将无法再访问 Amazon IoT Analytics 控制台或 Amazon IoT Analytics 资源。有关更多信息,请参阅Amazon IoT Analytics 终止支持。
本文属于机器翻译版本。若本译文内容与英语原文存在差异,则一律以英文原文为准。
可视化数据 Amazon IoT Analytics
要将 Amazon IoT Analytics 数据可视化,您可以使用 Amazon IoT Analytics 控制台或 Quick Suite。
使用控制台可视化 Amazon IoT Analytics 数据
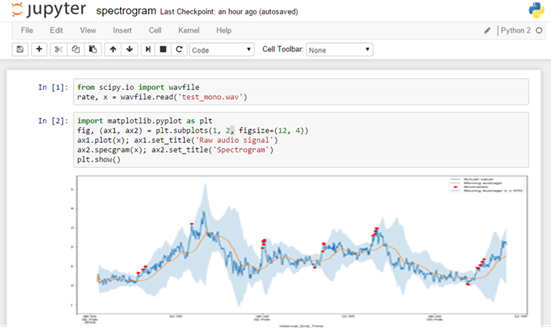
Amazon IoT Analytics 可以在Amazon IoT Analytics 控制台output.html)。例如,如果您定义一个运行 Jupyter notebook 的容器数据集,并在 Jupyter notebook 中创建可视化内容,您的数据集可能类似以下内容。
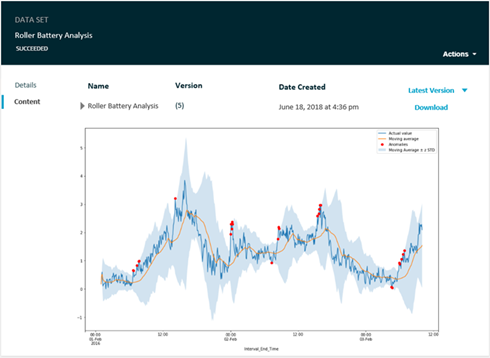
然后,在创建容器数据集内容后,您可以在控制台的数据集内容页面上查看该可视化内容。
有关创建运行 Jupyter notebook 的容器数据集的信息,请参阅自动执行工作流程。