Monitoring Lambda applications
The Applications section of the Lambda console includes a Monitoring tab where you can review an Amazon CloudWatch dashboard with aggregate metrics for the resources in your application.
To monitor a Lambda application
Open the Lambda console Applications page
. -
Choose Monitoring.
-
To see more details about the metrics in any graph, choose View in metrics from the drop-down menu.
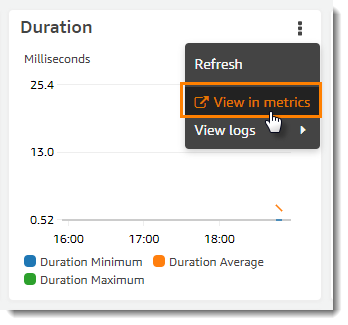
The graph appears in a new tab, with the relevant metrics listed below the graph. You can customize your view of this graph, changing the metrics and resources shown, the statistic, the period, and other factors to get a better understanding of the current situation.
By default, the Lambda console shows a basic dashboard. You can customize this page by adding one or more Amazon CloudWatch dashboards to your application
template with the AWS::CloudWatch::Dashboard
resource type. When your template includes one or more dashboards, the page shows your
dashboards instead of the default dashboard. You can switch between dashboards with the drop-down menu on the top
right of the page. The following example creates a dashboard with a single widget that graphs the number of
invocations of a function named my-function.
Example function dashboard template
Resources:
  MyDashboard:
    Type: AWS::CloudWatch::Dashboard
    Properties:
      DashboardName: my-dashboard
      DashboardBody: |
        {
            "widgets": [
                {
                    "type": "metric",
                    "width": 12,
                    "height": 6,
                    "properties": {
                        "metrics": [
                            [
                                "AWS/Lambda",
                                "Invocations",
                                "FunctionName",
                                "my-function",
                                {
                                    "stat": "Sum",
                                    "label": "MyFunction"
                                }
                            ],
                            [
                                {
                                    "expression": "SUM(METRICS())",
                                    "label": "Total Invocations"
                                }
                            ]
                        ],
                        "region": "us-east-1",
                        "title": "Invocations",
                        "view": "timeSeries",
                        "stacked": false
                    }
                }
            ]
        }
For more information about authoring CloudWatch dashboards and widgets, see Dashboard body structure and syntax in the Amazon CloudWatch API Reference.