Monitor function performance with Amazon CloudWatch Lambda Insights
Amazon CloudWatch Lambda Insights collects and aggregates Lambda function runtime performance metrics and logs for your serverless applications. This page describes how to enable and use Lambda Insights to diagnose issues with your Lambda functions.
Sections
How Lambda Insights monitors serverless applications
CloudWatch Lambda Insights is a monitoring and troubleshooting solution for serverless applications running on Amazon Lambda. The solution collects, aggregates, and summarizes system-level metrics including CPU time, memory, disk and network usage. It also collects, aggregates, and summarizes diagnostic information such as cold starts and Lambda worker shutdowns to help you isolate issues with your Lambda functions and resolve them quickly.
Lambda Insights uses a new CloudWatch Lambda Insights extension, which is provided as a Lambda layer. When you enable this extension on a Lambda function for a supported runtime, it collects system-level metrics and emits a single performance log event for every invocation of that Lambda function. CloudWatch uses embedded metric formatting to extract metrics from the log events. For more information, see Using Amazon Lambda extensions.
The Lambda Insights layer extends the CreateLogStream and PutLogEvents for the /aws/lambda-insights/ log group.
Pricing
When you enable Lambda Insights for your Lambda function,
Lambda Insights reports 8 metrics per function and every function invocation sends about 1KB of log data to CloudWatch.
You only pay for the metrics and logs reported for your function by Lambda Insights.
There are no minimum fees or mandatory service usage policies.
You do not pay for Lambda Insights if the function is not invoked.
For a pricing example, see Amazon CloudWatch pricing
Supported runtimes
You can use Lambda Insights with any of the runtimes that support Lambda extensions.
Enabling Lambda Insights in the Lambda console
You can enable Lambda Insights enhanced monitoring on new and existing Lambda functions. When you enable Lambda Insights on a function in the Lambda console for a supported runtime, Lambda adds the Lambda Insights extension as a layer to your function, and verifies or attempts to attach the CloudWatchLambdaInsightsExecutionRolePolicy
To enable Lambda Insights in the Lambda console
Open the Functions page
of the Lambda console. -
Choose your function.
-
Choose the Configuration tab.
-
On the left menu, choose Monitoring and operations tools.
-
On the Additional monitoring tools pane, choose Edit.
-
Under CloudWatch Lambda Insights, turn on Enhanced monitoring.
-
Choose Save.
Enabling Lambda Insights programmatically
You can also enable Lambda Insights using the Amazon Command Line Interface (Amazon CLI), Amazon Serverless Application Model (SAM) CLI, Amazon CloudFormation, or the Amazon Cloud Development Kit (Amazon CDK). When you enable Lambda Insights programmatically on a function for a supported runtime, CloudWatch attaches the CloudWatchLambdaInsightsExecutionRolePolicy
For more information, see Getting started with Lambda Insights in the Amazon CloudWatch User Guide.
Using the Lambda Insights dashboard
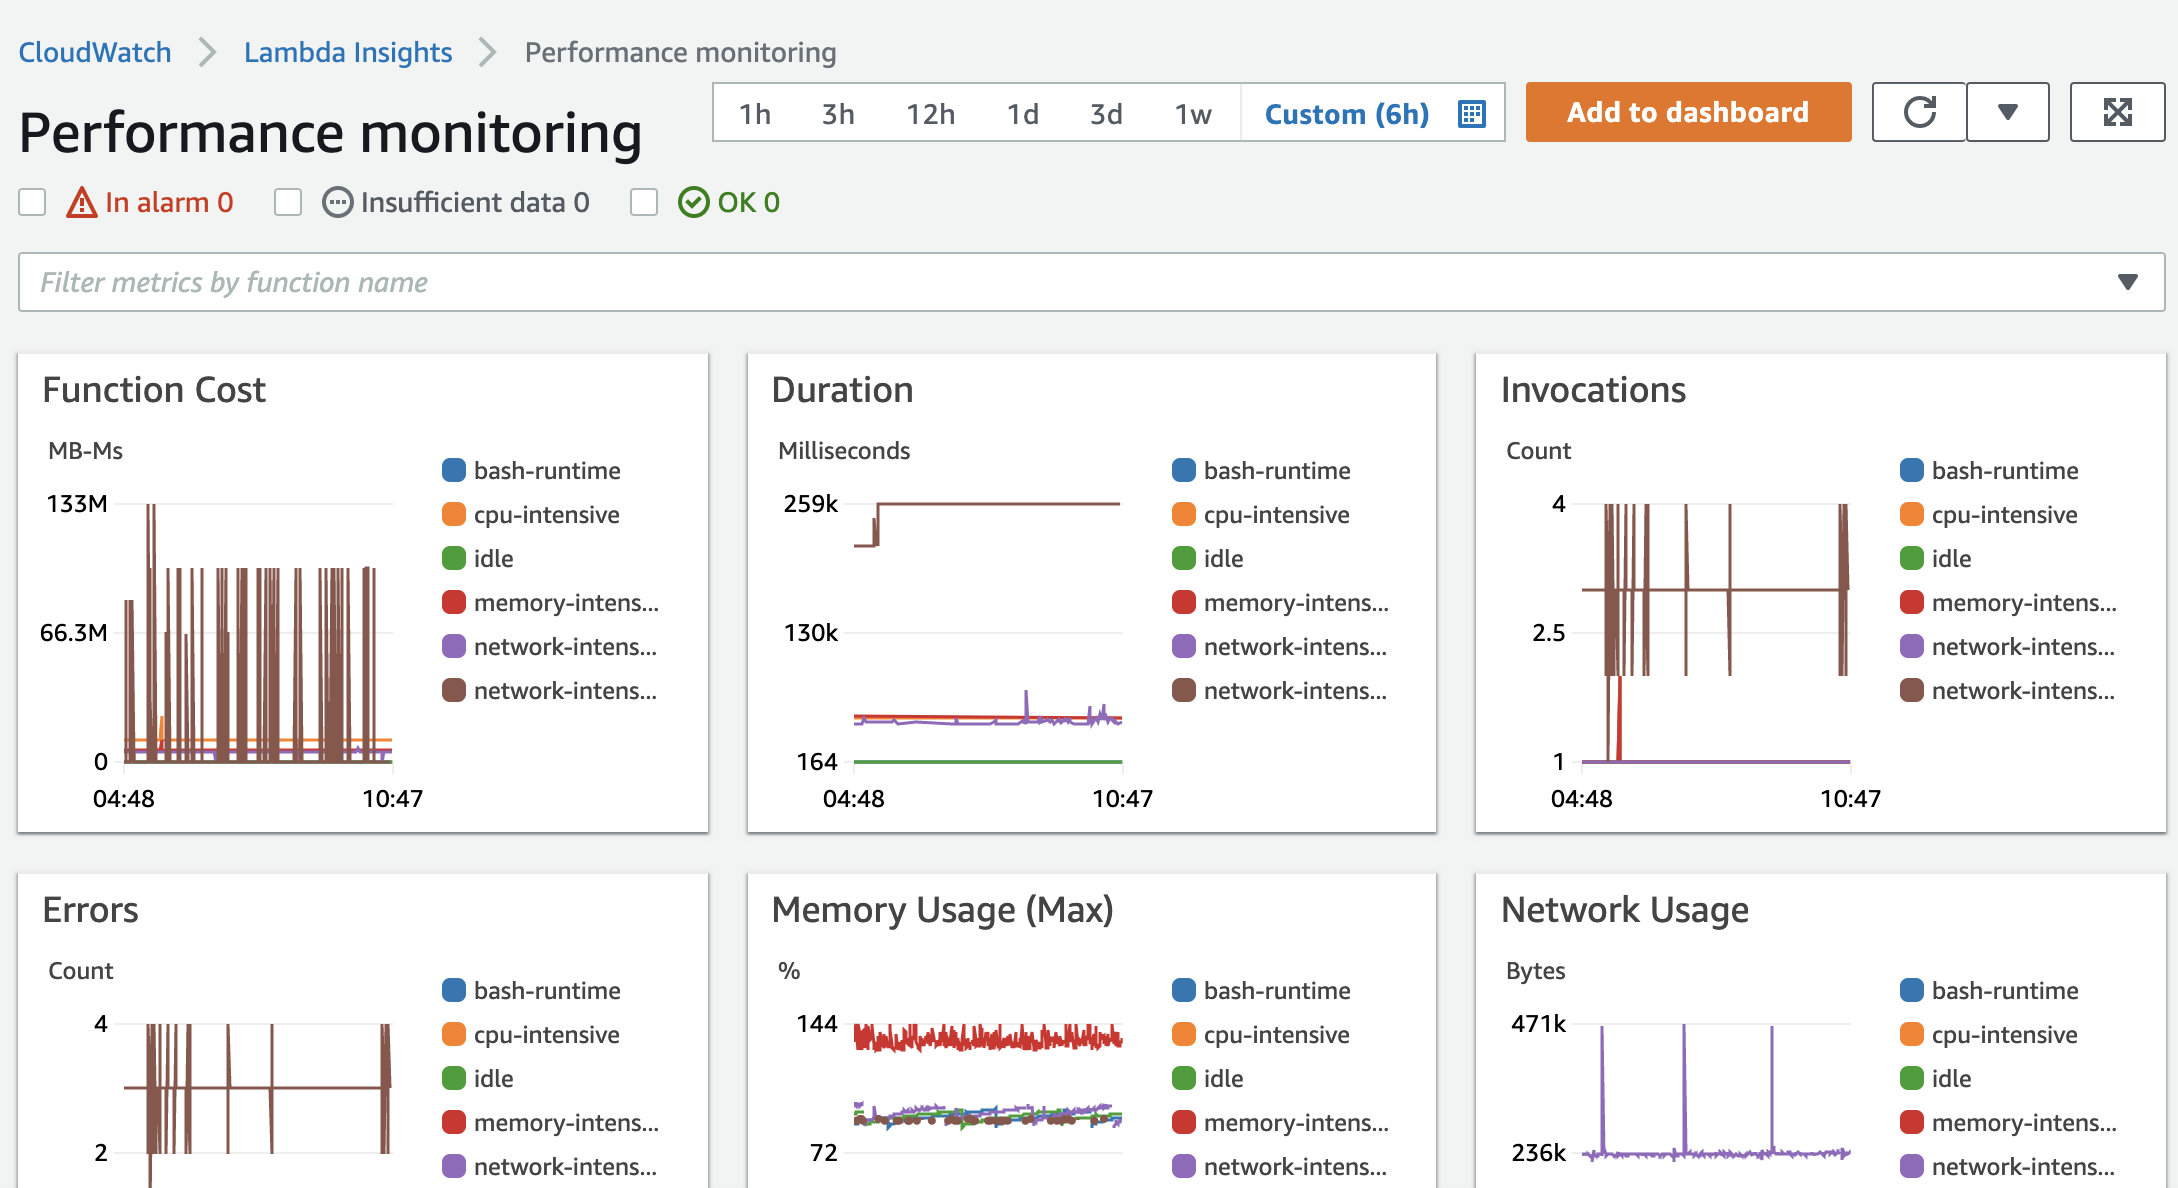
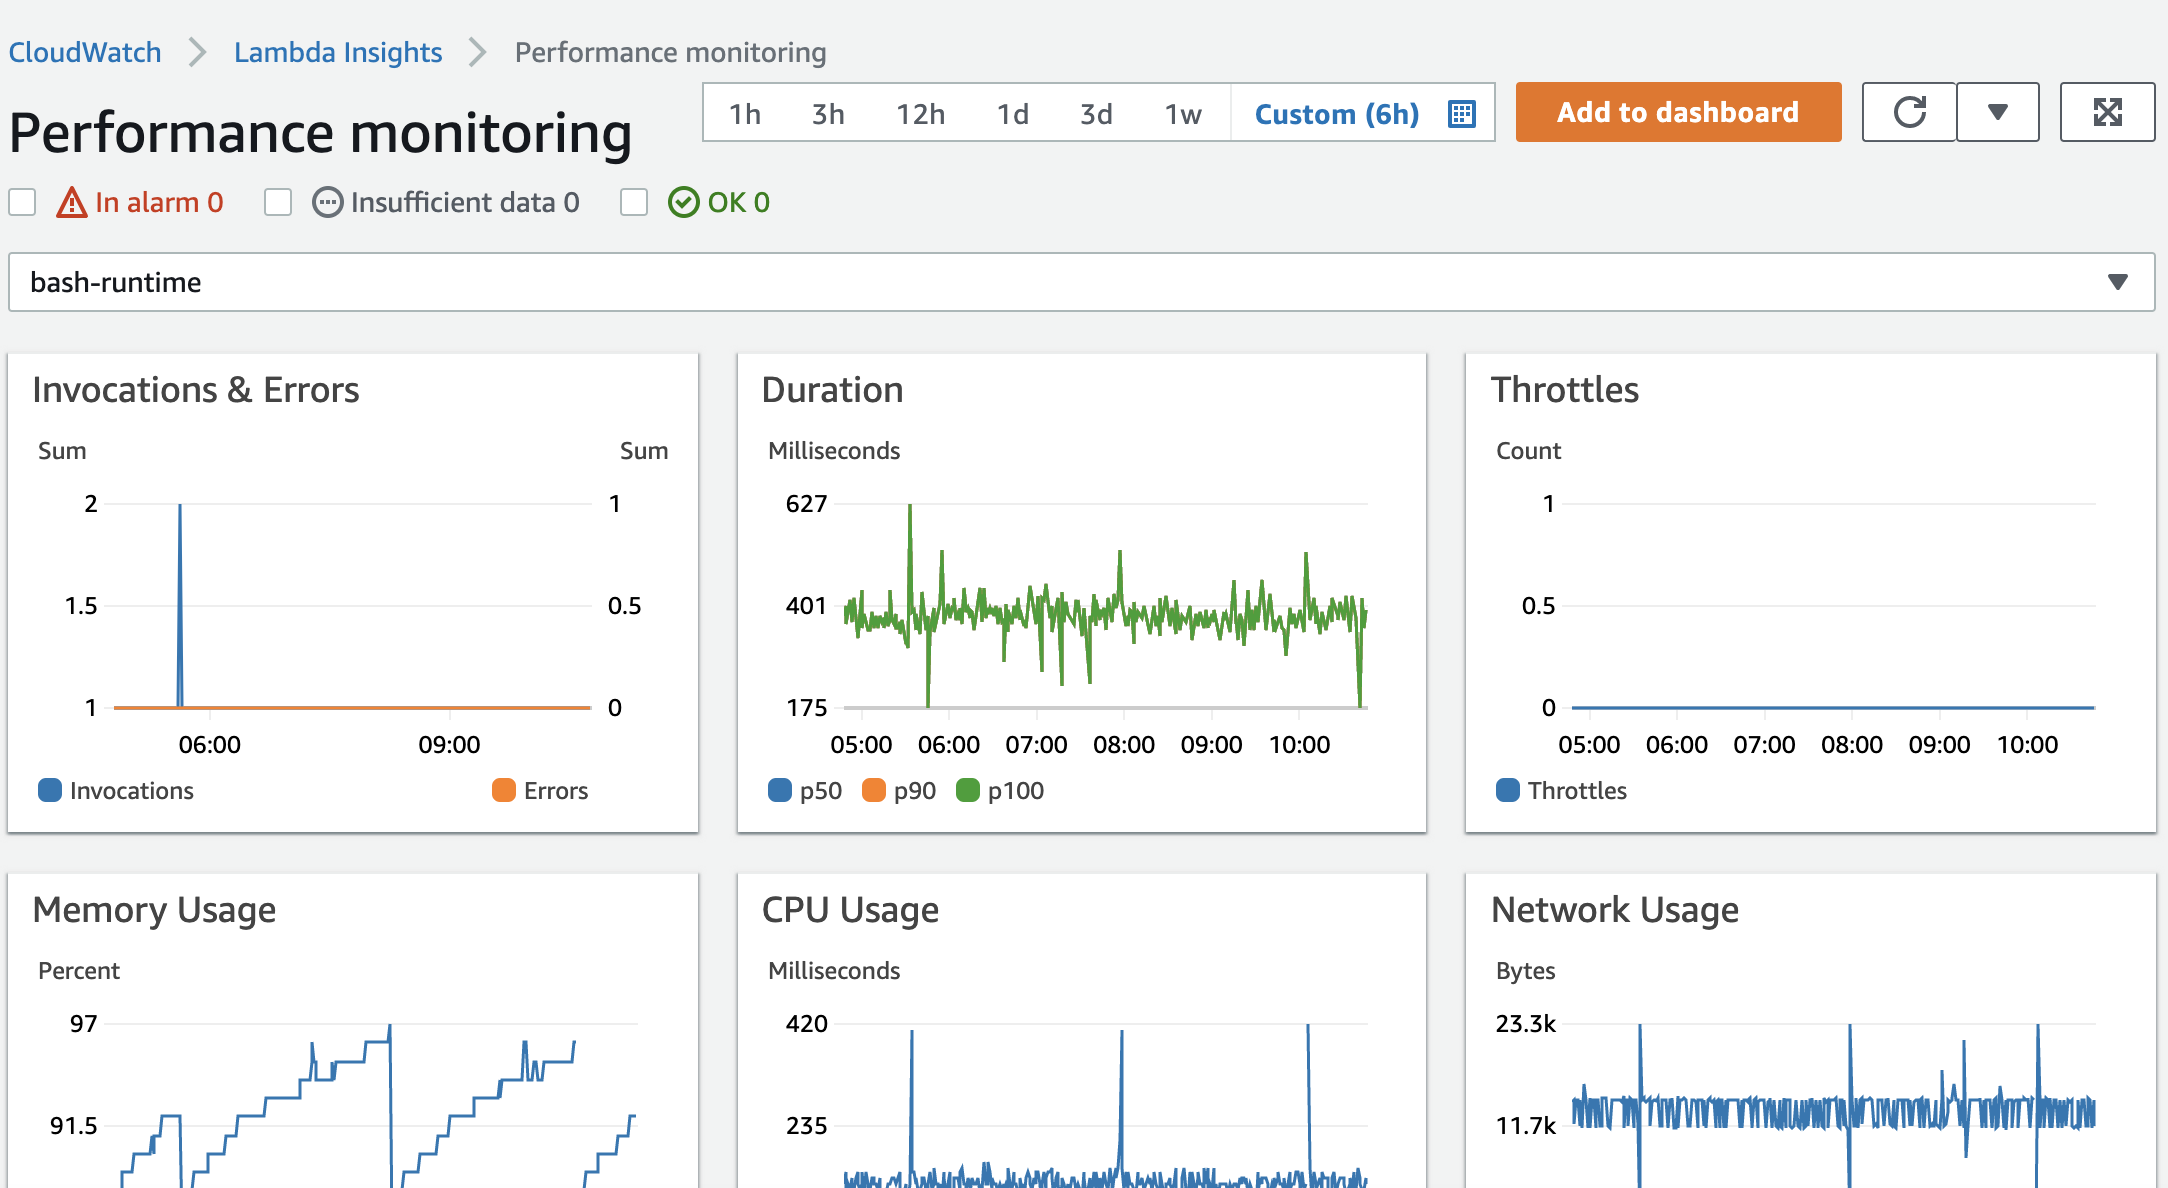
The Lambda Insights dashboard has two views in the CloudWatch console: the multi-function overview and the single-function view. The multi-function overview aggregates the runtime metrics for the Lambda functions in the current Amazon account and Region. The single-function view shows the available runtime metrics for a single Lambda function.
You can use the Lambda Insights dashboard multi-function overview in the CloudWatch console to identify over- and under-utilized Lambda functions. You can use the Lambda Insights dashboard single-function view in the CloudWatch console to troubleshoot individual requests.
To view the runtime metrics for all functions
-
Open the Multi-function
page in the CloudWatch console. -
Choose from the predefined time ranges, or choose a custom time range.
-
(Optional) Choose Add to dashboard to add the widgets to your CloudWatch dashboard.
To view the runtime metrics of a single function
-
Open the Single-function
page in the CloudWatch console. -
Choose from the predefined time ranges, or choose a custom time range.
-
(Optional) Choose Add to dashboard to add the widgets to your CloudWatch dashboard.
For more information, see Creating and working with widgets on CloudWatch dashboards.
Example workflow to detect function anomalies
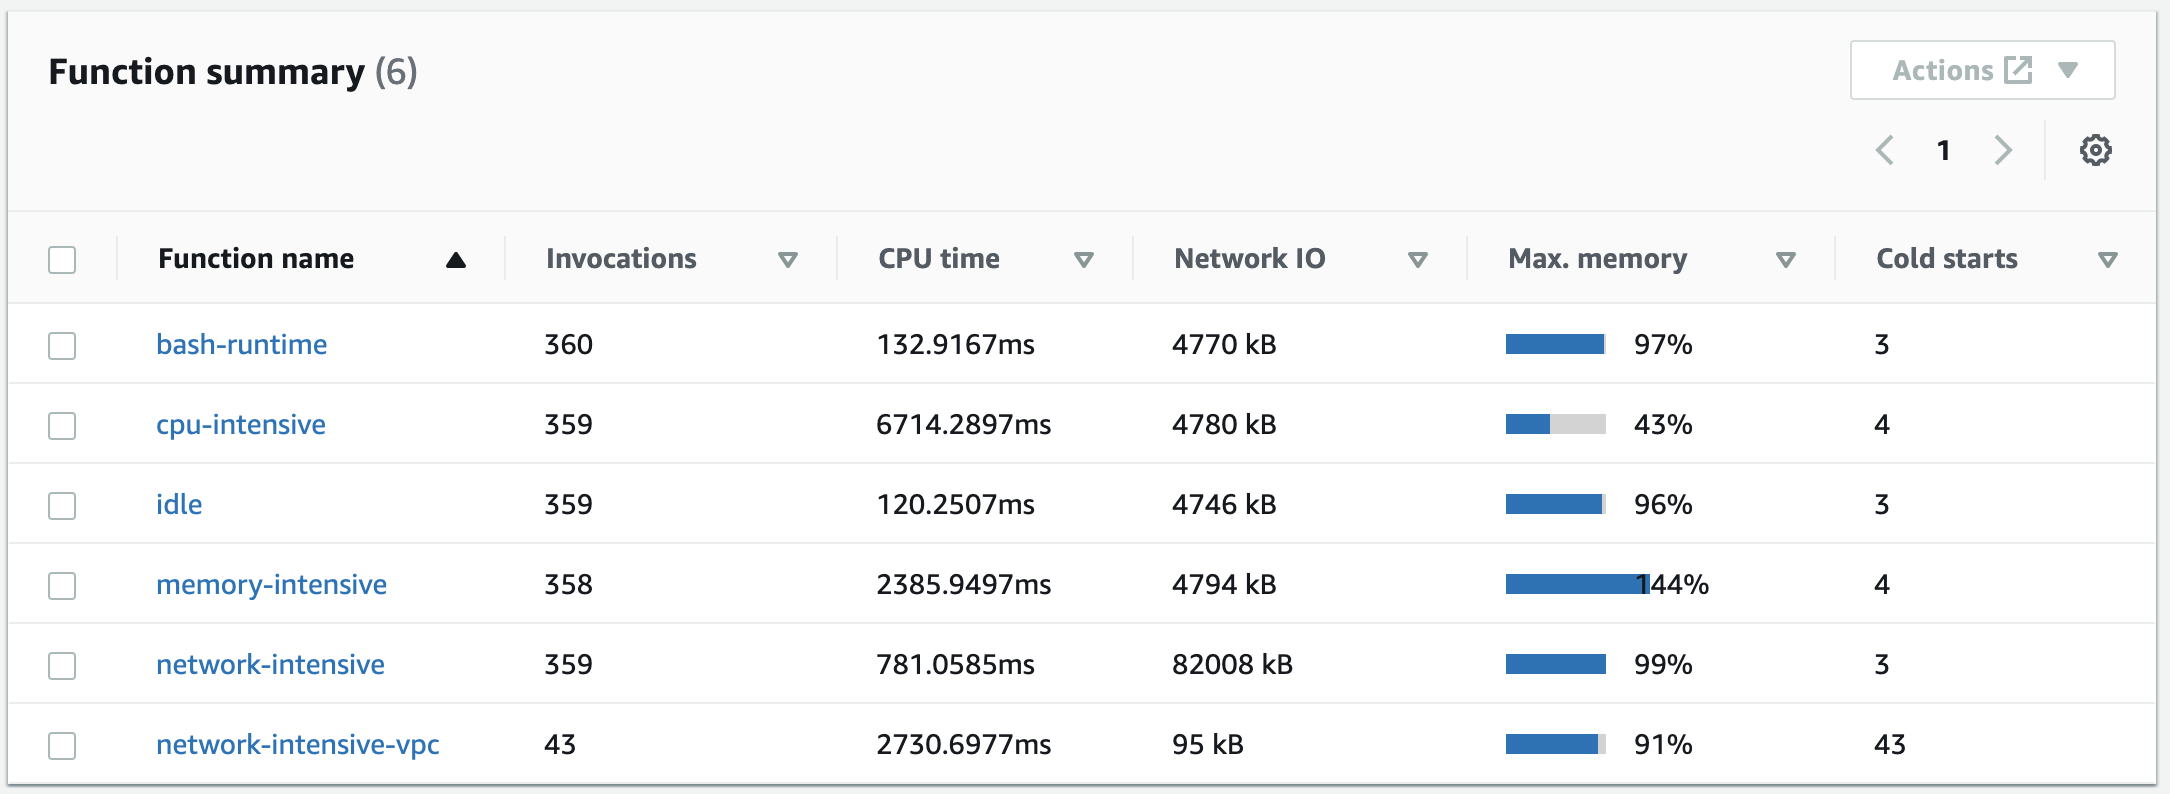
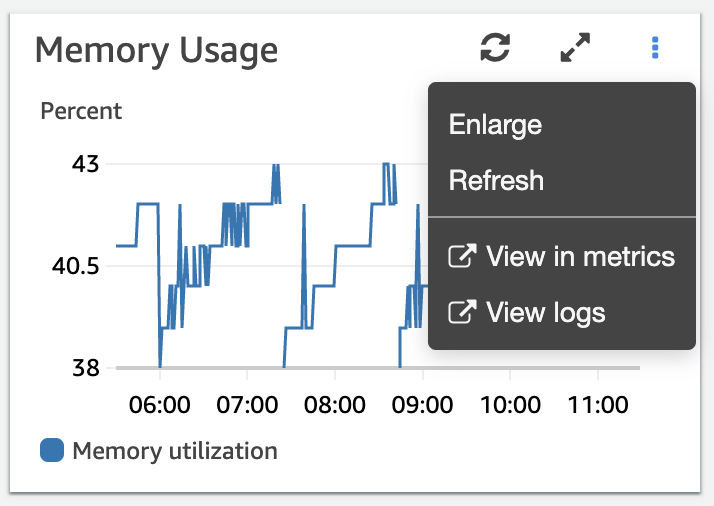
You can use the multi-function overview on the Lambda Insights dashboard to identify and detect compute memory anomalies with your function. For example, if the multi-function overview indicates that a function is using a large amount of memory, you can view detailed memory utilization metrics in the Memory Usage pane. You can then go to the Metrics dashboard to enable anomaly detection or create an alarm.
To enable anomaly detection for a function
-
Open the Multi-function
page in the CloudWatch console. -
Under Function summary, choose your function's name.
The single-function view opens with the function runtime metrics.
-
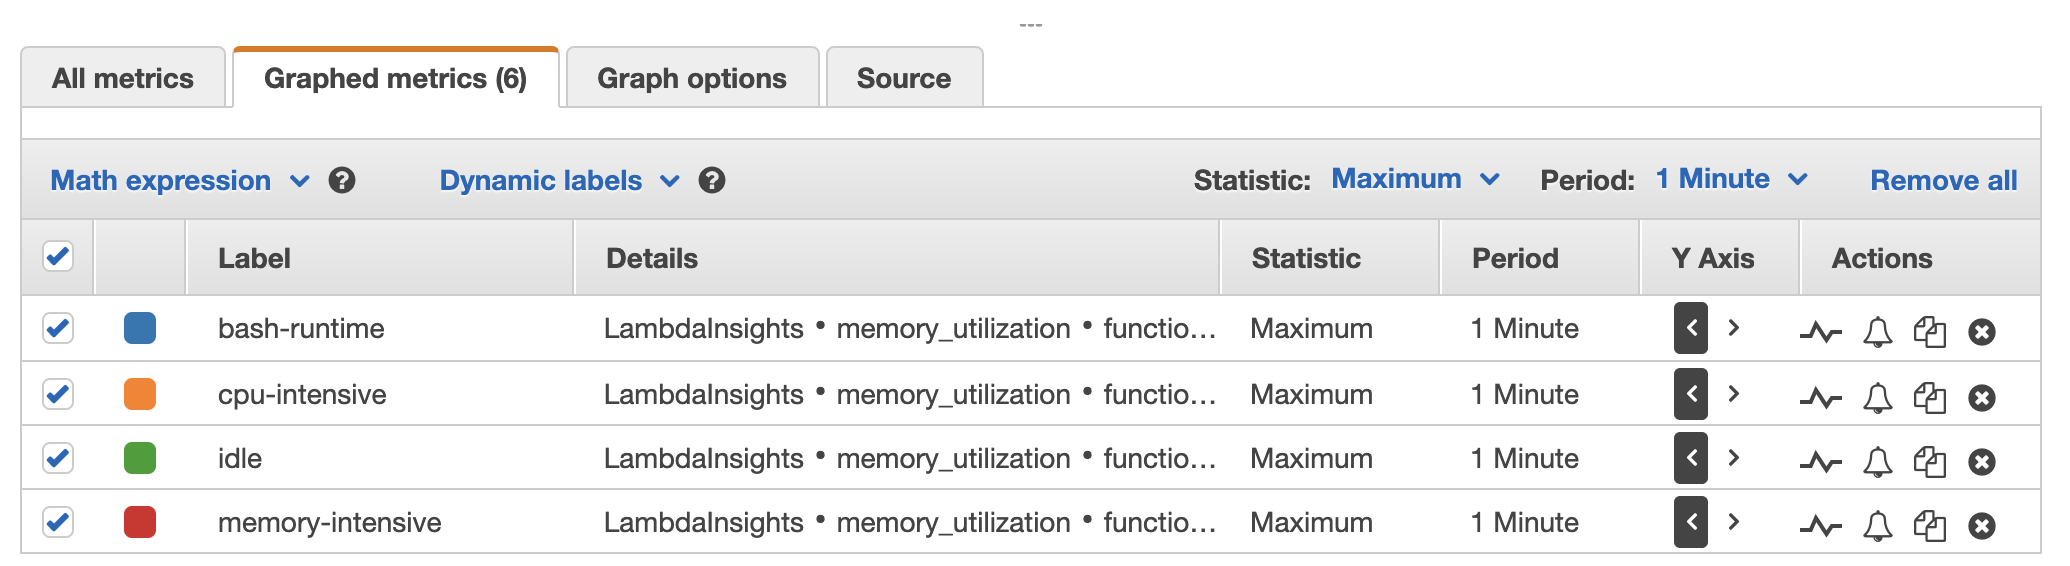
On the Memory Usage pane, choose the three vertical dots, and then choose View in metrics to open the Metrics dashboard.
-
On the Graphed metrics tab, in the Actions column, choose the first icon to enable anomaly detection for the function.
For more information, see Using CloudWatch Anomaly Detection.
Example workflow using queries to troubleshoot a function
You can use the single-function view on the Lambda Insights dashboard to identify the root cause of a spike in function duration. For example, if the multi-function overview indicates a large increase in function duration, you can pause on or choose each function in the Duration pane to determine which function is causing the increase. You can then go to the single-function view and review the Application logs to determine the root cause.
To run queries on a function
-
Open the Multi-function
page in the CloudWatch console. -
In the Duration pane, choose your function to filter the duration metrics.

-
Open the Single-function
page. -
Choose the Filter metrics by function name dropdown list, and then choose your function.
-
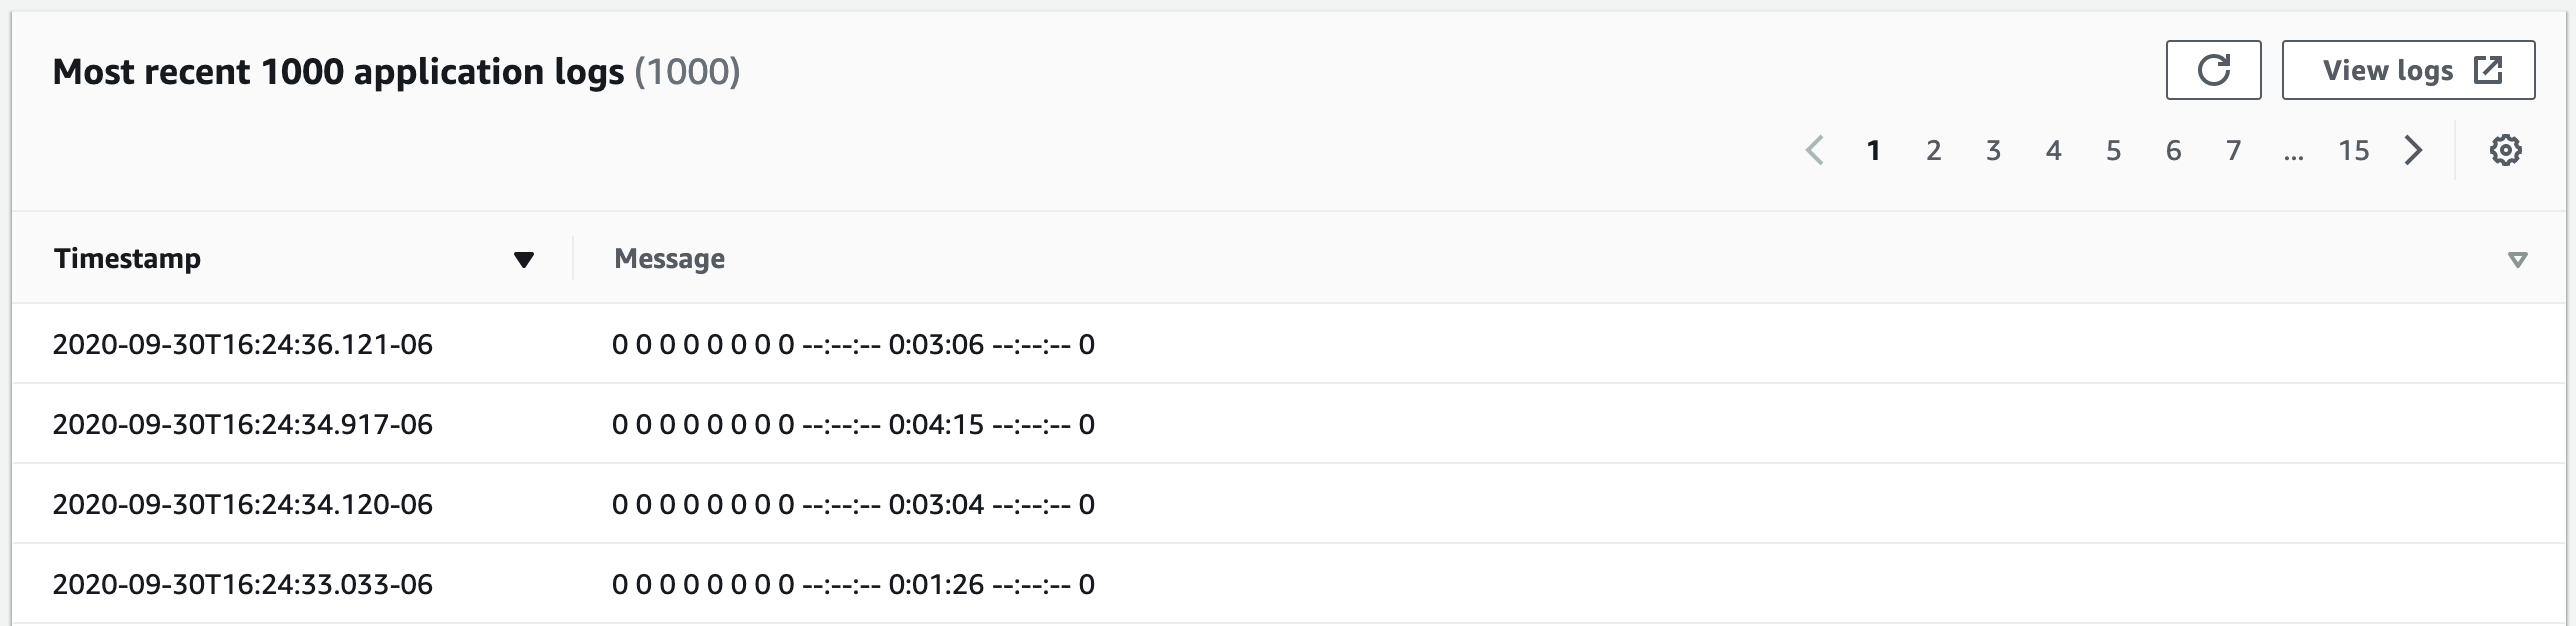
To view the Most recent 1000 application logs, choose the Application logs tab.
-
Review the Timestamp and Message to identify the invocation request that you want to troubleshoot.
-
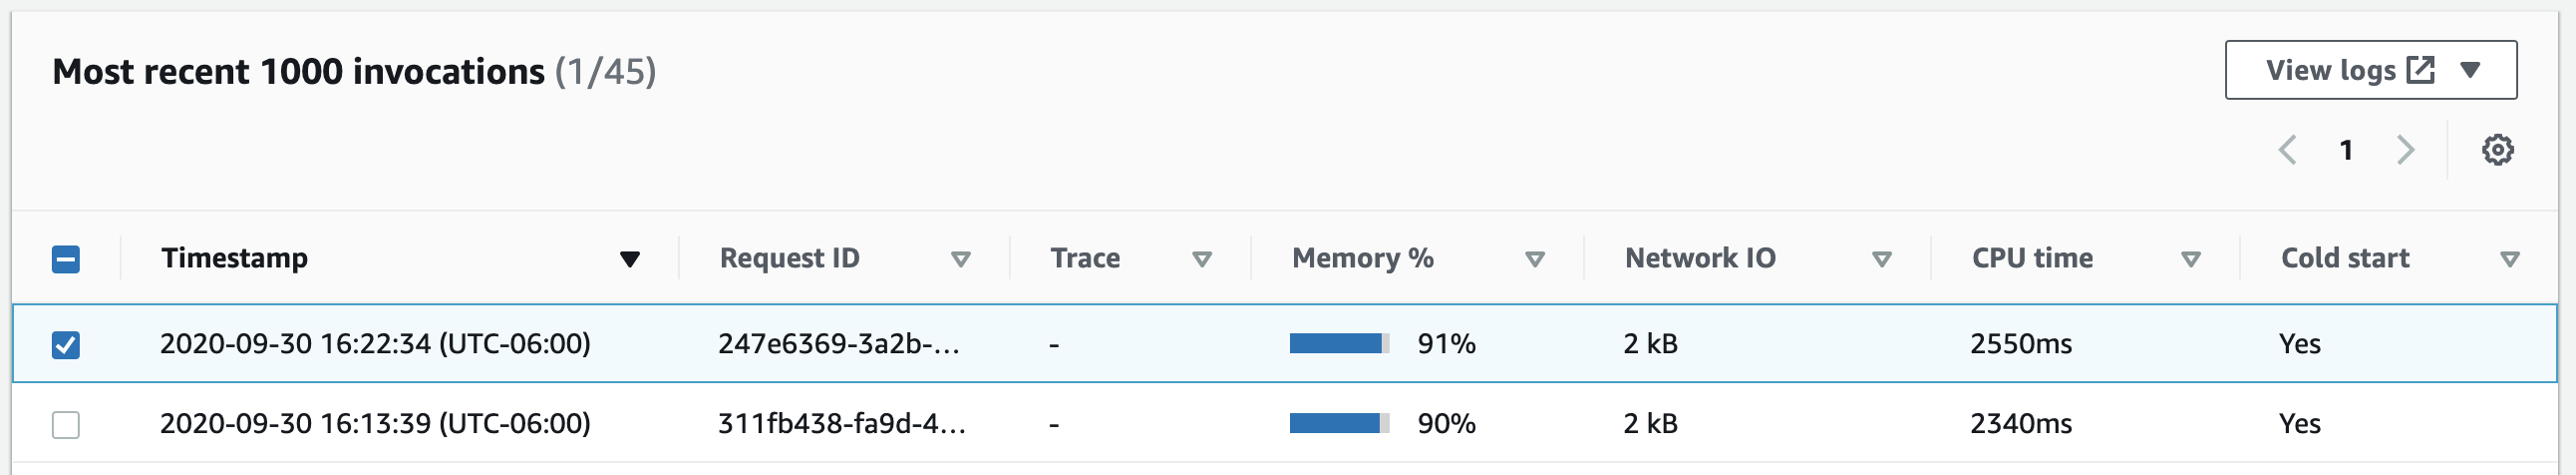
To show the Most recent 1000 invocations, choose the Invocations tab.
-
Select the Timestamp or Message for the invocation request that you want to troubleshoot.
-
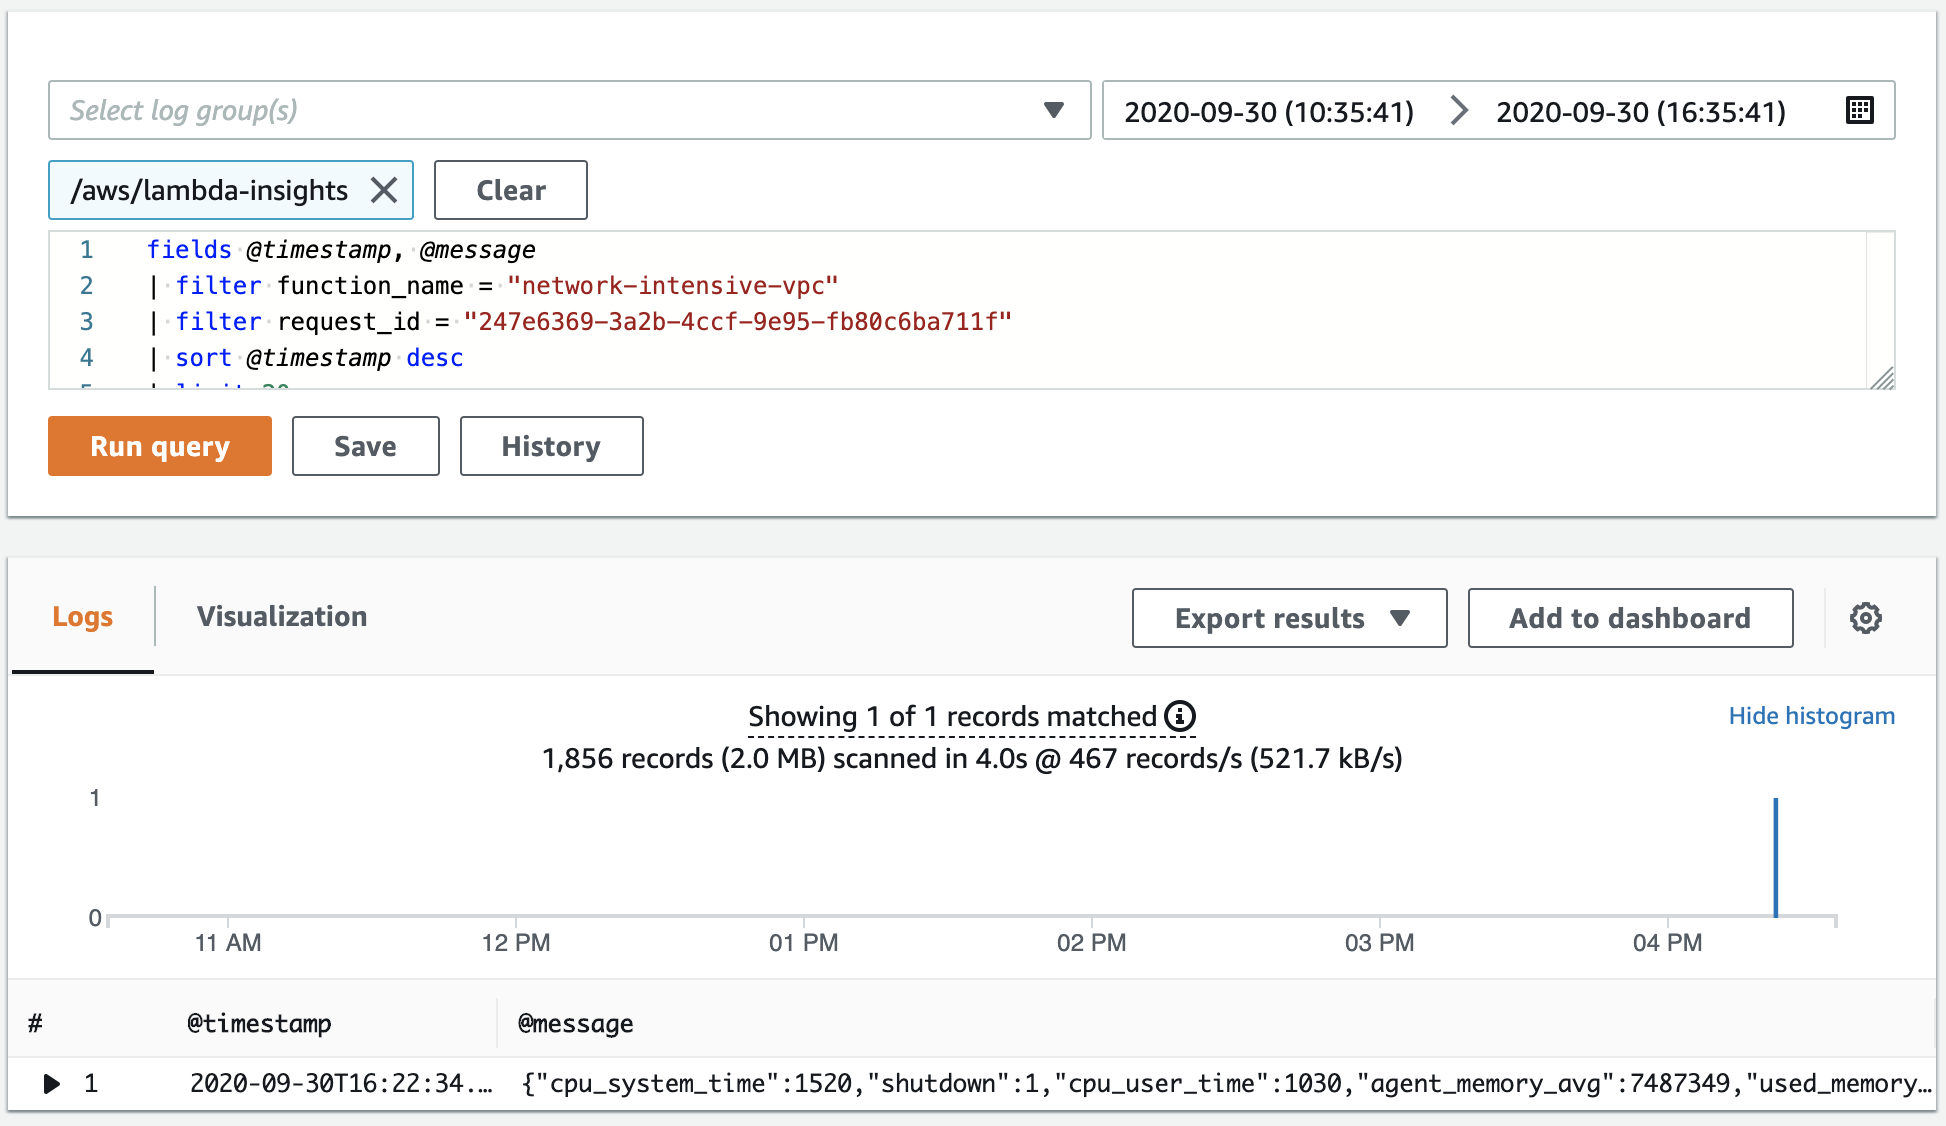
Choose the View logs dropdown list, and then choose View performance logs.
An autogenerated query for your function opens in the Logs Insights dashboard.
-
Choose Run query to generate a Logs message for the invocation request.
What's next?
-
Learn how to create a CloudWatch Logs dashboard in Create a Dashboard in the Amazon CloudWatch User Guide.
-
Learn how to add queries to a CloudWatch Logs dashboard in Add Query to Dashboard or Export Query Results in the Amazon CloudWatch User Guide.