Security Analytics for Amazon OpenSearch Service
Security Analytics is an OpenSearch solution that provides visibility into your organization's infrastructure, monitors for anomalous activity, detects potential security threats in real time, and trigger alerts to pre-configured destinations. You can monitor for malicious activity from your security event logs by continuously evaluating security rules and reviewing auto-generated security findings. In addition, Security Analytics can generate automated alerts and send them to a specified notification channel, such as Slack or email.
You can use the Security Analytics plugin to detect common threats out-of-the-box and generate critical security insights from your existing security event logs, such as firewall logs, windows logs, and authentication audit logs. To use Security Analytics, your domain must be running OpenSearch version 2.5 or later.
Note
This documentation provides a brief overview of Security Analytics for Amazon OpenSearch Service. It
defines key concepts and provides steps to configure permissions. For comprehensive
documentation, including a setup guide, an API reference, and a reference of all
available settings, see Security
Analytics
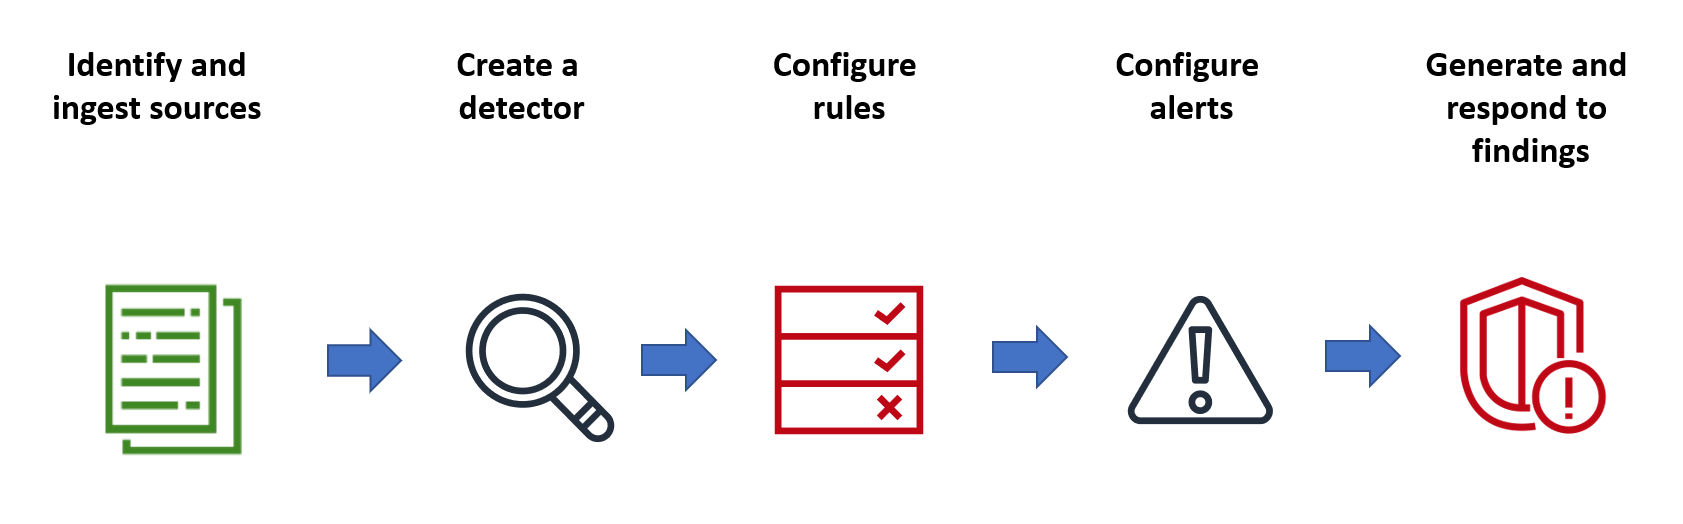
Security analytics components and concepts
A number of tools and features provide the foundation to the operation of Security Analytics. The major components that compose the plugin include detectors, log types, rules, findings, and alerts.
Log types
OpenSearch supports several types of logs and provides out-of-the-box mappings for each type. You specify the log type and configure a time interval when you create a detector, and from there Security Analytics automatically activates a relevant set of rules that run at that interval.
Detectors
Detectors identify a range of cybersecurity threats for a log type across your
data indexes. You configure your detector to use both custom rules and pre-packaged
Sigma rules that evaluate events occurring in the system. The detector then
generates security findings from these events. For more information about detectors,
see Creating detectors
Rules
Threat detection rules define the conditions that detectors apply to ingested log
data to identify a security event. Security Analytics supports importing, creating,
and customizing rules to meet your requirements, and also provides prepackaged,
open-source Sigma rules to detect common threats from your logs. Security Analytics
maps many rules to an ever-growing knowledge base of adversary tactics and
techniques maintained by the MITRE ATT&CK organization. You can
use both OpenSearch Dashboards or the APIs to create and use rules. For more information
about rules, see Working
with rules
Findings
When a detector matches a rule with a log event, it generates a finding. Each
finding includes a unique combination of select rules, a log type, and a rule
severity. Findings don’t necessarily point to imminent threats within the system,
but they always isolate an event of interest. For more information about findings,
see Working with findings
Alerts
When you create a detector, you can specify one or more conditions that trigger an
alert. An alert is a notification sent to a preferred channel, such as Slack or
email. You set the alert to be triggered when the detector matches one or multiple
rules, and can customize the notification message. For more information about
alerts, see Working with alerts
Exploring Security Analytics
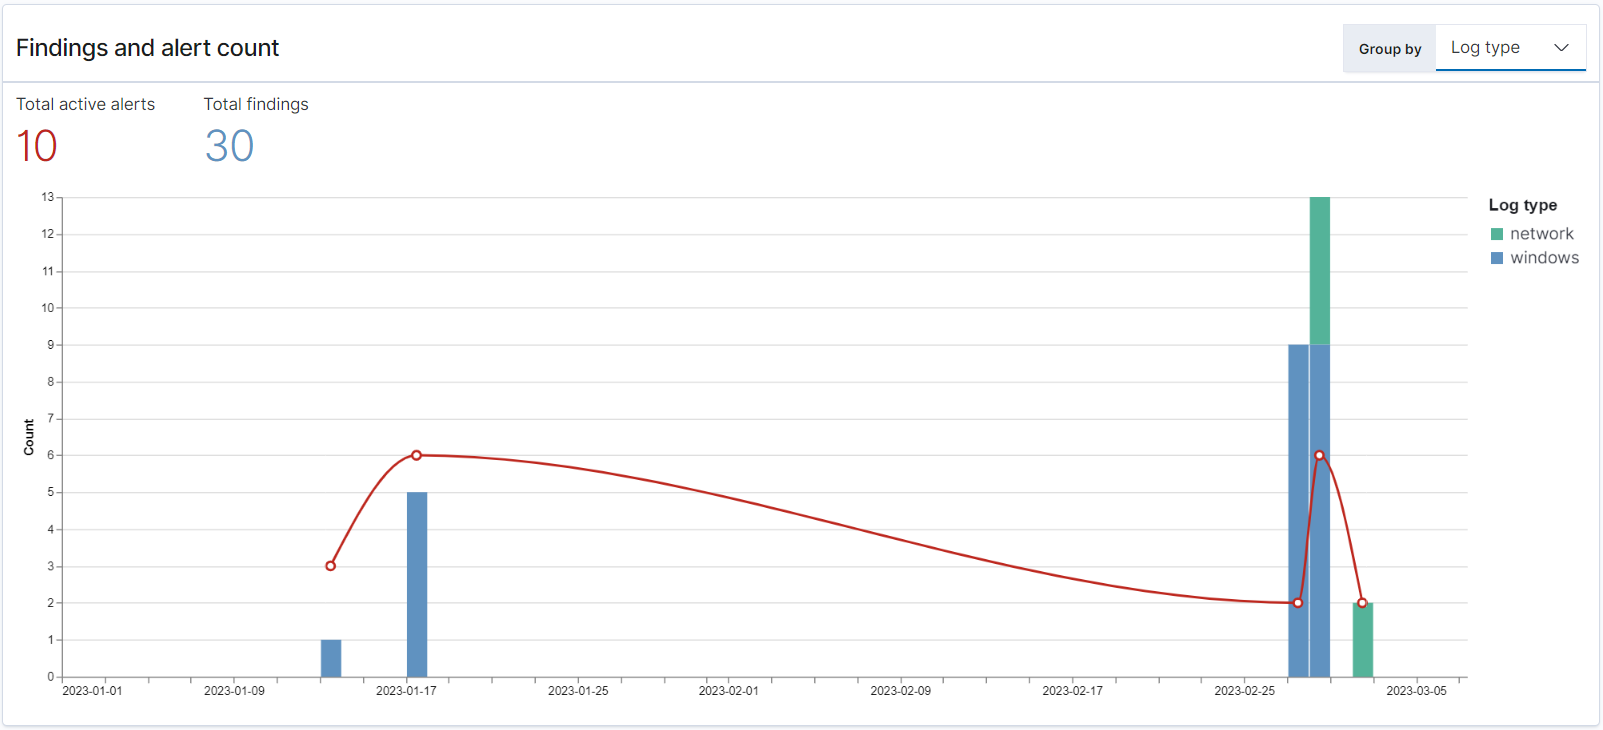
You can use OpenSearch Dashboards to visualize and gain insight into your Security Analytics plugin. The Overview view provides information such as findings and alert counts, recent findings and alerts, frequent detection rules, and a list of your detectors. You can see a summary view comprised of multiple visualizations. The following chart, for example, shows the findings and alerts trend for various log types over a given period of time.
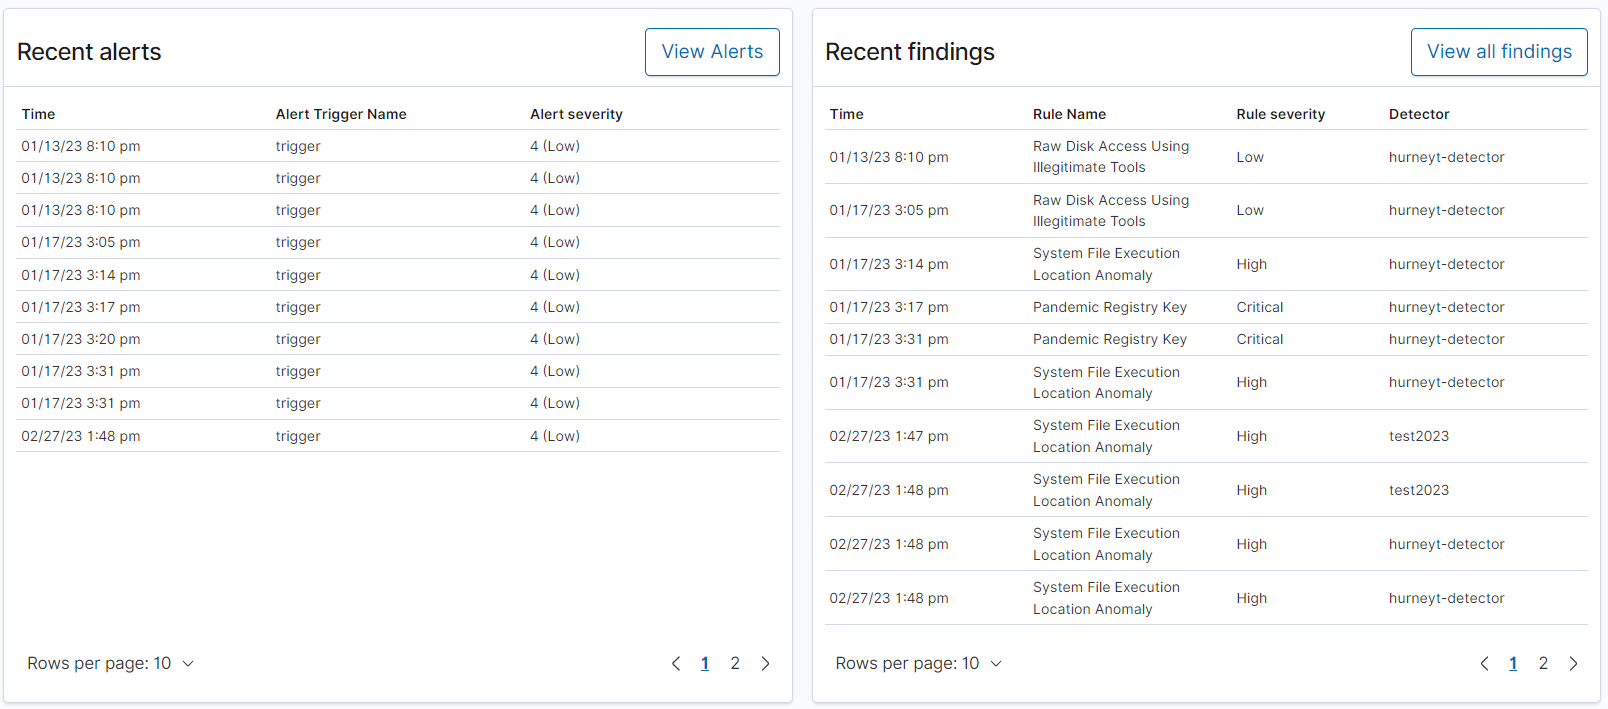
Further down the page, you can review your most recent findings and alerts.
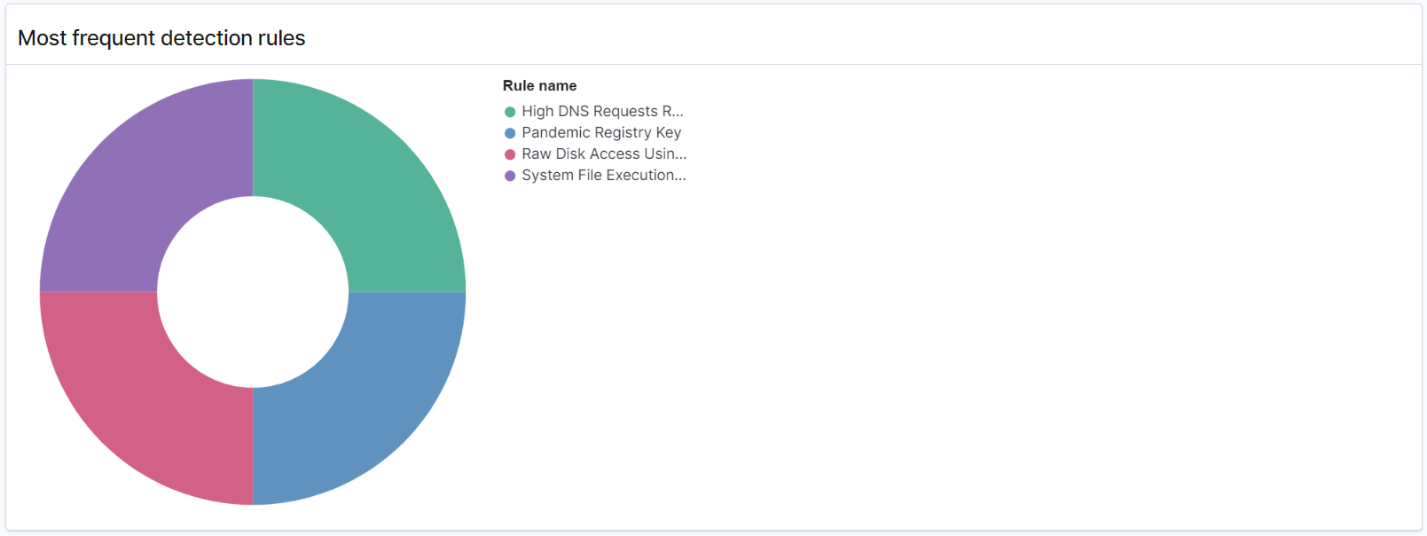
Additionally, you can see a distribution of the most frequently triggered rules across all the active detectors. This can help you detect and investigate different types of malicious activities across log types.
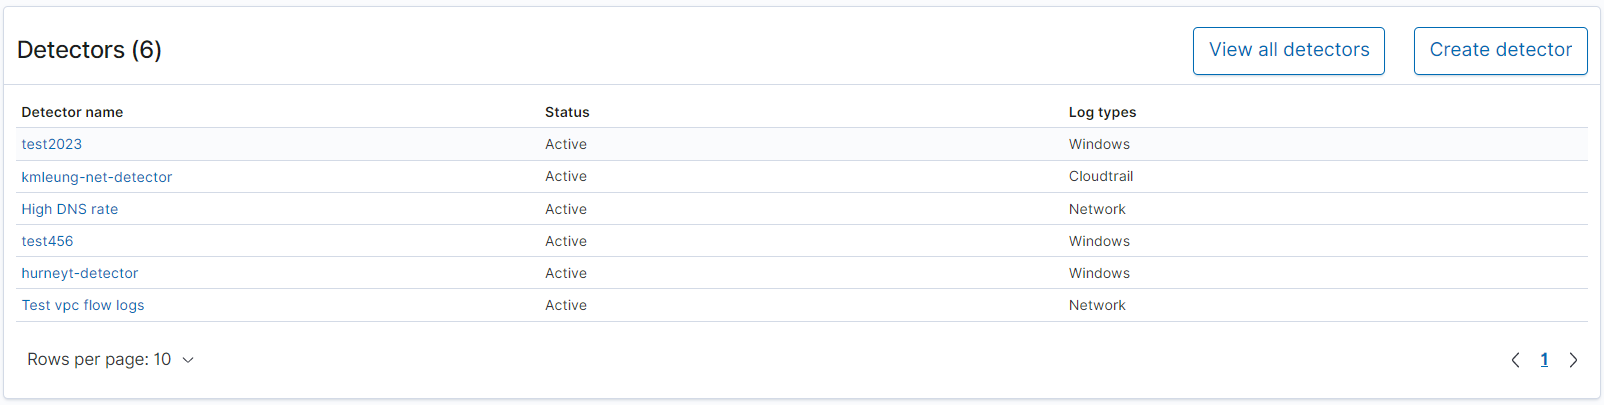
Finally, you can view the status of configured detectors. From this panel, you can also navigate to the create detector workflow.
To configure your Security Analytics setup, create rules with the Rules page and use those rules to write detectors in the Detectors page. For a more focused view of your Security Analytics results, you can use the Findings and Alerts pages.
Configure permissions
If you enable Security Analytics on a preexisting OpenSearch Service domain, the
security_analytics_manager role might not be defined on the domain.
Non-admin users must be mapped to this role in order to manage warm indexes on domains
using fine-grained access control. To manually create the
security_analytics_manager role, perform the following steps:
-
In OpenSearch Dashboards, go to Security and choose Permissions.
-
Choose Create action group and configure the following groups:
Group name Permissions security_analytics_full_access-
cluster:admin/opensearch/securityanalytics/alerts/* -
cluster:admin/opensearch/securityanalytics/detector/* -
cluster:admin/opensearch/securityanalytics/findings/* -
cluster:admin/opensearch/securityanalytics/mapping/* -
cluster:admin/opensearch/securityanalytics/rule/*
security_analytics_read_access-
cluster:admin/opensearch/securityanalytics/alerts/get -
cluster:admin/opensearch/securityanalytics/detector/get -
cluster:admin/opensearch/securityanalytics/detector/search -
cluster:admin/opensearch/securityanalytics/findings/get -
cluster:admin/opensearch/securityanalytics/mapping/get -
cluster:admin/opensearch/securityanalytics/mapping/view/get -
cluster:admin/opensearch/securityanalytics/rule/get -
cluster:admin/opensearch/securityanalytics/rule/search
-
-
Choose Roles and Create role.
-
Name the role security_analytics_manager.
-
For Cluster permissions, select
security_analytics_full_accessandsecurity_analytics_read_access. -
For Index, type
*. -
For Index permissions, select
indices:admin/mapping/putandindices:admin/mappings/get. -
Choose Create.
-
After you create the role, map it to any user or backend role that will manage Security Analytics indexes.
Troubleshooting
No such index error
If you have no detectors and you open the Security Analytics dashboard, you might
see a notification on the bottom right that says [index_not_found_exception]
no such index [.opensearch-sap-detectors-config]. You can disregard this
notification, which disappears within a few seconds and won't appear again once you
create a detector.