Amazon CloudWatch dashboard
Starting with Amazon ParallelCluster version 2.10.0, an Amazon CloudWatch dashboard is created when the cluster is created.
This makes it easier to monitor the nodes in your cluster, and to view the logs stored in Amazon CloudWatch Logs. The name of the
dashboard is parallelcluster-.
ClusterName-RegionClusterName is the name of your cluster and Region is the
Amazon Web Services Region of the cluster. You can access the dashboard in the console, or by opening
https://console.amazonaws.cn/cloudwatch/home?region=.Region#dashboards:name=parallelcluster-ClusterName
The following image shows an example CloudWatch dashboard for a cluster.
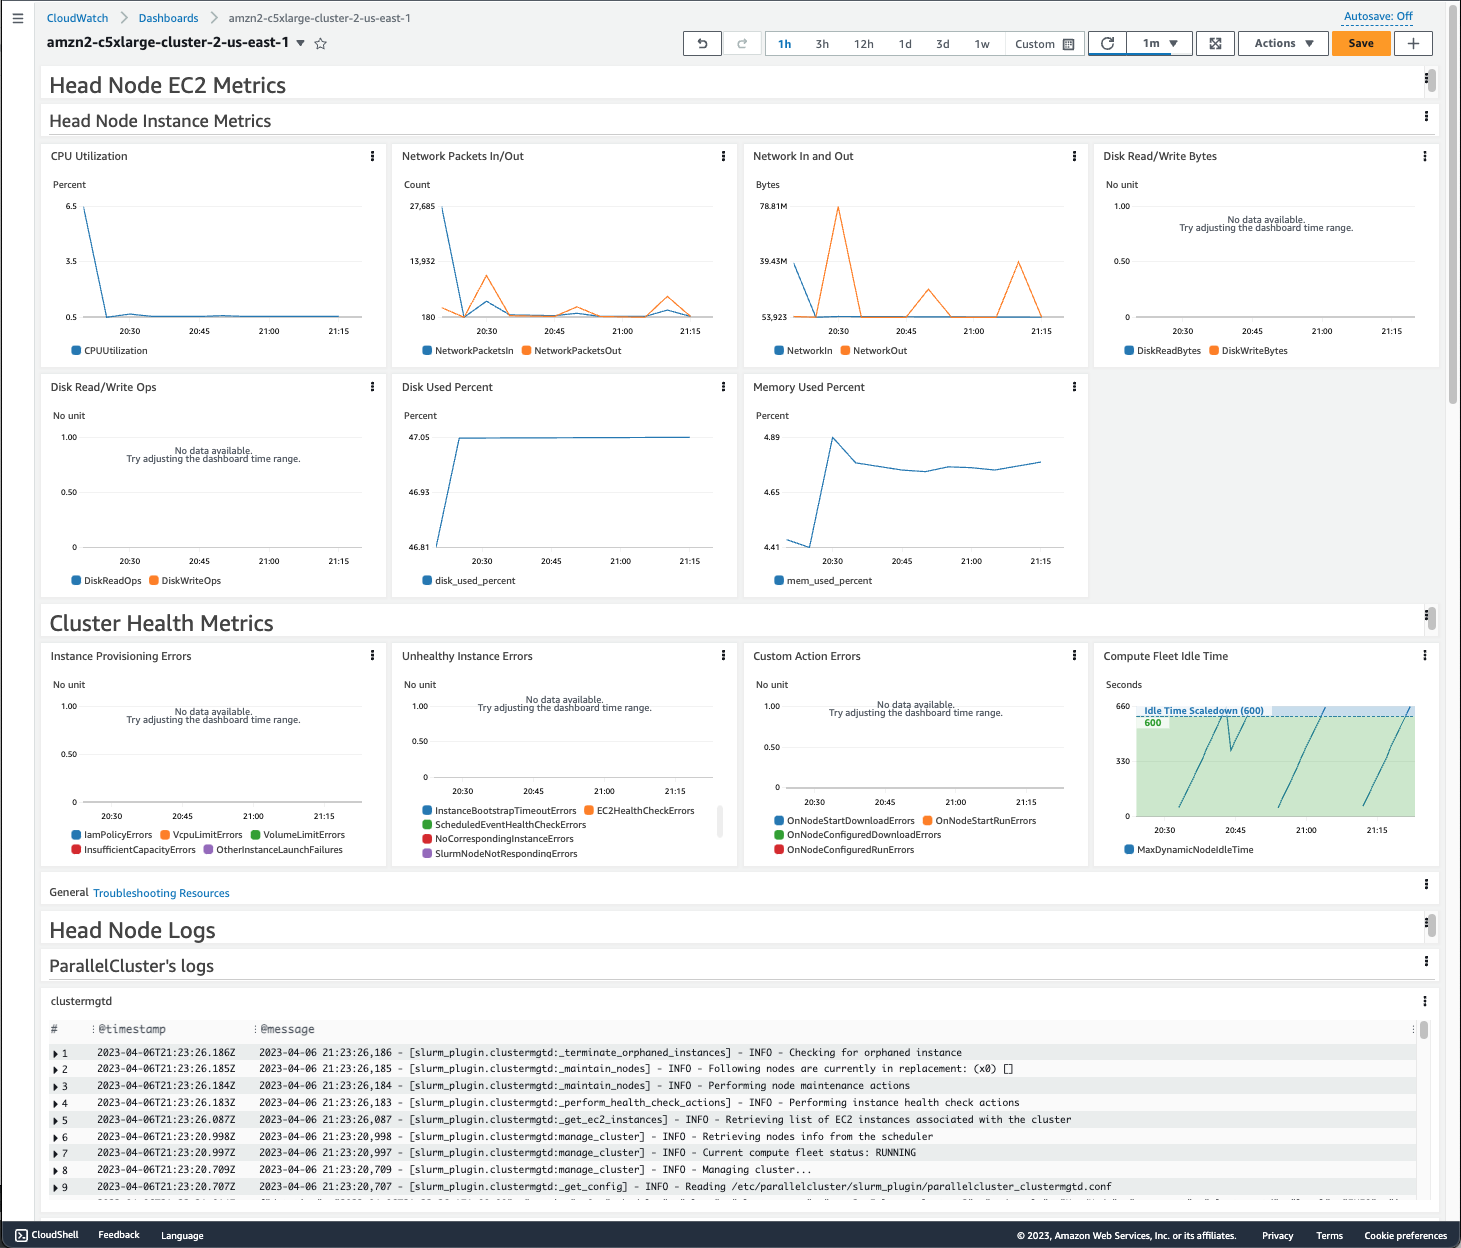
The first section of the dashboard displays graphs of the Head Node EC2 metrics. If your cluster has shared storage, the next section shows shared storage metrics. The final section lists Head Node Logs grouped by ParallelCluster's logs, Scheduler's logs, NICE DCV integration logs, and System's logs.
For more information about Amazon CloudWatch dashboards, see Using Amazon CloudWatch dashboards in the Amazon CloudWatch User Guide.
If you don’t want to create the Amazon CloudWatch dashboard, you must complete these steps: First, add a [dashboard] section to your configuration file, and then add the name
of that section as the value of the dashboard_settings setting in
your [cluster] section. In your [dashboard] section, set enable = false.
For example, if your [dashboard] section is named
myDashboard and your [cluster] section is named
myCluster, your changes resemble this.
[cluster MyCluster]
dashboard_settings = MyDashboard
...

[dashboard MyDashboard]
enable = false