countOver
The countOver function calculates the count of a dimension or measure
partitioned by a list of dimensions.
Syntax
The brackets are required. To see which arguments are optional, see the following descriptions.
countOver (measure or dimension field,[ partition_field, ... ],calculation level)
Arguments
- measure or dimension field
-
The measure or dimension that you want to do the calculation for, for example
sum({Sales Amt}). Use an aggregation if the calculation level is set toNULLorPOST_AGG_FILTER. Don't use an aggregation if the calculation level is set toPRE_FILTERorPRE_AGG. - partition field
-
(Optional) One or more dimensions that you want to partition by, separated by commas.
Each field in the list is enclosed in {} (curly braces), if it is more than one word. The entire list is enclosed in [ ] (square brackets).
- calculation level
-
(Optional) Specifies the calculation level to use:
-
PRE_FILTER– Prefilter calculations are computed before the dataset filters. -
PRE_AGG– Preaggregate calculations are computed before applying aggregations and top and bottom N filters to the visuals. -
POST_AGG_FILTER– (Default) Table calculations are computed when the visuals display.
This value defaults to
POST_AGG_FILTERwhen blank. For more information, see Using level-aware calculations in Quick. -
Example
The following example gets the count of Sales partitioned over
City and State.
countOver
(
  Sales,
  [City, State]
)
The following example gets the count of {County} partitioned over
City and State.
countOver
(
  {County},
  [City, State]
)
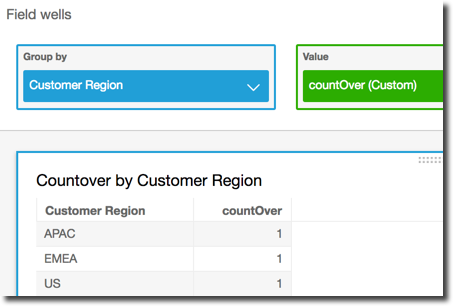
The following example shows the count of Billed Amount over
Customer Region. The fields in the table calculation are in the
field wells of the visual.
countOver
(
  sum({Billed Amount}),
  [{Customer Region}]
)
The following screenshot shows the results of the example. Because there are no other fields involved, the count is one for each region.
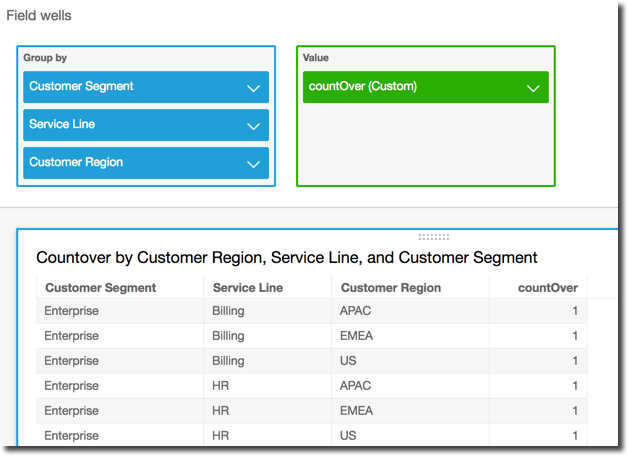
If you add additional fields, the count changes. In the following screenshot, we
add Customer Segment and Service Line. Each of those
fields contains three unique values. With 3 segments, 3 service lines, and 3
regions, the calculated field shows 9.
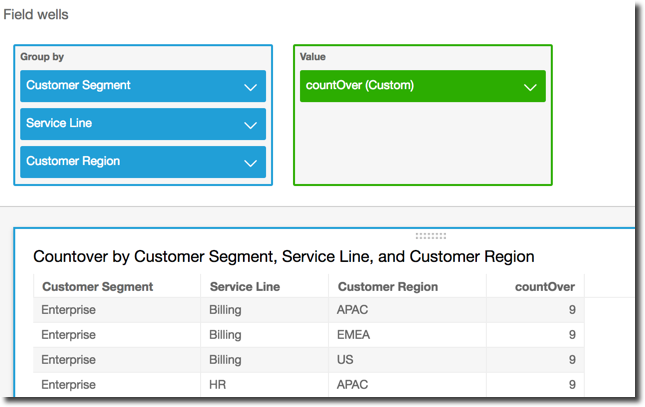
If you add the two additional fields to the partitioning fields in the calculated
field, countOver( sum({Billed Amount}), [{Customer Region}, {Customer
Segment}, {Service Line}], then the count is again 1 for each row.