percentileDisc (percentile)
The percentileDisc function calculates the percentile based on the actual
numbers in measure. It uses the grouping and sorting that are applied in
the field wells. The percentile function is an alias of
percentileDisc.
Use this function to answer the following question: Which actual data points are
present in this percentile? To return the nearest percentile value that is present in
your dataset, use percentileDisc. To return an exact percentile value that
might not be present in your dataset, use percentileCont instead.
Syntax
percentileDisc(expression,percentile, [group-by level])
Arguments
- measure
-
Specifies a numeric value to use to compute the percentile. The argument must be a measure or metric. Nulls are ignored in the calculation.
- percentile
-
The percentile value can be any numeric constant 0–100. A percentile value of 50 computes the median value of the measure.
- group-by level
-
(Optional) Specifies the level to group the aggregation by. The level added can be any dimension or dimensions independent of the dimensions added to the visual.
The argument must be a dimension field. The group-by level must be enclosed in square brackets
[ ]. For more information, see Level-aware calculation - aggregate (LAC-A) functions.
Returns
The result of the function is a number.
Usage notes
percentileDisc is an inverse distribution function that assumes a
discrete distribution model. It takes a percentile value and a sort specification
and returns an element from the given set.
For a given percentile value P, percentileDisc uses the
sorted values in the visual and returns the value with the smallest cumulative
distribution value that is greater than or equal to P.
Examples of percentileDisc
The following examples help explain how percentileDisc works.
Example Comparing median, percentileDisc, and
percentileCont
The following example shows the median for a dimension (category) by using the
percentileCont, and percentileDisc, and
median functions. The median value is the same as the
percentileCont value. percentileCont interpolates a value, which
might or might not be in the data set. However, because
percentileDisc always displays the closest value that exists in
the dataset, the two results might not match. The last column in this example
shows the difference between the two values. The code for each calculated field
is as follows:
-
50%Cont = percentileCont(example, 50 ) -
median = median(example) -
50%Disc = percentileDisc(example, 50 ) -
Cont-Disc = percentileCont(example, 50 ) − percentileDisc(example, 50 ) -
example = left((To make a simpler example, we used this expression to shorten the names of categories down to their first letter.)category, 1 )
 example     median       50%Cont      50%Disc      Cont-Disc
 -------- ----------- ------------ -------------- ------------
 A          22.48          22.48          22.24          0.24
 B          20.96          20.96          20.95          0.01
 C          24.92          24.92          24.92          0
 D          24.935         24.935         24.92          0.015
 E          14.48          14.48          13.99          0.49
Example 100th percentile as maximum
The following example shows a variety of percentileDisc values
for the example field. The calculated fields n%Disc are defined as
percentileDisc( {. The values in each column are actual
numbers that come from the dataset. example} ,n)
 example     50%Disc      75%Disc        99%Disc      100%Disc
 -------- ----------- ------------ -------------- ------------
 A            20.97        73.98         699.99       6783.02
 B            42.19        88.84         820.08       6783.02
 C            30.52        90.48         733.44       6783.02
 D            41.38        85.99         901.29       6783.0
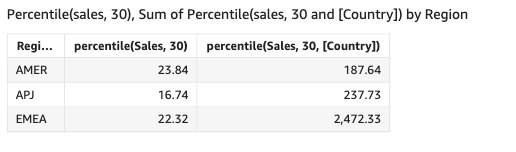
You can also specify at what level to group the computation using one or more dimensions in the view or in your dataset. This is called a LAC-A function. For more information about LAC-A functions, see Level-aware calculation - aggregate (LAC-A) functions. The following example calculates the 30th percentile based on a continuous distribution of the numbers at the Country level, but not across other dimensions (Region) in the visual.
percentile({Sales}, 30, [Country])