Amazon Redshift will no longer support the creation of new Python UDFs starting Patch 198.
Existing Python UDFs will continue to function until June 30, 2026. For more information, see the
blog post
Using the SVL_QUERY_SUMMARY view
To analyze query summary information by stream using SVL_QUERY_SUMMARY, do the following:
-
Run the following query to determine your query ID:
select query, elapsed, substring
from svl_qlog
order by query
desc limit 5;
Examine the truncated query text in the
substringfield to determine whichqueryvalue represents your query. If you have run the query more than once, use thequeryvalue from the row with the lowerelapsedvalue. That is the row for the compiled version. If you have been running many queries, you can raise the value used by the LIMIT clause used to make sure that your query is included. -
Select rows from SVL_QUERY_SUMMARY for your query. Order the results by stream, segment, and step:
select * from svl_query_summary where query = MyQueryID order by stm, seg, step;The following is an example result.

-
Map the steps to the operations in the query plan using the information in Mapping the query plan to the query summary. They should have approximately the same values for rows and bytes (rows * width from the query plan). If they don’t, see Table statistics missing or out of date for recommended solutions.
-
See if the
is_diskbasedfield has a value oft(true) for any step. Hashes, aggregates, and sorts are the operators that are likely to write data to disk if the system doesn't have enough memory allocated for query processing.If
is_diskbasedis true, see Insufficient memory allocated to the query for recommended solutions. -
Review the
labelfield values and see if there is an AGG-DIST-AGG sequence anywhere in the steps. Its presence indicates two-step aggregation, which is expensive. To fix this, change the GROUP BY clause to use the distribution key (the first key, if there are multiple ones). -
Review the
maxtimevalue for each segment (it is the same across all steps in the segment). Identify the segment with the highestmaxtimevalue and review the steps in this segment for the following operators.Note
A high
maxtimevalue doesn't necessarily indicate a problem with the segment. Despite a high value, the segment might not have taken a long time to process. All segments in a stream start getting timed in unison. However, some downstream segments might not be able to run until they get data from upstream ones. This effect might make them seem to have taken a long time because theirmaxtimevalue includes both their waiting time and their processing time.-
BCAST or DIST: In these cases, the high
maxtimevalue might be the result of redistributing a large number of rows. For recommended solutions, see Suboptimal data distribution. -
HJOIN (hash join): If the step in question has a very high value in the
rowsfield compared to therowsvalue in the final RETURN step in the query, see Hash join for recommended solutions. -
SCAN/SORT: Look for a SCAN, SORT, SCAN, MERGE sequence of steps just before a join step. This pattern indicates that unsorted data is being scanned, sorted, and then merged with the sorted area of the table.
See if the rows value for the SCAN step has a very high value compared to the rows value in the final RETURN step in the query. This pattern indicates that the execution engine is scanning rows that are later discarded, which is inefficient. For recommended solutions, see Insufficiently restrictive predicate.
If the
maxtimevalue for the SCAN step is high, see Suboptimal WHERE clause for recommended solutions.If the
rowsvalue for the SORT step is not zero, see Unsorted or missorted rows for recommended solutions.
-
-
Review the
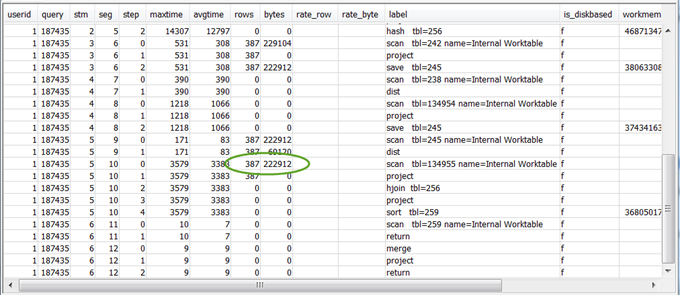
rowsandbytesvalues for the 5–10 steps that precede the final RETURN step to get an idea of the amount of data that is returned to the client. This process can be a bit of an art.For example, in the following sample query summary, the third PROJECT step provides a
rowsvalue, but not abytesvalue. By looking through the preceding steps for one with the samerowsvalue, you find the SCAN step that provides both rows and bytes information.The following is a sample result.

If you are returning an unusually large volume of data, see Very large result set for recommended solutions.
-
See if the
bytesvalue is high relative to therowsvalue for any step, in comparison to other steps. This pattern can indicate that you are selecting a lot of columns. For recommended solutions, see Large SELECT list.