Amazon Redshift will no longer support the creation of new Python UDFs starting Patch 198.
Existing Python UDFs will continue to function until June 30, 2026. For more information, see the
blog post
Analyzing query execution
You can analyze the execution details of a query to understand how it performed and identify potential areas for optimization. Analyzing a query provides insights into the query plan, including the steps involved, the time taken by each step, and the amount of data processed. Common use cases include troubleshooting slow-running queries, optimizing data distribution strategies, and identifying opportunities for query rewriting or indexing.
To analyze a query
-
Sign in to the Amazon Web Services Management Console and open the Amazon Redshift console at https://console.amazonaws.cn/redshiftv2/
. -
On the navigation menu, choose Queries and loads to display the list of queries for your account. You might need to change settings on this page to find your query.
-
Choose the Query identifier in the list to display Query details.
The Query details page includes Query details and Query plan tabs with metrics about the query.
Note
You can also navigate to the Query details page from a Cluster details page, Query history tab when you drill down into a query in a Query runtime graph.
The Query details page contains the following sections:
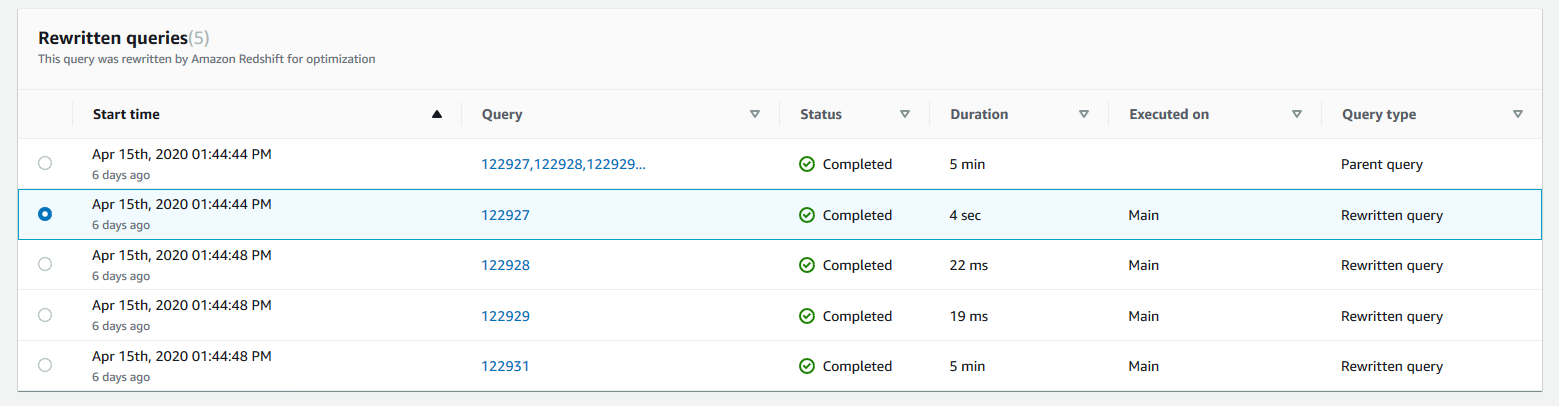
-
A list of Rewritten queries, as shown in the following screenshot.
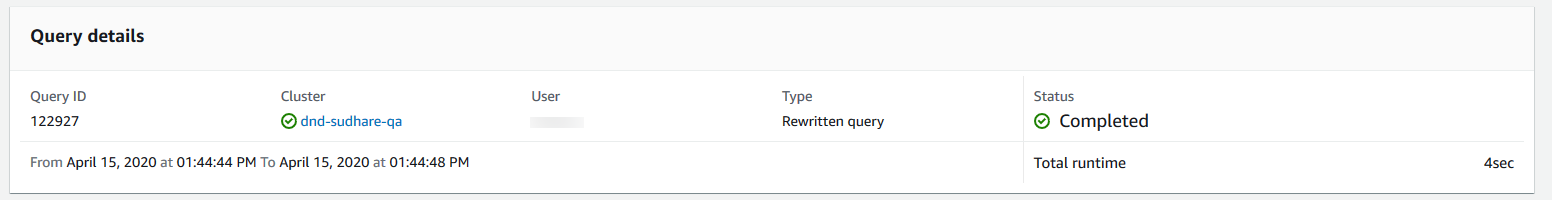
-
A Query details section, as shown in the following screenshot.
-
A Query details tab that contains the SQL that was run and Execution details about the run.
-
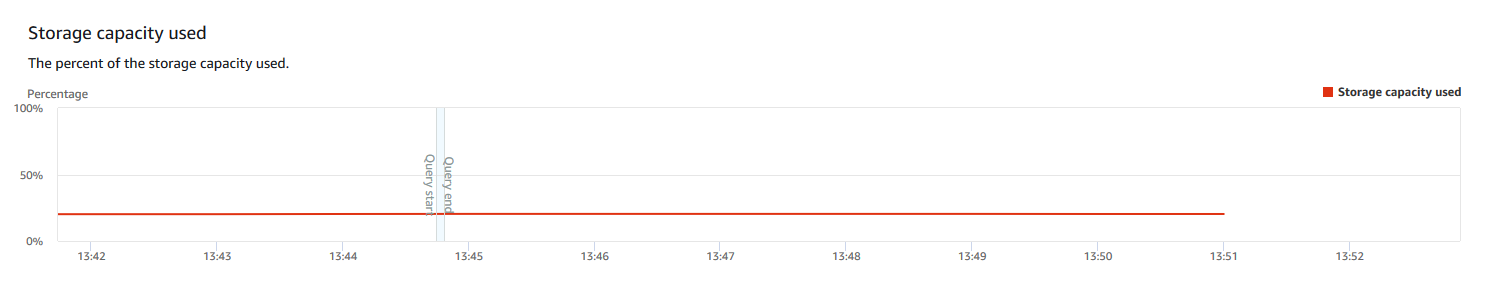
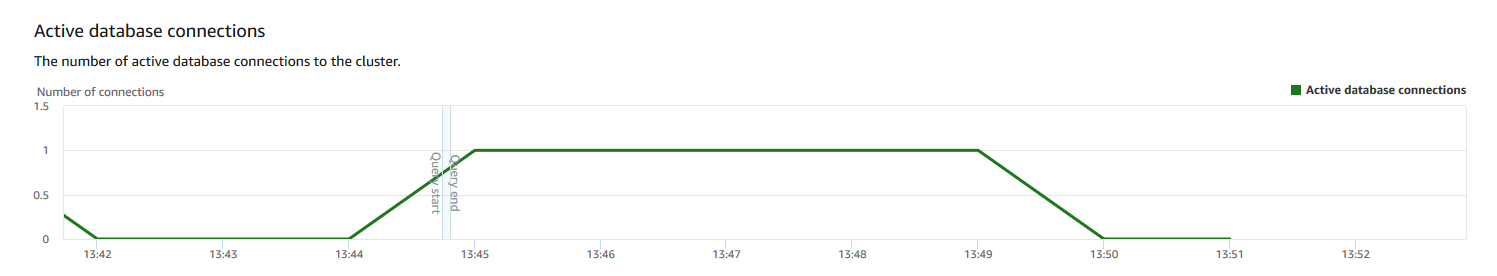
A Query plan tab that contains the Query plan steps and other information about the query plan. This table also contains graphs about the cluster when the query ran.
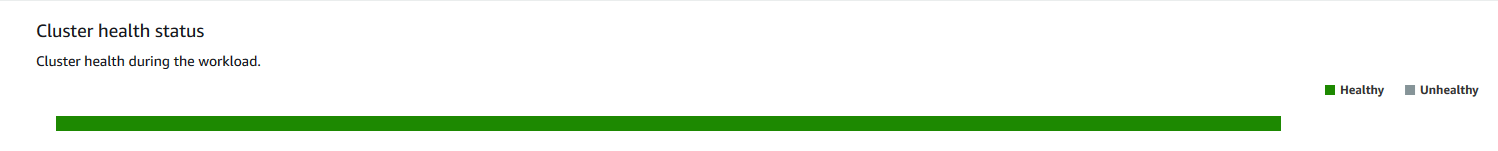
-
Cluster health status
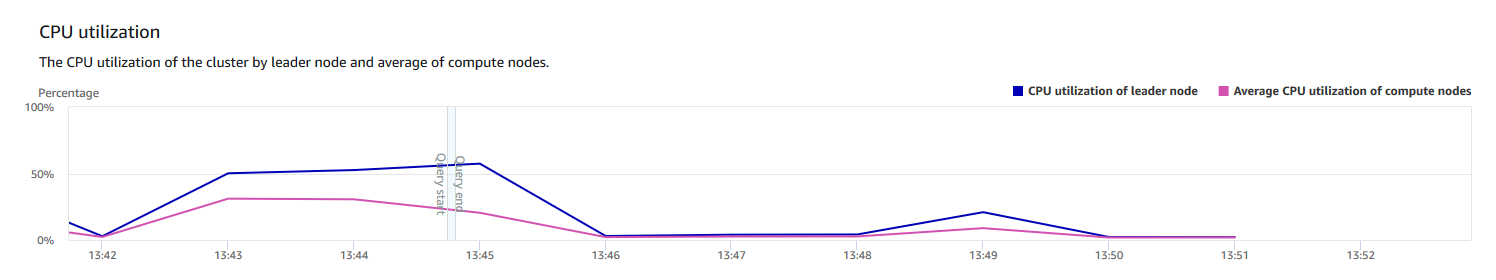
-
CPU utilization
-
Storage capacity used
-
Active database connections
-