Amazon Redshift will no longer support the creation of new Python UDFs starting November 1, 2025.
If you would like to use Python UDFs, create the UDFs prior to that date.
Existing Python UDFs will continue to function as normal. For more information, see the
blog post
Query and Database Monitoring
This document describes the Query and Database Monitoring page, an Amazon Web Services Management Console feature for analyzing the performance of an Amazon Redshift provisioned cluster or serverless workgroup, and the queries run against them.
You can investigate the following scenarios using the Queries and Database Monitoring page:
Monitor data warehouse metrics during a specified time period
How a query contribues to the overall performance of a data warehouse
See a breakdown of a query run time into its life cycle events such as lock wait time, compile time, and execution time
Which users run the most resource-intensive queries during a specified time period
Monitor how patch events affect query performance
Permissions
The privileges of the Amazon Web Services account you use to access the console affects which queries the
Query and Database Monitoring page shows. By default, you can only view
your own queries. To view queries owned by other users, grant the SYS:MONITOR role
to your account. To allow a user to end running queries from the Query and Database Monitoring
page, grant the user the SYS:OPERATOR privilege.
To automatically assign the sys:monitor role to an IAM
user or role for Amazon Redshift Serverless or provisioned, run the following commands:
create role monitor;
grant role sys:monitor to role monitor;
To update the IAM role used for query monitoring, do the following:
Choose the Tags tab.
Choose Manage tags.
Add a tag with key
RedshiftDbRolesand valuemonitor.Save changes
To add database credentials to a user, run the following command:
grant role sys:monitor to<username>
For information about using the GRANT command, see GRANT in the Amazon Redshift Database Developer Guide.
To use query monitoring, your IAM user needs permissions to access the Amazon Redshift data plane. Ensure that your IAM user has the following permissions in their permissions policy:
{
    "Sid": "DataAPIPermissions",
    "Action": [
        "redshift-data:ExecuteStatement",
        "redshift-data:CancelStatement",
        "redshift-data:GetStatementResult",
        "redshift-data:DescribeStatement",
        "redshift-data:ListDatabases"
    ],
    "Effect": "Allow",
    "Resource": "arn:aws:redshift-serverless:us-west-2:123456789012:workgroup/01234567-89ab-cdef-0123-456789abcdef"
},
Temporary credentials using your IAM identity
This option is only available when connecting to a cluster. With this
method, Query and Database Monitoring maps a user name to your IAM identity and generates a
temporary password to connect to the database as your IAM identity. A user
using this method to connect must be allowed IAM permission to
redshift:GetClusterCredentialsWithIAM. To prevent users
from using this method, modify their IAM user or role to deny this
permission.
Query and Database Monitoring Console
This section describes using the Query and Database Monitoring console page.
You can use the Query and Database Monitoring console to quickly get an overview of your data warehouse's performance. You can monitor your data warehouse's performance over time, and examine the performance of a data warehouse's provisioned clusters or individual queries, so as to best identify bottlenecks and other areas to improve.
The Query and Database Monitoring page has the following features:
Increased security — You need elevated privileges to monitor queries for other users. For more information, see Permissions.
Seven-day query history — Guaranteed access to seven days of query history
Query monitoring — You can monitor queries in provisioned clusters and serverless workgroups at the user query level.
Query trend analysis — You can compare the performance of similar queries that match specified criteria.
To access the Query and Database Monitoring page, do the following:
Sign in to the Amazon Redshift console at https://console.amazonaws.cn/redshiftv2/
. Choose Query and database monitoring from the navigation pane.
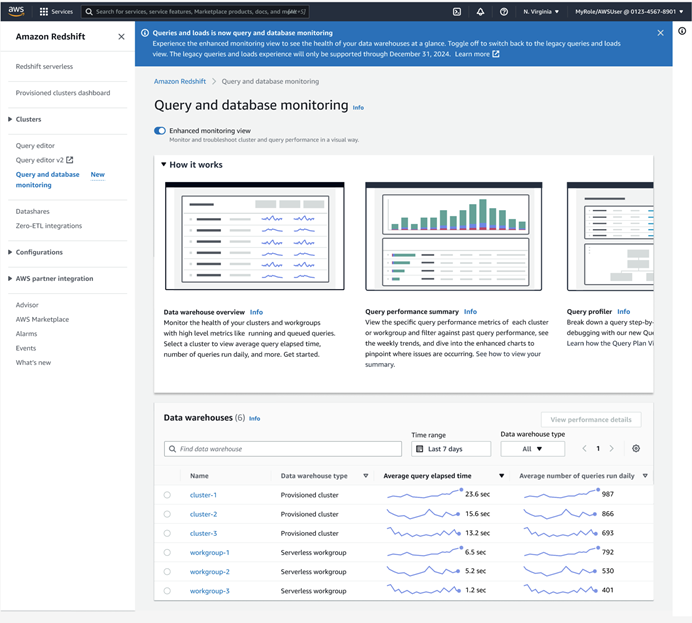
The Query and database monitoring console page appears as follows:

The Query and database monitoring page has the following components:
Data warehouse overview — Monitor the average query performance for your provisioned clusters and serverless workgroups. You can quickly see performance issues for a specific cluster or workgroup by examining the statistics on this page for spikes or periods of high activity.
Query performance summary — Monitor the average query performance for a specific provisioned cluster or serverless workgroup. You can also acccess the Query performance summary page by clicking on one of the clusters or workgroups in the Data warehouse overview list.
Query performance summary
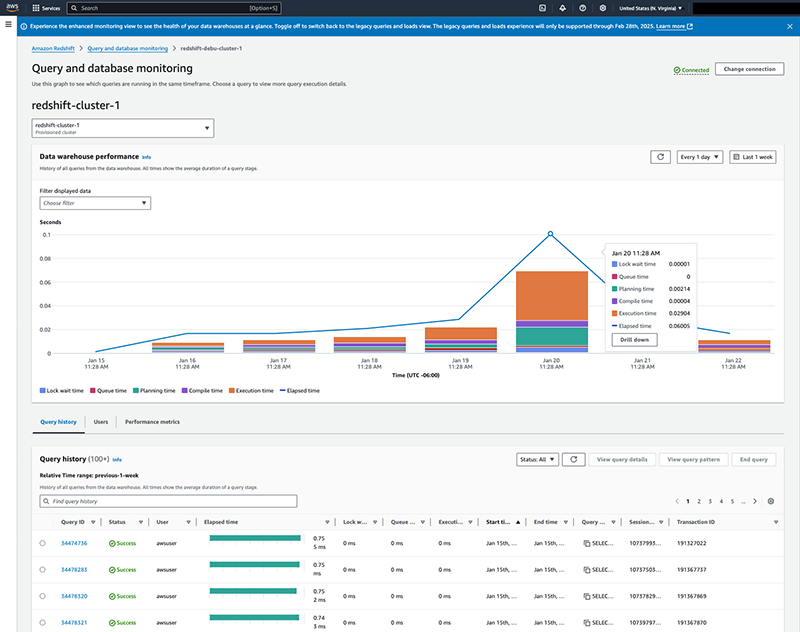
When you choose Query performance summary from the Query and database monitoring page, or a cluster or workgroup from the Data warehouse overview page, the console shows a summary of the performance for an individual provisioned cluster or serverless workgroup.

This page has the following components:
Cluster or workgroup dropdown — Choose the cluster or workgroup you want to analyze.
Data warehouse performance — This pane shows a history of the cluster or workgroup within the specified time period, showing the amount of time spent on each phase of queries. If you see a spike in a certain query phase, such as the increased planning and execution time on January 20 in the preceding graphic, you can use this information to identify issues with the performance of your queries. The default time period shown is the last seven days, but you can adjust the time period according to your analysis needs.
Query history — This pane shows a history of the performance of every query run within the specified filters. You can use this information to troubleshoot the performance of an individual query. To further analyze a specific query, you can choose it from this graph or from the Data warehouse performance graph.
When you hover over a data point on the chart, a popup appears. This popup displays the breakdown of time metrics for that data point. If a data point contains query data, you can choose Drill down to update the time range of the chart to the next smallest time unit of the data point. These time units are as follows:
Day
Hour
15 minutes
5 minutes
1 minute
For example, if you choose Drill down on a data point, the range of the graph changes to one day. Choosing Drill down again changes the range of the graph to one hour.
Query profiler — A graphical tool for monitoring query performance. For more information, see Query profiler.
Query details
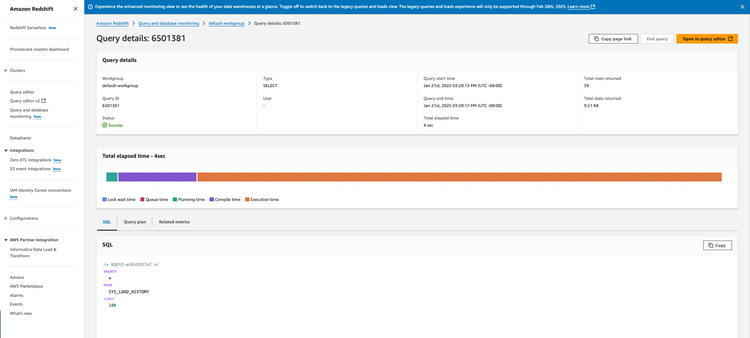
When you choose a query from the Data warehouse performance or Query history pane of the cluster or workgroup detail page, the Query details page opens.

For information about the Query details page, see Query details page.
Query pattern
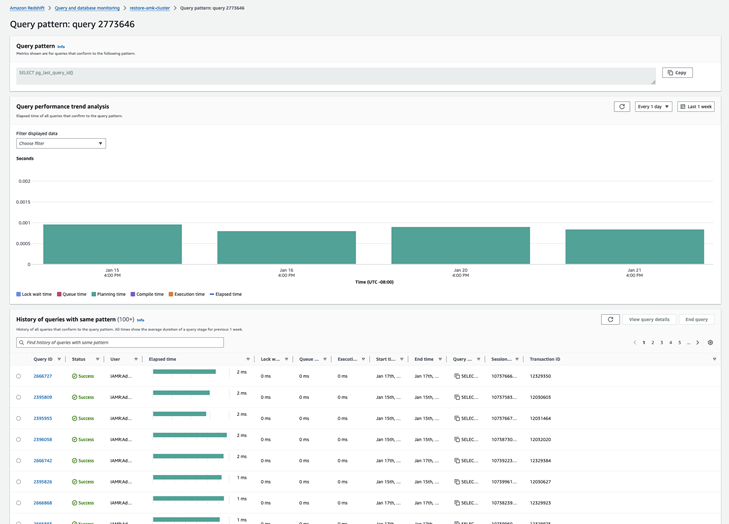
You can see a history of queries with the same pattern by choosing the View query pattern button in the Query history pane of the Query performance summary page. The Query pattern page shows all of the queries from the past week that are retrieved by a SQL statement that you specify.

The Query pattern page has the following components:
Query pattern — The SQL statement that retrieves the queries being analyzed.
Query performance trend analysis — A bar graph showing the elapsed time of all the queries that the query pattern selects. The results are grouped by day.
History of queries with the same pattern — The time taken for each phase of the queries that the query pattern selects.
Using the Query pattern page, you can gain the following insights:
Trends for queries that run at a specific time every day
Spikes in run time for queries that you run regularly against the data warehouse.