Download the SageMaker Debugger profiling report
Note
End of support notice: On June 30, 2027, Amazon will end support for Amazon SageMaker Profiler. After June 30, 2027, you will no longer be able to access the Profiler console or Profiler resources. For more information, see Profiler availability change.
Download the SageMaker Debugger profiling report while your training job is running or after
the job has finished using the Amazon SageMaker Python SDK
Note
To get the profiling report generated by SageMaker Debugger, you must use the built-in ProfilerReport rule offered by SageMaker Debugger. To activate the rule with your training job, see Configure Built-in Profiler Rules.
Tip
You can also download the report with a single click in the SageMaker Studio Debugger insights dashboard. This doesn't require any additional scripting to download the report. To find out how to download the report from Studio, see Open the Amazon SageMaker Debugger Insights dashboard.


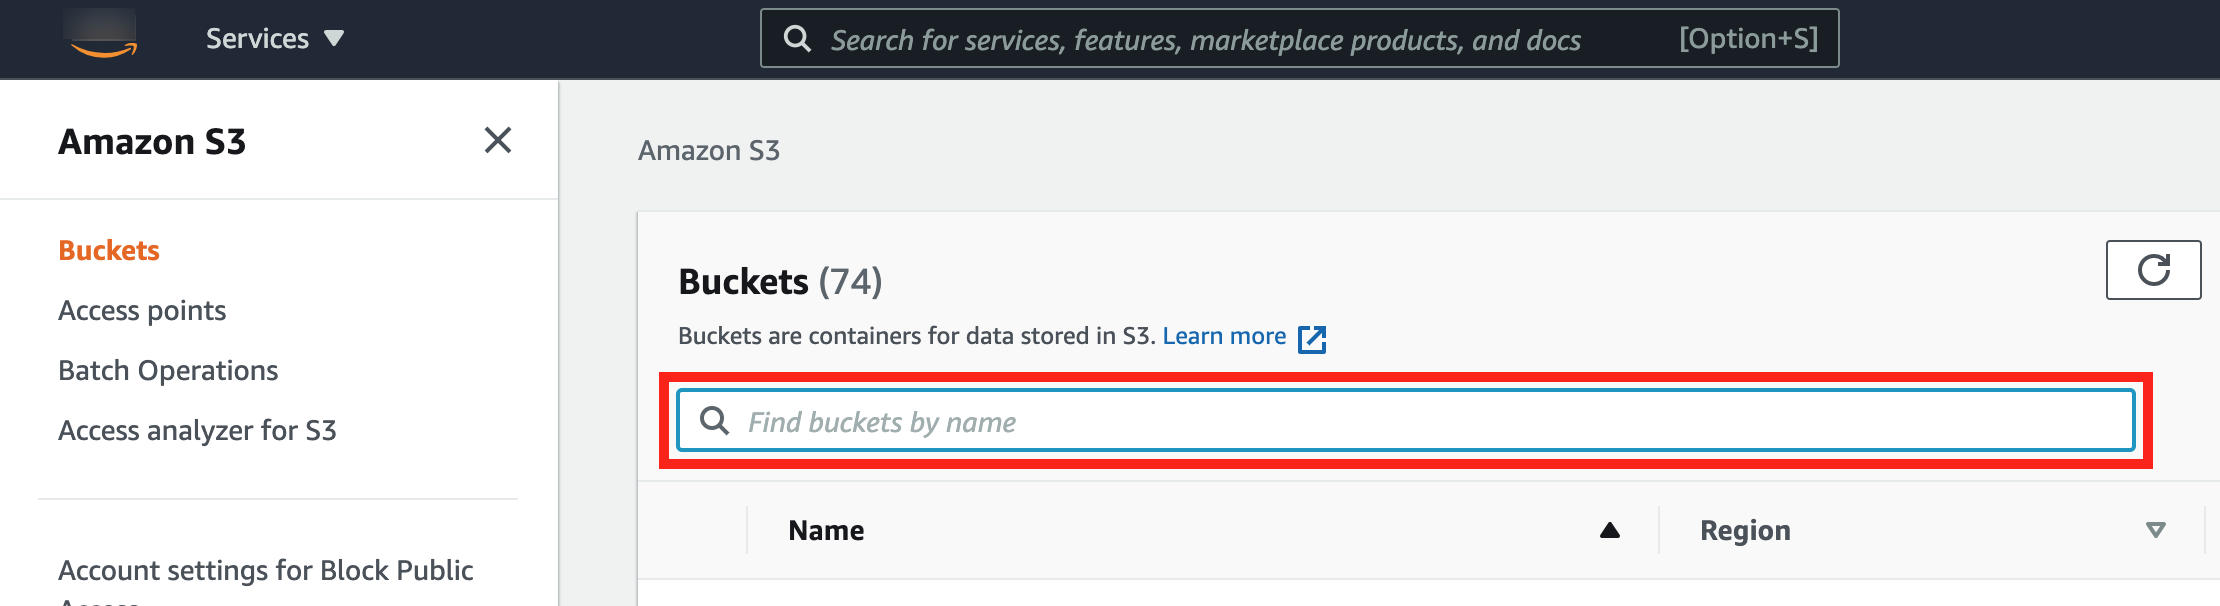
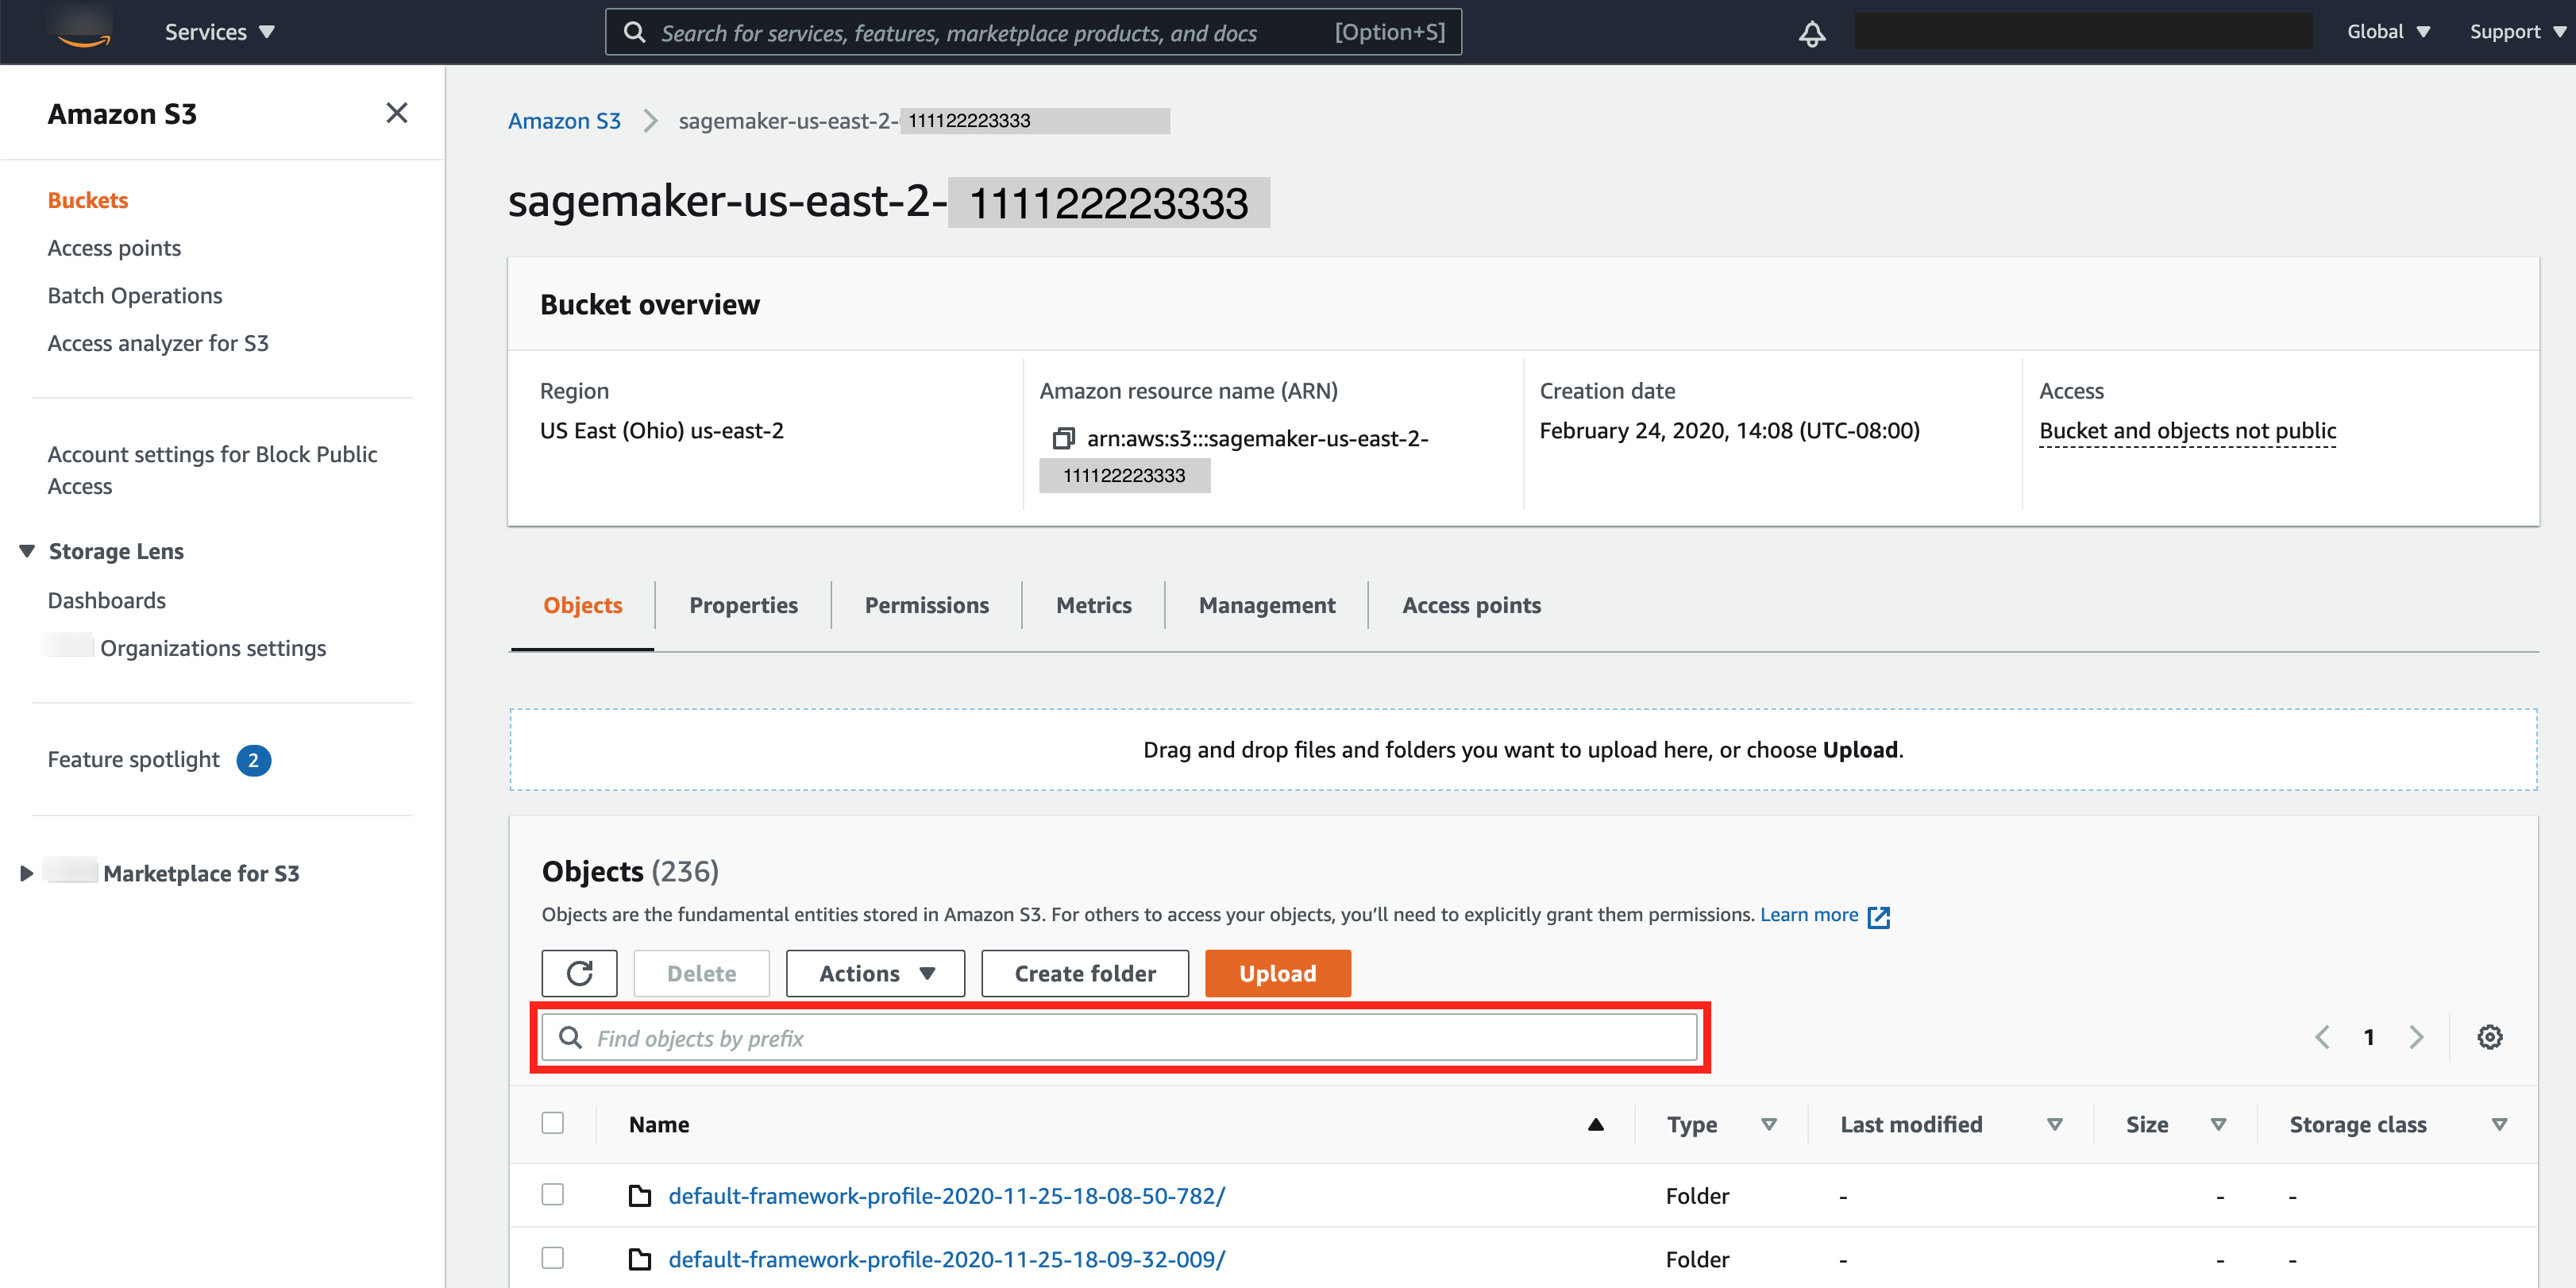
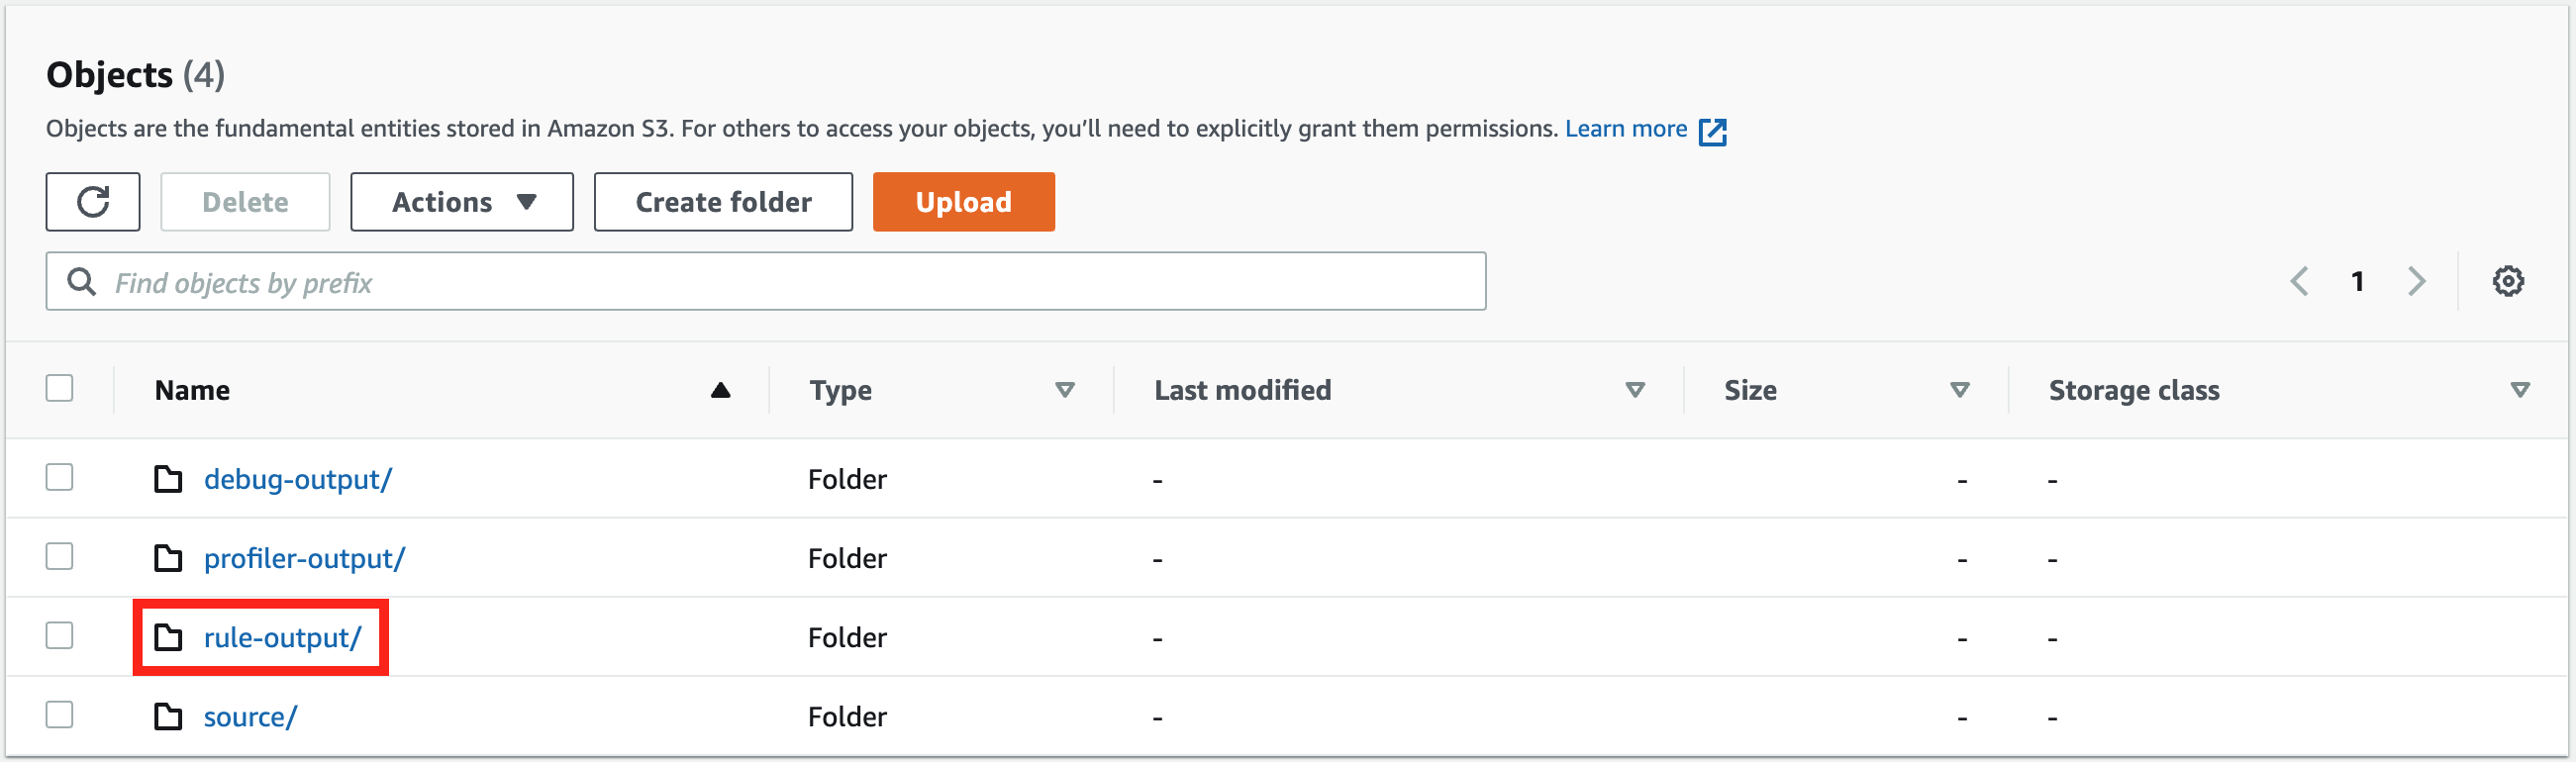
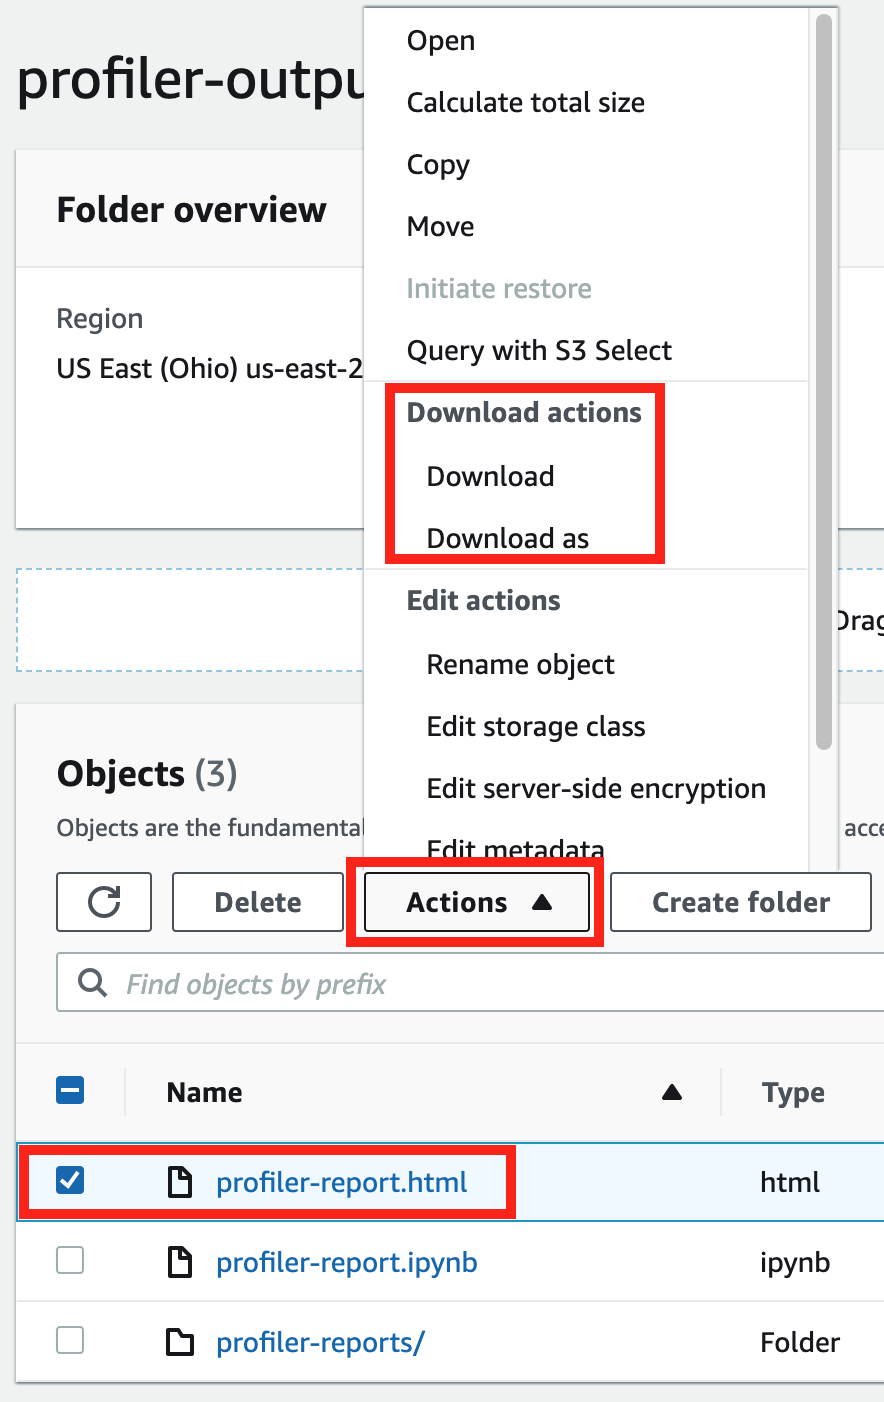
Note
If you started your training job without configuring the Debugger-specific
parameters, Debugger generates the report based only on the system monitoring rules
because the Debugger parameters are not configured to save framework metrics. To
enable framework metrics profiling and receive an extended Debugger profiling report,
configure the profiler_config parameter when constructing or updating
SageMaker AI ModelTrainers.
To learn how to configure the profiler_config parameter before
starting a training job, see Estimator configuration for framework profiling.
To update the current training job and enable framework metrics profiling, see Update Debugger Framework Profiling Configuration.